Anaes · Measurement & monitoring physics
Capnography and anaesthetic gas analysis
Also known as Capnography · Waveform capnography · End-tidal CO2 · Infrared gas analysis · Sidestream capnograph · Mainstream capnograph
Capnography is the continuous, breath-by-breath display of carbon-dioxide concentration against time, and alongside it the analysis of oxygen, nitrous oxide and the volatile anaesthetic agents in the breathing circuit. It is the single monitoring modality whose absence has been directly linked to anaesthetic airway deaths, and the physics that underpins it sits at the heart of the Primary examination. The framework rests on eight exam-critical ideas. First, INFRARED ANALYSIS exploits the fact that any gas whose molecule has two or more dissimilar atoms (CO2, N2O, the volatile agents, water vapour) absorbs infrared radiation at specific wavelengths — CO2 absorbs strongly at 4.3 micrometres — and the BEER-LAMBERT LAW converts that absorption into a concentration: a hot infrared source emits through the gas sample to a detector, and the fraction of light absorbed is proportional to the concentration of the absorbing gas. Second, the analysers come in two architectures: SIDESTREAM, which aspirates gas via a narrow sampling line at 50 to 200 mL per minute to a distant analyser in the machine (allowing multigas analysis but imposing a transport delay of a few seconds), and MAINSTREAM, in which the sensor sits directly on an airway adapter (faster and delay-free but bulky, fragile, and adding a little dead space). Third, the NORMAL CAPNOGRAM has four phases per breath — phase 0 the inspiratory baseline at zero, phase I the expiratory dead-space flat portion, phase II the rapid alveolar upstroke, phase III the alveolar plateau ending in the end-tidal value — with the ALPHA angle between phases II and III and the BETA angle at the inspiratory downstroke. Fourth, the ABNORMAL TRACE is a pattern-recognition test: absent CO2 is oesophageal intubation, apnoea or disconnection; a rising baseline is rebreathing, absorbent exhaustion or a Bain-circuit fault; a relentlessly rising end-tidal value is malignant hyperthermia, sepsis, hyperthermia, thyrotoxicosis or tourniquet release; a low end-tidal value is hyperventilation, low cardiac output, pulmonary embolism or cardiac arrest. Fifth, the PA-ETCO2 GRADIENT is normally only 2 to 5 mmHg and widens whenever dead space or ventilation-perfusion mismatch increases (COPD, pulmonary embolism, low cardiac output), so the end-tidal value UNDERESTIMATES the arterial PaCO2 when the gradient is large. Sixth, in CARDIOPULMONARY RESUSCITATION the end-tidal CO2 is a real-time index of cardiac output and chest-compression quality — a value persistently below 10 mmHg after 20 minutes carries a very poor prognosis, while a sudden rise may indicate return of spontaneous circulation. Seventh, the AGENT ANALYSERS use the same infrared principle across a broader band: each volatile agent (sevoflurane, desflurane, isoflurane, halothane) has a characteristic infrared absorption spectrum that lets the analyser identify which agent is present, with compensation for the overlapping absorption of N2O and CO2. Eighth, OTHER TECHNIQUES — RAMAN SCATTERING (each gas scatters light at a unique wavelength shift) and MASS SPECTROMETRY (separation by mass-to-charge ratio) — allow true simultaneous multigas analysis but are too bulky and costly for routine theatre use, while OXYGEN is measured paramagnetically and NITROGEN is calculated by subtraction. The circle system closes the loop with a CARBON-DIOXIDE ABSORBENT — soda lime (calcium hydroxide with sodium and potassium hydroxide, an indicator dye turning purple when exhausted, capacity around 25 L of CO2 per 100 g) or the newer safer Amsorb-type absorbents that lack the strong bases which degrade volatile agents. Built on the Integrated Pulmonary Index review (Ozden Sertcelik 2026), the near-infrared-spectroscopy paediatric-outcomes study (Gabriel 2026), the EtCO2-during-CPR work (Singh 2026), the exhaled-breath machine-learning analysis (Wang 2026), the breath-hydrogen dynamics data (Okumura 2026), the VOCORDER breath-analysis study (Kontopidou 2026), the oesophageal-intubation-recognition review (Groeneveld 2026), and the ILCOR Pediatric Life Support 2025 summary (Sankar 2026).
On this page & tools
Your progress
Saved locally on this device.
8 MCQs with explanations
Target exams
Red flags
Why this matters to the anaesthetist
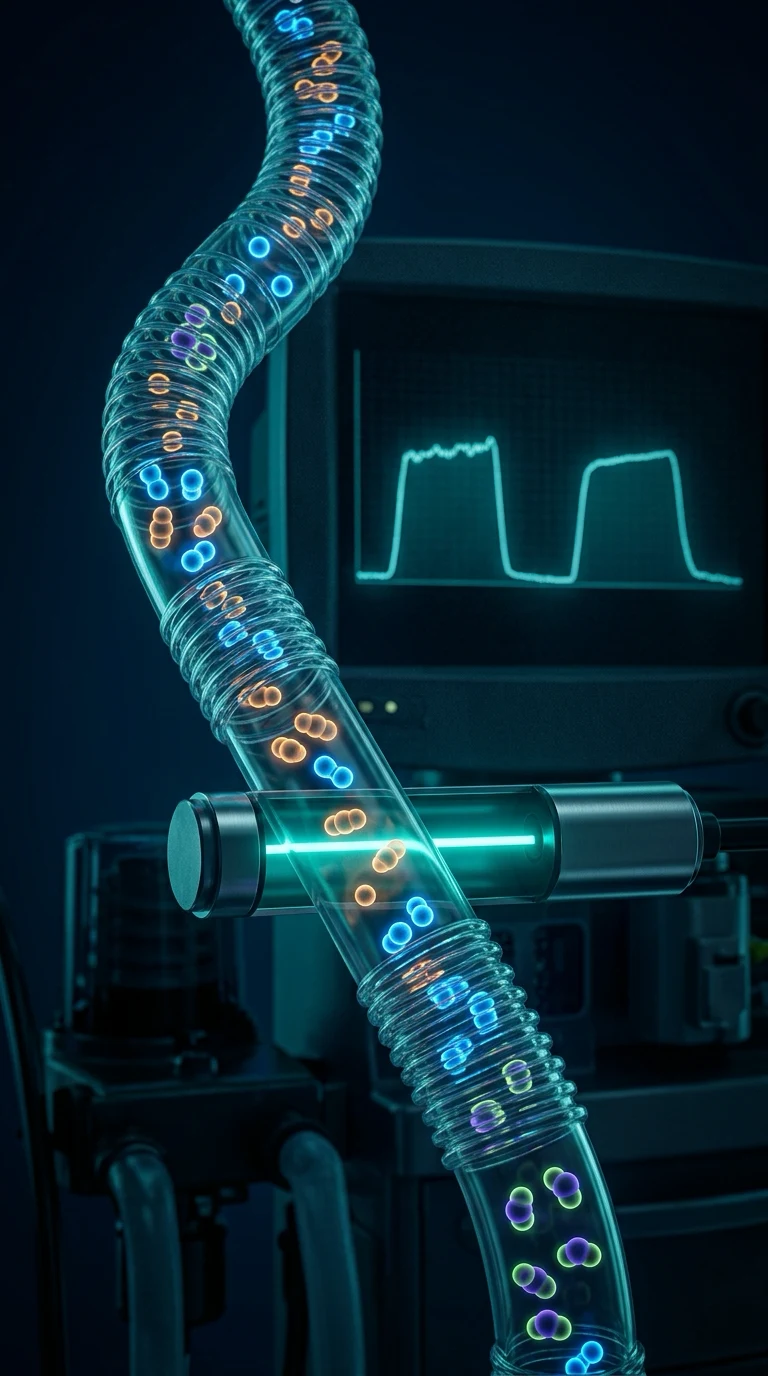
Capnography is the continuous, breath-by-breath display of carbon-dioxide concentration against time, and it is the one monitor whose absence has been directly tied to anaesthetic mortality. The Fourth National Audit Project (NAP4) found that airway deaths occurred in theatres where capnography was available but not used, or was used but not trusted; the subsequent mandate is that continuous waveform capnography must run wherever a tracheal tube or supraglottic airway is in place, in every location a patient is anaesthetised or sedated [7]. The reason capnography earns this status is that it answers a stack of distinct questions in a single waveform: Is the tube in the trachea? Is the patient being ventilated? Is the circuit intact? Is the absorbent working? Is the patient's metabolism and circulation stable? No other monitor does all of this at once.
Beyond the carbon-dioxide trace, the same infrared optics in a modern anaesthetic machine simultaneously analyse the volatile agent and nitrous oxide, telling the anaesthetist not only that the patient is breathing sevo but how much, and confirming that the agent dial and the delivered concentration agree. The physics underpinning all of this — the absorption of infrared light by polyatomic gases, the Beer-Lambert law, and the engineering trade-offs between sidestream and mainstream sampling — is a perennial Primary-examination topic because it is the cleanest illustration of how a physical principle becomes a life-saving monitor [1][4].
Infrared CO2 analysis principle (the Beer-Lambert law)
The physical basis of capnography is that carbon dioxide is a polyatomic molecule and therefore absorbs infrared radiation. A molecule absorbs infrared light only when the radiation's frequency matches a vibrational mode of the molecule and that vibrational mode produces a change in the dipole moment. Carbon dioxide satisfies this at several wavelengths, most usefully at 4.3 micrometres (an asymmetric stretch), where its absorption is intense and distinct from the other respiratory gases. The agent analysers and nitrous-oxide channel use other bands — N2O absorbs near 4.5 micrometres and the volatile agents have their own fingerprint regions — but CO2 at 4.3 micrometres is the workhorse [4].
The instrument itself is a spectrophotometer applied to a gas. An infrared source — historically a hot wire, now more often a pulsed infrared LED or a micro-machined thermal emitter — emits a broad band of radiation through a sample chamber containing the gas to be analysed. On the far side, an optical filter selects the narrow band around 4.3 micrometres and a photodetector measures the light that gets through. A reference channel, passing through a chamber free of CO2 or through a different wavelength, provides the denominator. The fraction of light absorbed is converted into a concentration by the Beer-Lambert law — the absorbance is proportional to the concentration of the absorbing species and the path length — with the usual empirical calibration curve stored in the device [1].
Two refinements matter. First, water vapour and nitrous oxide also absorb in the infrared and would confound the CO2 reading, so the analyser either filters their bands out, subtracts them by measuring them on separate channels, or compensates arithmetically. Second, because the absorption bands are pressure- and temperature-sensitive, modern analysers correct for ambient pressure and sample temperature. Oxygen and nitrogen, being symmetrical diatomic molecules, have no infrared absorption and are invisible to this technique — which is why they are measured by other means (paramagnetic for oxygen, by subtraction for nitrogen). [1]
Sidestream vs mainstream capnography
The infrared bench can be placed in one of two places relative to the patient, and the choice defines the two architectures. [1]
In sidestream capnography, a narrow sampling line aspirates a small fraction of the breathing gas — typically 50 to 200 mL per minute — from a port at the patient end of the circuit and carries it to the analyser housed inside the anaesthetic machine or a separate monitor. The advantages are that the heavy, delicate, power-hungry analyser stays on the cart; the same bench can measure CO2, N2O and the volatile agents simultaneously (true multigas analysis); and the sampling line is light, cheap and disposable. The price is a transport delay of one to a few seconds (the gas must travel the length of the sampling line), a sampling rate that must be scavenged or returned to the circuit, and vulnerability to the line kinking, blocking or accumulating water [1].
In mainstream capnography, the infrared sensor is built into an airway adapter that sits directly in the breathing circuit between the tracheal tube and the Y-piece. The light path crosses the adapter itself, so there is no sampling delay and the response is effectively instantaneous. The adapter adds a small amount of dead space (relevant in paediatrics), the sensor is bulky, heavy and fragile, it must be heated to prevent condensation, and it can measure only CO2 — it cannot do multigas agent analysis because the single fixed filter is tuned to 4.3 micrometres [1].
The practical rule: most theatre capnographs are sidestream, because the ability to analyse agents as well as CO2 from a single sample is worth the few seconds of delay. Mainstream is reserved for the situations where delay is unacceptable — transport, neonates and small infants (where dead space is acceptable in exchange for the fast response and the low sample draw), and cardiac arrest (where the immediate feedback matters) [3].
The normal capnogram
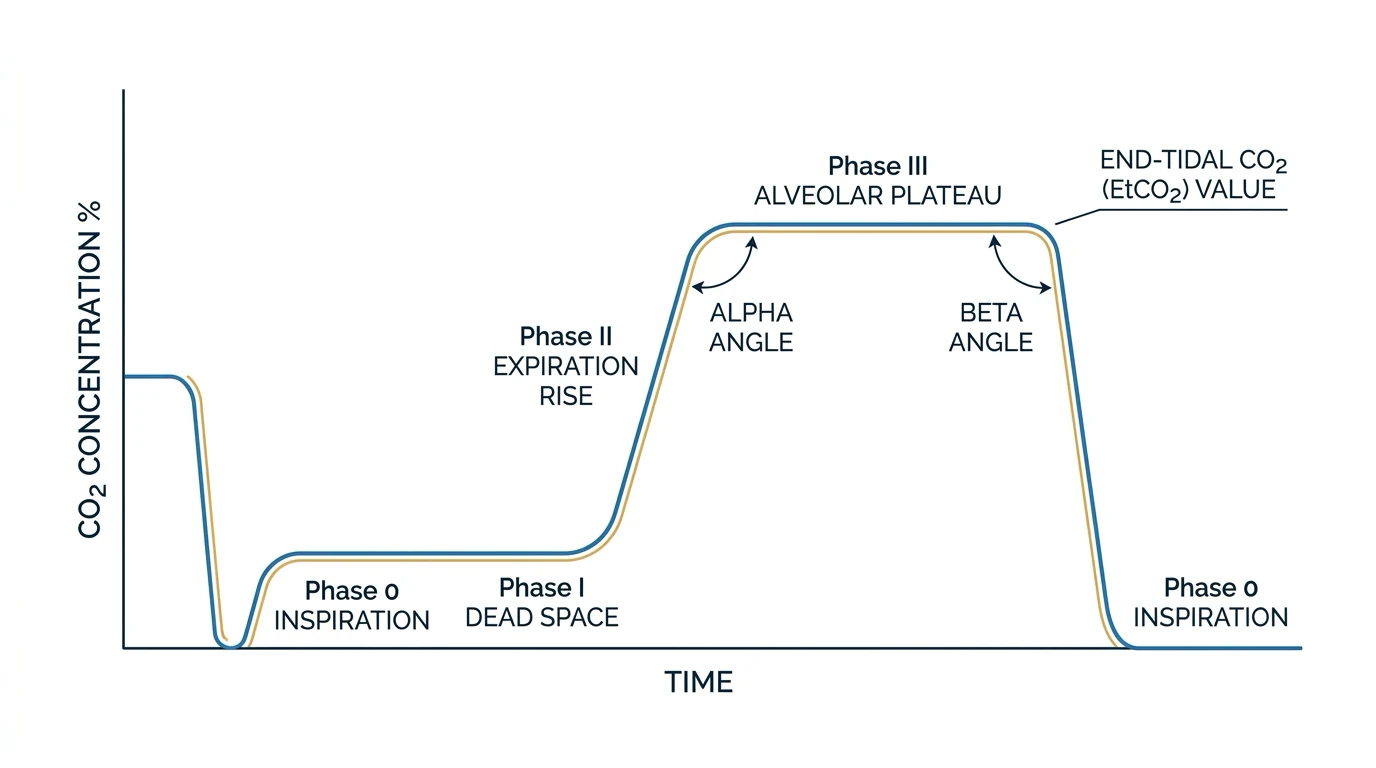
The normal single-breath capnogram is a plot of CO2 concentration (or partial pressure) on the y-axis against time (or expired volume) on the x-axis. Each breath produces a characteristic shape with four phases [1]:
- Phase 0 — the inspiratory baseline. During inspiration, fresh gas free of CO2 sweeps through the sensor, so the trace falls vertically to and sits at zero. This flat baseline at zero is itself diagnostic: any CO2 in the inspired gas means rebreathing or absorbent failure.
- Phase I — the expiratory dead-space portion. At the start of expiration, the gas leaving the lungs is the anatomical dead space (the gas in the conducting airways that never reached the alveoli), which is fresh gas and therefore still reads zero. The trace remains flat.
- Phase II — the alveolar upstroke. As expiration continues, alveolar gas — rich in CO2 — begins to mix with and then displace the dead-space gas. The trace rises sharply, an almost vertical upsweep, over a small fraction of a second.
- Phase III — the alveolar plateau. Once the dead space is flushed and pure alveolar gas is flowing past the sensor, the CO2 concentration is nearly constant, with only a slight upward slope. The highest point of this plateau is the end-tidal CO2 (EtCO2), the value displayed on the monitor. It is normally 4 to 6 kPa (35 to 45 mmHg), just below the arterial PaCO2. [1]
Two angles are described. The alpha angle is the angle between phases II and III — the transition from the upstroke to the plateau. It widens with airway obstruction or ventilation-perfusion mismatch, where the emptying of lung units becomes less synchronous and the plateau slopes more steeply. The beta angle is the angle between the end of phase III and the inspiratory downstroke (phase 0); it is close to 90 degrees in a normal trace and becomes more obtuse with rebreathing, when the downstroke does not return cleanly to zero [1].
A small upward slope of phase III is normal (gas from slowly emptying units arrives late and slightly richer in CO2), but a steep slope signals heterogeneous emptying — chronic obstructive lung disease, bronchospasm, or any cause of uneven ventilation. [1]
Capnogram abnormalities
Most capnogram pathology is a pattern-recognition exercise: a few archetypal traces map to a short list of causes [7].
- No CO2 at all (a flat trace at zero). This is the most alarming pattern and means that either no CO2 is being delivered to the sensor or no gas is moving. The first and most urgent diagnosis is oesophageal intubation — the tube is in the oesophagus, the stomach is being ventilated, and no alveolar gas reaches the sensor. A trace that is flat from the moment of intubation, or that shows a few small diminishing peaks that fade to zero over the first half-dozen breaths (the last gasp of CO2 washed out of the lung during a brief period of tracheal ventilation before the tube slipped out) is oesophageal. The other causes are apnoea (the ventilator is disconnected or the patient is not breathing), and circuit disconnection or a large leak. The NAP4 lesson is that auscultation, chest movement and tube misting are not confirmation of tracheal placement — only a sustained square-wave capnogram over several breaths is [7].
- An elevated baseline (failure to return to zero). The inspired gas contains CO2, which means the patient is rebreathing it. Causes are an exhausted CO2 absorbent, a malfunctioning one-way valve in the circle system, a Bain-circuit inner-tube leak (a coaxial Mapleson D system), or an inadequate fresh-gas flow in a non-rebreathing system. The whole trace is shifted upward, the beta angle is lost, and the arterial PaCO2 climbs.
- A rising baseline and a rising EtCO2 together. This is the metabolic pattern — more CO2 is being produced than the ventilation can clear, or the produced CO2 is being added to a rebreathing circuit. The headline diagnosis is malignant hyperthermia, where a rapidly and relentlessly rising EtCO2 unresponsive to increased ventilation is an early red flag, often preceded by a rising baseline. The other causes are sepsis and hyperthermia, thyrotoxicosis, tourniquet release (a limb's worth of ischaemic metabolites and CO2 dumped into the circulation), CO2 insufflation in laparoscopy, and bicarbonate or glucose administration.
- A low EtCO2. Either the patient is over-ventilating (hyperventilation), or less CO2 is reaching the lungs because the cardiac output has fallen — low cardiac output, pulmonary embolism (the clot cuts perfusion to a large fraction of the lung, so CO2 delivery drops sharply), or cardiac arrest. A sudden fall in EtCO2 with stable ventilation is a pulmonary-embolism warning until proven otherwise.
- A high EtCO2 with a normal baseline. Simple hypoventilation, or a hypermetabolic state without rebreathing (the plateau rises but the inspired gas is still clean).
- A progressively slanted phase III. Uneven emptying of the lung — chronic obstructive lung disease, bronchospasm, partial airway obstruction, or a kinked or partially obstructed tube.
- An oscillating or crenellated trace. The patient is breathing against the ventilator (inadequate paralysis or depth, or patient-ventilator dyssynchrony), or there is cardiac oscillation — the heart's beat jiggles the gas in the airways at the end of expiration.
The Pa-EtCO2 gradient
The end-tidal CO2 is not the arterial PaCO2 — it is a surrogate, and the gap between them is one of the most useful numbers in monitoring. In a healthy, well-perfused lung with homogeneous ventilation, the gas at the end of expiration is nearly pure alveolar gas, and the alveolar CO2 (which equilibrates with the arterial blood across the alveolar-capillary membrane) is almost identical to the arterial PaCO2. The Pa-EtCO2 gradient is normally only 2 to 5 mmHg (about 0.3 to 0.7 kPa), the small difference reflecting the mixing of some dead-space gas into the final expired sample [1].
The gradient widens whenever alveolar gas that contains CO2 fails to reach the sensor — that is, whenever dead space increases or ventilation-perfusion mismatch grows. The classical causes are chronic obstructive lung disease (uneven emptying means the end-tidal sample is diluted with dead-space gas), pulmonary embolism (perfused but unventilated alveoli contribute no CO2 to the expired gas, so EtCO2 falls while PaCO2 is maintained), low cardiac output and cardiac arrest (less CO2 delivered to the lung per unit time), emphysema, and any cause of a large physiological dead space [3].
The clinical corollary, easily missed, is that when the gradient is wide, the EtCO2 underestimates the PaCO2. A patient with severe COPD may have an EtCO2 of 5 kPa and a PaCO2 of 9 kPa; a patient in cardiac arrest may have a barely-detectable EtCO2 and a profoundly acidotic PaCO2. In any state with a large dead space, the capnogram confirms the presence of ventilation and circulation but cannot be trusted for the absolute PaCO2 — only an arterial blood gas can do that [3].
Capnography in CPR
In cardiopulmonary resuscitation, the end-tidal CO2 becomes a real-time surrogate for cardiac output, because the only CO2 that reaches the lungs is the CO2 that the compressions deliver. With good compressions, the EtCO2 settles around 25 to 35 mmHg; with shallow or off-target compressions, or with a tiring rescuer, it falls; when compressions are corrected it rises again. This makes the capnogram the single best real-time feedback signal for chest-compression quality, superior to pulse checks and end-tidal alone can guide the team to adjust depth, rate and hand position [3][8].
The prognostic threshold is well established. An EtCO2 that remains below 10 mmHg after 20 minutes of well-conducted advanced life support carries a vanishingly small chance of survival to discharge — the test is used, alongside other factors, to guide the decision to cease resuscitation. Conversely, a sudden rise in EtCO2 during CPR is a sensitive sign of return of spontaneous circulation (ROSC) — the recovered cardiac output suddenly delivers a bolus of CO2-rich venous blood to the lungs, and the trace jumps, often before a pulse is palpable [3][8].
The capnograph during CPR also confirms that the tracheal tube is in place (the most error-prone moment of an arrest), detects any disconnection, and — once ROSC is achieved — guides post-arrest ventilation toward a normocapnic target, since both hypo- and hypercapnia worsen the injured brain [7].
Anaesthetic agent analysis
The same infrared principle, applied across a broader band of wavelengths, allows the volatile anaesthetic agents to be identified and quantified. Each agent — sevoflurane, desflurane, isoflurane, halothane, enflurane — has a polyatomic molecule with a characteristic infrared absorption fingerprint, a set of absorption peaks at specific wavelengths that differs from one agent to the next. The agent analyser samples across several bands and, by matching the pattern of absorptions to a library of agent spectra, both identifies which agent is present and measures its concentration [4].
This is a genuine identification, not a generic volatile reading: the analyser can tell sevo from iso, and will flag a mismatch between the agent dialled on the vaporiser and the agent detected in the circuit (the signature of a vaporiser filled with the wrong agent). The nitrous-oxide channel runs in parallel, exploiting N2O's absorption near 4.5 micrometres, and a separate CO2 channel gives the capnogram. The complication is cross-sensitivity: the absorption bands of CO2, N2O and the volatile agents overlap, and the presence of one biases the reading of the others unless the analyser applies the compensation algorithms built into modern machines. The analyser therefore typically reports inspired and expired concentrations of each agent, allowing the anaesthetist to see the agent being taken up (the inspired greater than expired gap narrowing with time) and to watch for the inspired-expired equilibrium that signals a stable depth [4].
Other gas analysis techniques
Infrared is not the only way to analyse the breathing gases, and two other techniques deserve mention because they appear in the Primary examination even though they are not routine theatre equipment [4].
Raman scattering. When a photon strikes a gas molecule, almost all of it is scattered elastically (Rayleigh scattering, no change in wavelength), but a tiny fraction is scattered inelastically — the photon either donates energy to or receives energy from a molecular vibration, and emerges at a wavelength shifted from the incident light by an amount that is unique to the gas species. Each gas therefore produces a characteristic Raman shift, and by passing a laser through the sample and analysing the scattered light, several gases can be identified and quantified simultaneously (CO2, O2, N2, N2O and the volatiles, including the otherwise-invisible nitrogen and oxygen). Raman analysis is fast and truly multigas, but the laser and the optics are bulky, costly and delicate, which has kept it out of routine theatre use [4].
Mass spectrometry. The gas sample is ionised and the resulting ions are accelerated through a magnetic or electric field that separates them by their mass-to-charge ratio; a detector counts each species. A mass spectrometer can measure every gas in the mixture simultaneously — including nitrogen and oxygen, which infrared cannot see — with high accuracy and a rapid response. Its drawbacks are again size, cost and complexity, and in modern practice it has been displaced by infrared plus paramagnetic analysers for routine use, surviving mainly in research and in some specialised lung-function laboratories. [1]
A newer research frontier applies ambient-ionisation mass spectrometry with machine learning to exhaled breath, identifying the volatile organic compounds that mark disease — a technique that promises breath-based diagnosis but is not yet a theatre monitor [4][6].
Oxygen and nitrogen analysis
The infrared capnograph cannot see oxygen or nitrogen, so the complete multigas picture needs other techniques [1].
Oxygen is measured paramagnetically — oxygen is one of the very few gases whose molecules (with two unpaired electrons) are attracted into a magnetic field, while nitrogen, CO2, N2O and the volatiles are all diamagnetic. The paramagnetic analyser exploits this large difference (the dumb-bell or dual-chamber design) to give a fast, accurate, drift-free reading of the oxygen concentration in the breathing circuit; it is the standard inspired-oxygen monitor on the anaesthetic machine. The details are covered in the oxygen-measurement topic. [1]
Nitrogen has no convenient direct measuring technique for theatre use — it is neither polyatomic (so no infrared signature) nor paramagnetic — and is instead calculated by subtraction: the analyser measures oxygen, CO2, N2O and the volatile agent, and assumes the remainder of the gas mixture is nitrogen. This is adequate because nitrogen is a passive filler in the circle system (it is neither produced nor consumed), but it is the reason a nitrogen reading on a monitor is less direct than the others. [1]
The circle system and CO2 absorbent
The capnogram confirms that the circle system is doing its other job: removing the CO2 from the expired gas so that it can be rebreathed. The circle system is a low-flow, semi-closed breathing circuit in which the expired gas passes through a carbon-dioxide absorbent before returning to the patient; the only fresh gas added is the oxygen and agent consumed, which makes it economical and humidifying [1].
The classical absorbent is soda lime, a mixture of calcium hydroxide (Ca(OH)2) with sodium hydroxide and potassium hydroxide (the strong bases kick-start the reaction), and a small amount of silica to maintain porosity. An indicator dye — ethyl violet — turns the granules from white to purple as the absorbent is exhausted, a colour change that is the bedside sign to change the canister. The absorbing capacity is about 25 L of CO2 per 100 g of soda lime, though in practice the canister is changed when the colour change appears, when the inspired CO2 begins to rise, or at a routine interval [1].
The strong bases in soda lime are its weakness. They degrade volatile agents: sevoflurane is broken down to compound A (nephrotoxic in rats, of uncertain significance in humans), and desflurane and (historically) trichloroethylene can be degraded to toxic products including carbon monoxide (the classic "Monday-morning fire" in a dry canister). They can also generate heat and, in a desiccated canister, have been implicated in rare absorbent fires. The newer alkali-free absorbents — Amsorb, Litholyme, Dragersorb Free — replace the strong bases with calcium hydroxide alone or with weak salts, so they do not degrade volatile agents, do not generate carbon monoxide or compound A, and do not support combustion. They are slightly less efficient and a little more expensive, but they are safer, and modern practice has moved toward them. Their indicator dye is often a different colour (Amsorb turns from pink/white to blue/purple) [1].
Clinical applications and the Integrated Pulmonary Index
The capnogram, the pulse oximeter, the respiratory rate and the pulse rate together give a near-complete picture of the patient's cardiorespiratory status, and modern monitors increasingly fold these into composite indices. The best known is the Integrated Pulmonary Index (IPI), a dimensionless number derived from the EtCO2, the SpO2, the respiratory rate and the pulse rate by an algorithm that weights each input by its clinical importance and its trend. The IPI is displayed as a single integer (typically on a scale where 10 is normal and lower values flag deterioration) and is intended to give a single-glance summary of respiratory adequacy, particularly useful in procedural sedation, in paediatrics and in the recovery room, where a clinician watching several patients benefits from a single alarmable number [1].
The IPI is a decision-support tool, not a substitute for the underlying waveforms — it can be confused by the same artefacts that fool its inputs (motion, low perfusion, apnoea), and the individual trends remain more informative than the composite in the complex patient. But the principle it embodies — that the integration of several independent measurements is more robust than any one of them — runs through modern monitoring, from the smart alarms on the anaesthetic machine to the early-warning scores on the ward [1].
The other clinical roles of capnography are legion: confirming tracheal intubation; setting the ventilator to a normocapnic target (especially in the injured brain, where both hypo- and hypercapnia are harmful); detecting malignant hyperthermia early; estimating the PaCO2 non-invasively when the gradient is normal; guiding low-flow and closed-circuit anaesthesia (the agent and CO2 traces are the navigation); monitoring procedural sedation in the emergency department and on the ward; confirming continued tube placement during transport and patient transfer; and assessing the adequacy of CPR. In paediatric and neonatal practice, near-infrared spectroscopy complements capnography by adding a cerebral-oxygenation signal, the two together giving both global ventilation and regional perfusion [2][8].
Clinical
- Standard approach
- Evidence-based
Alternative
- Modified technique
- Risk-benefit
Red flags
[1]References
- [1]Ozden Sertcelik U, et al. The Association Between the STOP-Bang Score and the Integrated Pulmonary Index in Patients Undergoing Endobronchial Ultrasound with Sedation: The STOP OSA-IPI Cohort Study Medicina (Kaunas), 2026.PMID 42356047
- [2]Gabriel ED, et al. Correlation of noninvasive near-infrared spectroscopy with outcomes in pediatric traumatic brain injury J Neurosurg Pediatr, 2026.PMID 42361379
- [3]Singh A, et al. Diastolic blood pressure and end-tidal carbon dioxide during adult ICU cardiopulmonary resuscitation: association with return of spontaneous circulation Resuscitation, 2026.PMID 42331277
- [4]Wang W, et al. Nano-filter-integrated AIMS with machine learning: direct exhaled breath analysis for lung cancer screening Chem Sci, 2026.PMID 42326358
- [5]Okumura N, et al. Age differences in overnight breath hydrogen dynamics and their association with sleep physiology J Breath Res, 2026.PMID 42285108
- [6]Kontopidou F, et al. Evaluating the VOCORDER device for early disease detection through breath analysis: study protocol for a two-phase clinical study BMJ Open, 2026.PMID 42236089
- [7]Groeneveld NTA, et al. Recognition of esophageal intubation in Dutch prehospital emergency medical services using capnography analysis: a retrospective cohort study Resuscitation, 2026.PMID 41548748
- [8]Sankar J, et al. ILCOR Pediatric Life Support 2025: What is New and Why it Matters? Indian J Pediatr, 2026.PMID 42360534