Anaes · Measurement & monitoring physics
Hypothesis testing, p-values, confidence intervals and error
Also known as Hypothesis testing · p-values · Confidence intervals · Type I and Type II error · Statistical power · Sample size · Multiple testing · Effect size
Every anaesthetic trial asks whether a difference between two groups is real or the product of chance, and the framework that answers that question is hypothesis testing. The model rests on seven exam-critical ideas. First, the NULL HYPOTHESIS (H0) assumes no difference between groups and is presumed true until the evidence is strong enough to reject it; the ALTERNATIVE HYPOTHESIS (H1) asserts that a difference exists. Second, a TYPE I ERROR (alpha) is a FALSE POSITIVE — rejecting H0 when it is true — conventionally set at 0.05, and the p-value is the probability of the observed data or more extreme data IF H0 is true. Third, a TYPE II ERROR (beta) is a FALSE NEGATIVE — failing to reject H0 when it is false — conventionally set at 0.20. Fourth, POWER is 1 minus beta, the probability of correctly detecting a true difference, conventionally 0.80, and it rises with sample size, effect size and alpha and falls with variability; an underpowered study wastes resources and manufactures false negatives. Fifth, the p-value is widely misused — it is NOT the probability that H0 is true, a p less than 0.05 does not guarantee clinical importance, and multiple comparisons inflate the Type I error rate, corrected by the BONFERRONI method (divide alpha by the number of tests). Sixth, a CONFIDENCE INTERVAL is a range that contains the true population parameter with a specified probability (typically 95 percent), conveying both the effect size and its precision; if the CI crosses 1.0 for a ratio or 0 for a difference the result is not statistically significant. Seventh, the EFFECT SIZE (number needed to treat equals 1 divided by the absolute risk reduction; odds ratio and relative risk as measures of association) tells you HOW BIG a difference is, complementing the p-value which tells you only IF a difference exists; parametric tests (t-test, ANOVA) suit normal data, non-parametric tests (Mann-Whitney U, Kruskal-Wallis) suit non-normal data, and chi-squared suits categorical data; survival analysis uses Kaplan-Meier curves, the log-rank test and the hazard ratio for time-to-event outcomes such as time to recovery or time to first analgesic. Built on the cerebral autoregulation algorithm study (Albanese 2026), the emergence-hypertension risk-factor study (Jiao 2026), the hip-arthroplasty cohort (Ali 2026), the statistical-power commentary (Hanif 2026), the neurological-deterioration risk-prediction study (Chen 2026), the amyloid-beta memory study (Kawabe 2026), the retained-placenta outcomes study (Mukouyama 2026), and the evidence-hierarchies reflection (Tarrant 2026).
On this page & tools
Your progress
Saved locally on this device.
8 MCQs with explanations
Target exams
Red flags

Why this matters to the anaesthetist
Anaesthesia is an evidence-based speciality, and the evidence comes from trials whose conclusions hinge on statistics. When a new induction agent is reported to reduce hypotension, when a perioperative bundle is claimed to cut surgical-site infection, or when a monitor is said to detect desaturation earlier, the claim rests on a hypothesis test. The anaesthetist who reads the literature must know what a p-value actually means, what a confidence interval adds, how often a "negative" trial is simply an underpowered one, and when a statistically significant result is too small to matter clinically. Misreading these numbers has direct consequences: adopting an intervention on the strength of a false positive (a Type I error), or abandoning a genuinely effective one because an underpowered trial failed to reach significance (a Type II error). The cerebral-autoregulation algorithm and the risk-prediction models that increasingly inform perioperative care are only as trustworthy as the statistics beneath them, and the statistical-power commentary in the recent literature is a reminder that many anaesthesia studies remain underpowered [1][4][5].
Null and alternative hypotheses
Hypothesis testing begins by stating two mutually exclusive hypotheses about the population from which the study sample is drawn. The null hypothesis (H0) asserts that there is no difference between the groups — no difference in mean arterial pressure between two induction agents, no difference in nausea rates between two antiemetics, no true association between an exposure and an outcome. The alternative hypothesis (H1) asserts that a difference exists. The logic is asymmetrical and deliberately conservative: the null is assumed true until the evidence is strong enough to reject it, mirroring the "innocent until proven guilty" logic of a criminal trial. A study never "proves" the null; it can only fail to reject it. When the data are sufficiently unlikely under the null, the null is rejected in favour of the alternative. The framework forces the investigator to commit to a primary comparison in advance, which is why a pre-specified primary outcome is the cornerstone of a credible trial [8].
Type I error
A Type I error (alpha) is a false positive — rejecting the null hypothesis when it is in fact true, concluding a difference exists when none does. It is conventionally set at 0.05 (a 5 percent chance of a false positive), and this threshold is chosen by the investigator before the study begins. The probability of a Type I error is the threshold against which the p-value is judged: if the p-value falls below alpha, the result is deemed "statistically significant" and the null is rejected. The consequences of a Type I error in anaesthesia are the adoption of an ineffective or harmful intervention on the basis of a chance finding — for example, accepting a new perioperative drug that confers no real benefit while adding cost and side-effects. The more comparisons a study makes, the greater the cumulative chance of a false positive, which is the root of the multiple-testing problem addressed later [4].
Type II error
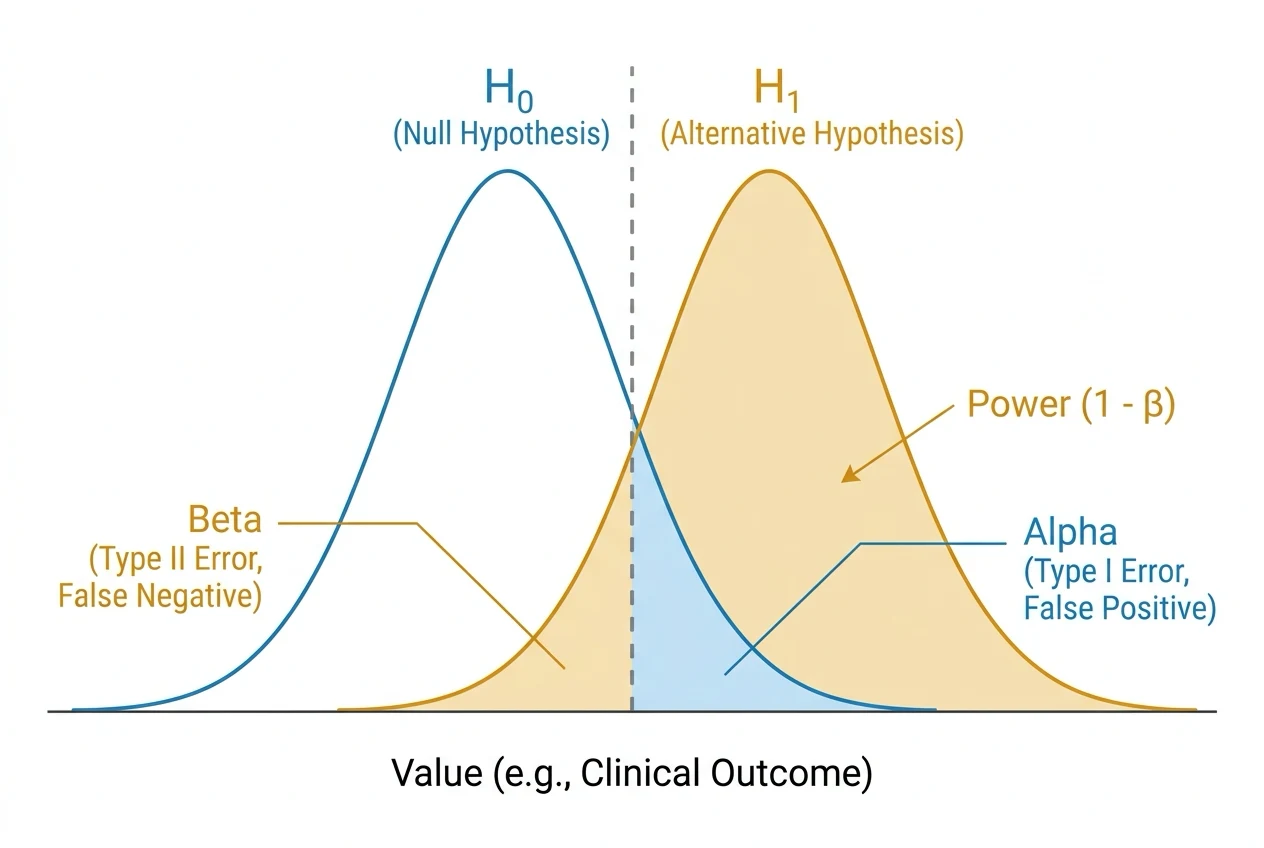
A Type II error (beta) is a false negative — failing to reject the null hypothesis when it is false, missing a real difference that genuinely exists. It is conventionally set at 0.20 (a 20 percent chance of a false negative). The two error types are a trade-off: for a fixed sample size, lowering alpha (a stricter significance threshold) raises beta, and vice versa. The only way to reduce both simultaneously is to increase the sample size. A Type II error in anaesthesia means discarding a genuinely effective intervention — for instance, abandoning an analgesic adjunct that truly reduces opioid consumption because a small trial failed to reach significance. The figure below shows both errors as overlapping distributions, and is the single most useful diagram for understanding the whole topic. [1]
Statistical power
Power is the probability that a study will correctly detect a true difference when one exists — formally, power equals 1 minus beta, so a beta of 0.20 gives a power of 0.80 (an 80 percent chance of detecting a true effect). Four factors determine power: [1]
- Sample size — the dominant lever; power rises as the sample grows.
- Effect size — a larger true difference is easier to detect.
- Variability — less spread in the data (smaller standard deviation) increases power.
- Alpha level — a more lenient threshold (for example 0.10 instead of 0.05) raises power but inflates the Type I error rate. [1]
A power of 0.80 means that if the same truly-effective intervention were studied in identical trials, four out of five would reach statistical significance and one would miss it by chance. An underpowered study is doubly wasteful: it consumes resources and patients yet produces a "negative" result that is really just a failure to detect — a false negative dressed up as evidence of no effect. The recent commentary on statistical power in the medical literature underlines how many published studies remain underpowered, and the risk-prediction models in perioperative neurology illustrate why adequate power matters when the outcome (neurological deterioration) is rare [4][5].
Sample size calculation
Sample size is calculated before a trial begins, and it depends on four inputs: [1]
- The expected effect size — the minimum clinically important difference the trial is designed to detect; a smaller expected effect demands a larger sample.
- Alpha — the tolerated false-positive rate (typically 0.05); a stricter alpha demands a larger sample.
- Beta (or power) — the tolerated false-negative rate (typically 0.20, power 0.80); a higher demanded power demands a larger sample.
- The variability of the outcome — a more variable outcome (larger standard deviation) demands a larger sample. [1]
The relationship is intuitive: large effects that vary little are easy to see and need small samples; small, noisy effects need large samples. An underpowered study cannot be "rescued" after the fact, and a trial that fails to reach significance because it was too small has not shown "no difference" — it has failed to exclude one. This is why the sample-size calculation, with its stated primary outcome and expected effect, is a required component of a trial protocol and a routine target in critical appraisal [4][8].
The p-value — interpretation and misuse
The p-value is the probability of obtaining the observed data, or data more extreme, if the null hypothesis were true. It is a conditional probability — the probability of the data given the null, not the probability of the null given the data. Three misuses dominate the literature and feature in every exam: [1]
- The p-value is not the probability that the null hypothesis is true. A p-value of 0.04 does not mean there is a 4 percent chance the null is correct.
- A p-value less than 0.05 does not mean the result is clinically important. Statistical significance reflects sample size as much as effect size; a trivial difference in a huge sample can yield a tiny p-value.
- A p-value greater than 0.05 does not mean there is no difference — it means the study failed to detect one, which may reflect insufficient power rather than absence of effect. [1]
The p-value should always be read alongside the effect size and its confidence interval, which together convey whether the difference is real, how large it is, and how precisely it has been estimated. The move in modern journals toward reporting confidence intervals and pre-registered primary outcomes is a direct response to the misuse of the p-value [4][8].
Confidence intervals
A confidence interval (CI) is a range of values within which the true population parameter lies with a specified probability, conventionally 95 percent. A 95 percent CI means that if the study were repeated many times, 95 percent of the resulting intervals would contain the true value. The CI conveys two pieces of information that a p-value alone cannot: [1]
- The effect size — the point estimate (the centre of the interval).
- The precision of the estimate — the width of the interval; a narrow CI means a precise estimate, a wide CI means an imprecise one (typically from a small sample). [1]
The CI also encodes statistical significance directly: for a ratio (odds ratio, relative risk, hazard ratio), if the 95 percent CI crosses 1.0 the result is not statistically significant at the 0.05 level, because 1.0 means no difference; for an absolute difference, if the CI crosses 0 the result is not significant. A trial reporting a relative risk of 0.85 with a 95 percent CI of 0.72 to 1.05 has a point estimate favouring the intervention but is not statistically significant because the interval includes 1.0. Confidence intervals are the preferred way to report results because they convey both significance and the plausible range of the effect, and they feature prominently in the forest plots of meta-analyses [2][8].
Effect sizes and clinical significance
The p-value tells you whether a difference exists; the effect size tells you how big it is. A study can be statistically significant yet clinically trivial, and anaesthetic decisions must be guided by clinical, not merely statistical, importance. Four effect-size measures recur: [1]
- Absolute risk reduction (ARR) — the difference in event rates between control and treatment groups.
- Number needed to treat (NNT) — equal to 1 divided by the ARR; the number of patients who must be treated for one to benefit. It is the most clinically intuitive single number — an NNT of 20 means treat 20 patients to prevent one event.
- Relative risk (RR) — the incidence in the exposed divided by the incidence in the unexposed; the measure of association from a cohort study or RCT.
- Odds ratio (OR) — the odds of the outcome in one group divided by the odds in the other; the measure from a case-control study and from logistic regression. [1]
A large relative risk reduction can mask a tiny absolute benefit when the baseline event rate is low, which is why the NNT is so useful for bedside decisions. The emergence-hypertension risk-factor study and the hip-arthroplasty cohort illustrate how the choice of effect-size measure shapes the clinical message a paper conveys [2][3].
Multiple testing and corrections
Every statistical comparison carries a 5 percent chance of a false positive at an alpha of 0.05, so the more comparisons a study makes, the greater the chance that at least one will be "significant" purely by chance. With 20 independent tests, the expected number of false positives is one. Two defences exist: [1]
- Pre-specify a single primary outcome. Declaring one primary comparison in advance keeps the overall false-positive rate at 5 percent; all other analyses are secondary and exploratory.
- Correct for multiple comparisons. The Bonferroni correction divides alpha by the number of tests (for 10 tests, the threshold becomes 0.005). It is simple and conservative — it reliably controls the false-positive rate but at the cost of power, making it harder to detect true effects. [1]
The trade-off is fundamental: corrections protect against false positives but increase false negatives. The cleanest solution is a pre-specified primary outcome supported by a handful of hypothesis-driven secondary analyses, rather than a fishing expedition across dozens of comparisons [4][8].
Parametric versus non-parametric tests
The choice of statistical test depends on whether the data meet the assumptions of a parametric test, the number of groups, and the type of data. Parametric tests assume an underlying distribution — typically the normal distribution — and compare means: [1]
- Student's t-test compares the means of two independent (or paired) groups.
- ANOVA (analysis of variance) compares the means of three or more groups. [1]
Non-parametric tests make no distributional assumption and compare ranks or medians, suiting skewed data, small samples, or ordinal outcomes: [1]
- Mann-Whitney U (Wilcoxon rank-sum) — the non-parametric equivalent of the independent t-test.
- Wilcoxon signed-rank — the equivalent of the paired t-test.
- Kruskal-Wallis — the non-parametric equivalent of one-way ANOVA. [1]
For categorical data (counts in categories), the chi-squared test compares observed and expected frequencies — for example, the number of patients with and without postoperative nausea in two antiemetic groups. Choosing a parametric test for markedly non-normal data inflates the false-positive rate; choosing a non-parametric test unnecessarily wastes power. The decision is guided by the distribution of the data, the sample size, and the level of measurement (nominal, ordinal, interval, ratio) [3][7].
Survival analysis and time-to-event outcomes
Many anaesthesia-relevant outcomes are time-to-event — time to recovery of consciousness, time to first postoperative analgesic request, time to recurrence, time to discharge. Survival analysis handles these, and it handles censored data: patients who are lost, withdraw, or reach the end of follow-up without the event. Three tools are central: [1]
- The Kaplan-Meier curve estimates the survival (or event-free) probability over time, shown as a step function that drops at each event and is flat during censorship.
- The log-rank test compares the survival curves of two or more groups, testing whether they differ significantly.
- The hazard ratio (HR) quantifies the relative risk of the event at any time point in one group versus the other; an HR of 0.7 means a 30 percent reduction in the instantaneous risk of the event, and like the odds ratio it is significant at the 0.05 level only if its 95 percent CI excludes 1.0. [1]
The retained-placenta outcomes study and the amyloid-beta memory study are examples of work in which time-to-event and risk-prediction framing shape the conclusions drawn from longitudinal data, and the same machinery applies to perioperative recovery endpoints [5][6][7].
Clinical
- Standard approach
- Evidence-based
Alternative
- Modified technique
- Risk-benefit
Red flags
[1]References
- [1]Albanese A, et al. A Novel Algorithm for Continuous Real-Time Cerebral Autoregulation Assessment Based on Mean Arterial Pressure and Cerebral Oxygen Saturation Anesth Analg, 2026.PMID 42363900
- [2]Jiao SS, et al. Risk factors for unanticipated hypertension during emergence from general anesthesia in elderly surgical patients: A retrospective cohort analysis Medicine (Baltimore), 2026.PMID 42363520
- [3]Ali U, et al. Outcomes of lateral and posterior approaches in hip arthroplasty: A cohort from low-middle-income country J Pak Med Assoc, 2026.PMID 42363370
- [4]Hanif L, et al. Comment on Avoidant Personality Traits and Avoidant Coping in Cognitive-Behavioral Therapy vs. Short-Term Psychodynamic Psychotherapy for Adult Depression Personal Ment Health, 2026.PMID 42363611
- [5]Chen Y, et al. Risk prediction models for early neurological deterioration after intravenous thrombolysis in acute ischemic stroke patients: a systematic review and meta-analysis BMC Neurol, 2026.PMID 42363152
- [6]Kawabe N, et al. Logical memory is associated with amyloid-β positivity in patients with early Alzheimer's disease eligible for lecanemab J Alzheimers Dis, 2026.PMID 42363806
- [7]Mukouyama F, et al. Association of Retained Placenta After Spontaneous Separation With Conversion to Hysterectomy in Cases of Cesarean Sections With Suspected Placenta Accreta Spectrum J Obstet Gynaecol Res, 2026.PMID 42363659
- [8]Tarrant A, et al. What counts as knowing? Reflections on evidence hierarchies in qualitative longitudinal and participatory research with young fathers Evid Policy, 2026.PMID 42362383