Anaes · Measurement & monitoring physics
Oxygen measurement
Also known as Pulse oximetry · Beer-Lambert law · Oxyhaemoglobin dissociation curve · Clark electrode · Paramagnetic oxygen analyser · Galvanic fuel cell
Oxygen measurement is the single most monitored quantity in anaesthesia — the pulse oximeter on the finger, the oxygen analyser in the breathing circuit, the arterial blood gas in the machine, and the tissue-oxygenation probes on the forehead all answer the same question from different angles: is enough oxygen reaching the patient's cells? The framework rests on six exam-critical ideas. First, the PULSE OXIMETER exploits the BEER-LAMBERT LAW — that the absorbance of light by a solution is proportional to the concentration of the absorbing species — at two wavelengths, red 660 nanometres and infrared 940 nanometres; oxyhaemoglobin absorbs more infrared and deoxyhaemoglobin absorbs more red, and the RATIO of the two absorbances yields the saturation. Because only the pulsatile component of the absorbance is used, the device isolates arterial blood from venous blood and tissue. Second, the SIGNAL is processed into an AC (pulsatile) component riding on a DC (baseline) component, and the calibration curve that converts the absorbance ratio into a saturation is empirical, built from studies in healthy volunteers. Third, the device has well-defined LIMITATIONS: carboxyhaemoglobin is read as oxyhaemoglobin so the reading is falsely high; methaemoglobin absorbs almost equally at both wavelengths and pulls the reading toward 85 per cent; dyes (methylene blue, indocyanine green) and nail polish lower the reading; poor perfusion, motion artefact, dark skin pigmentation and high ambient light all degrade accuracy. Fourth, the OXYHAEMOGLOBIN DISSOCIATION CURVE relates the arterial partial pressure of oxygen (PaO2) to the saturation (SaO2) in a sigmoid that is flat at the top (so saturation is a poor index of PaO2 in the normal range) and steep at the bottom; the P50 — the PaO2 at which haemoglobin is half saturated — is about 3.5 kPa (26.8 mmHg) at 37 degrees and pH 7.40, and shifts LEFT (increased affinity) with alkalosis, hypothermia, low 2,3-DPG, fetal haemoglobin and carbon monoxide, and RIGHT (reduced affinity, better unloading) with acidosis, hyperthermia and high 2,3-DPG. Fifth, the PARTIAL PRESSURE of oxygen is measured directly by electrochemical cells: the CLARK (polarographic) electrode, in which oxygen diffuses through a membrane and is reduced at a platinum cathode held at a polarising voltage, the resulting current being proportional to PO2, used in the blood-gas analyser and consuming oxygen; and the GALVANIC (fuel cell) sensor, self-generating with a gold cathode and lead anode, used in portable analysers and also consuming oxygen. Sixth, the CONCENTRATION of oxygen in a gas mixture is measured by the PARAMAGNETIC analyser — oxygen is one of the few paramagnetic gases (attracted into a magnetic field) while most other gases are diamagnetic, and the dumb-bell or dual-chamber sensor on the anaesthetic machine exploits this for the inspired-oxygen monitor with its low-concentration alarm. Beyond these, tissue oxygenation is assessed by near-infrared spectroscopy (NIRS) for the regional saturation, by the mixed venous oxygen saturation (SvO2) from the pulmonary artery catheter and the central venous saturation (ScvO2), and by lactate as a global surrogate. Built on the pulse-oximetry perioperative review (Moon 2026), the melanin-corrected tissue-oxygen-saturation work (Kubo 2026), the pulse-oximetry hypoxaemia-overestimation study (Atuar 2026), the age-dependent oxygenation and perfusion data (Afzal 2026), the SvO2-transfusion cardiac-ICU study (Okamoto 2026), the near-infrared cytochrome-c-oxidase monitoring work (Ward 2026), the Beer-Lambert diffusion-correction study (Shi 2026), and the tissue-oxygenation monitoring during hyperbaric-oxygen study (Kmiec 2026).
On this page & tools
Your progress
Saved locally on this device.
12 MCQs with explanations
Target exams
Red flags
Why this matters to the anaesthetist
Oxygen is the one substance a patient cannot store, and the anaesthetist is the only person in the theatre whose job is to ensure it reaches the cells. Every anaesthetic, every sedation, every transfer and every critical-care admission is built around the question of whether the patient is oxygenated — and answering it requires three distinct measurements running in parallel. The PULSE OXIMETER gives a continuous, non-invasive estimate of the arterial saturation. The OXYGEN ANALYSER in the breathing circuit confirms that the gas the lungs are receiving actually contains oxygen. The ARTERIAL BLOOD GAS gives the partial pressure of oxygen (PaO2), the gold standard against which the others are judged. Understanding how each works, where each fails, and how the saturation and the partial pressure relate through the oxyhaemoglobin dissociation curve is the difference between reacting to a number and understanding a patient [1][4].
Pulse oximetry principle (the Beer-Lambert law)
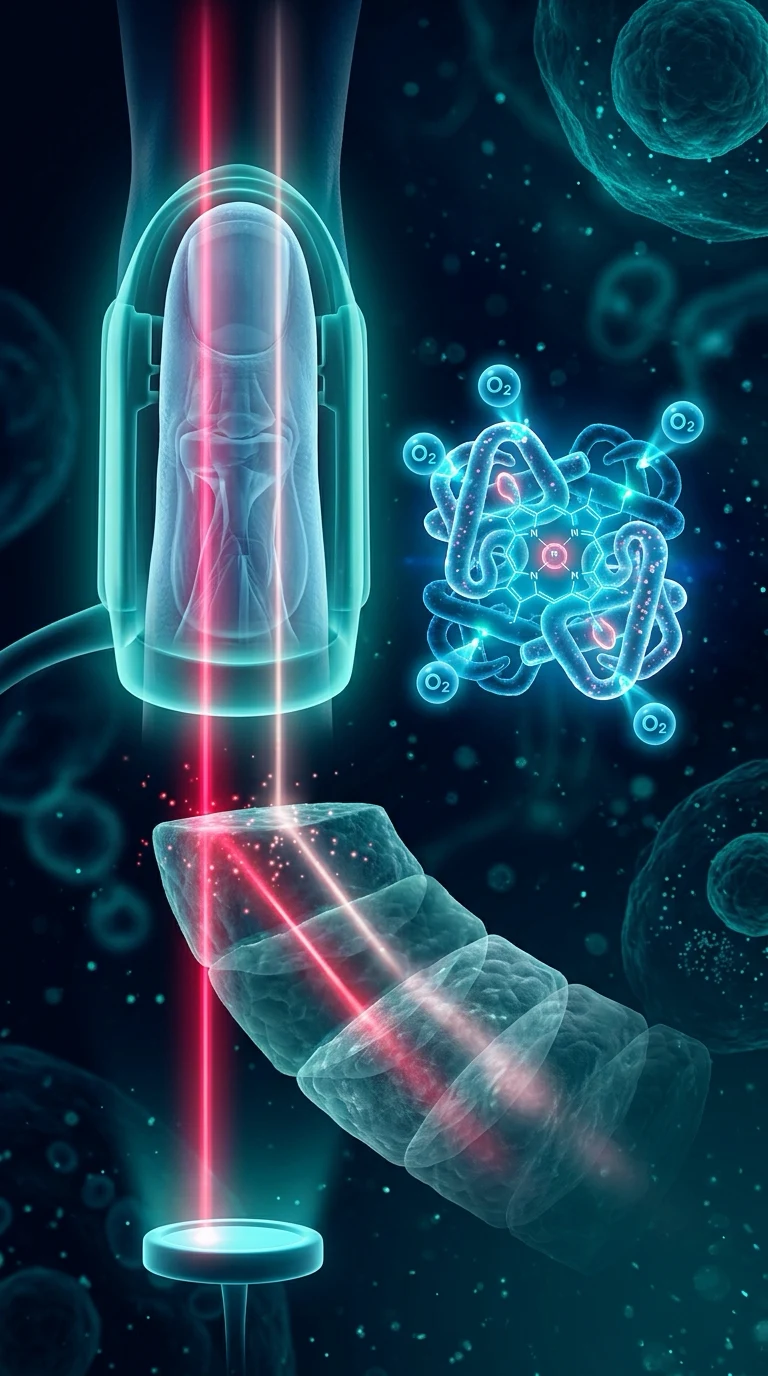
The pulse oximeter is a spectrophotometer applied to a fingertip or earlobe. Its physical basis is the Beer-Lambert law: the absorbance of light by a solution is proportional to the concentration of the absorbing species and the path length. Haemoglobin exists in the oxygenated and deoxygenated forms, and the two forms have different absorption spectra. The pulse oximeter therefore sends two wavelengths of light through the tissue — red at 660 nanometres and infrared at 940 nanometres — chosen because they straddle the isosbestic point where the two species absorb equally [1][7].
At these two wavelengths the absorptions diverge: oxyhaemoglobin absorbs more infrared (940 nm) and less red, while deoxyhaemoglobin absorbs more red (660 nm) and less infrared. A photodetector on the far side of the tissue measures the light transmitted at each wavelength, and the device computes the ratio of the absorbances at the two wavelengths. That ratio is then converted into a saturation by an empirical calibration curve built into the device — there is no closed-form equation linking ratio to saturation, the curve was derived experimentally by calibrating against arterial blood samples in healthy, well-perfused volunteers [7].
The crucial refinement is the use of the pulsatile signal. The absorbance the photodetector sees comes from everything in the path — skin, muscle, venous blood and arterial blood. Only the arterial blood pulsates. By subtracting the steady (DC) baseline from the peak-and-trough (AC) pulsatile component, the device isolates the absorbance due to the arterial column alone. This is why the pulse oximeter reads arterial saturation rather than a tissue average, and why it depends on there being a pulse at all [1].
The pulse oximeter waveform and signal processing
The raw optical signal is processed in three steps. First, the photodetector output at each wavelength is separated into an AC component — the small pulsatile fluctuation riding on top of the signal, typically only 1 to 5 per cent of the total, which represents the light absorbed by the pulsing arterial blood — and a DC component, the large steady baseline representing the light absorbed by the tissue, venous blood and non-pulsatile arterial blood. Second, the ratio of the AC to the DC at each wavelength is computed, which cancels out the tissue and venous contributions. Third, the ratio of the two corrected absorbances (red over infrared) is fed into the calibration curve — an empirical look-up table stored in the device — to yield the saturation [1].
The plethysmographic waveform that the pulse oximeter displays is the AC envelope itself, and it carries useful information beyond the number: a good, regular, plethysmographic trace confirms a reliable signal, a falling amplitude may indicate reduced stroke volume or vasoconstriction, and its variability with respiration can flag hypovolaemia. The processing requires several pulses (typically 5 to 20 seconds) to average, which is why the displayed value lags behind a true acute desaturation by a few seconds [1][4].
Limitations and sources of error
The pulse oximeter is accurate within about 2 per cent for saturations above 90 per cent, but its accuracy falls off on the steep part of the curve, and it is confounded by anything that distorts the absorbance ratio or destroys the pulsatile signal [3].
- Dyshaemoglobins. The two-wavelength device assumes only oxy- and deoxyhaemoglobin are present. Carboxyhaemoglobin absorbs almost no light at 660 nm and is read as oxyhaemoglobin, so the reading is falsely high (a patient with carbon-monoxide poisoning can read 99 per cent). Methaemoglobin absorbs almost equally at the two wavelengths, fixing the absorbance ratio near unity, which the calibration curve maps to about 85 per cent — the reading is pulled toward 85 per cent regardless of the true saturation. A co-oximeter (multiple wavelengths) is required to resolve these [3].
- Dyes and pigments. Methylene blue, indocyanine green and indigo carmine absorb strongly in the red band and cause a dramatic, transient fall in the reading (a classic exam vignette). Nail polish — especially black, blue and green — lowers the reading; remove it or orient the probe side-to-side [2].
- Poor perfusion. Because the device depends on the pulsatile component, a low cardiac output, vasoconstriction, hypothermia, non-invasive blood-pressure cuff inflation on the same arm, or a non-pulsatile ventricular-assist device all reduce or abolish the AC signal and the reading becomes unreliable or absent.
- Motion artefact and high ambient light. Movement creates a spurious AC signal; bright theatre lighting and infrared heaters add to the detected light. Modern devices use signal-averaging and synchronisation algorithms to suppress these, but they remain a cause of false alarms.
- Skin pigmentation. Darker skin melanin absorbs across the visible and near-infrared bands and has been shown to bias the reading — most notably by overestimating saturation in the hypoxaemic range, a significant equity concern that newer melanin-corrected algorithms address [2][3].
- Anaemia. Severe anaemia reduces the total absorbance and degrades the signal-to-noise ratio, but the reading itself, when a pulse is present, remains broadly reliable until the haemoglobin is very low.
The oxyhaemoglobin dissociation curve
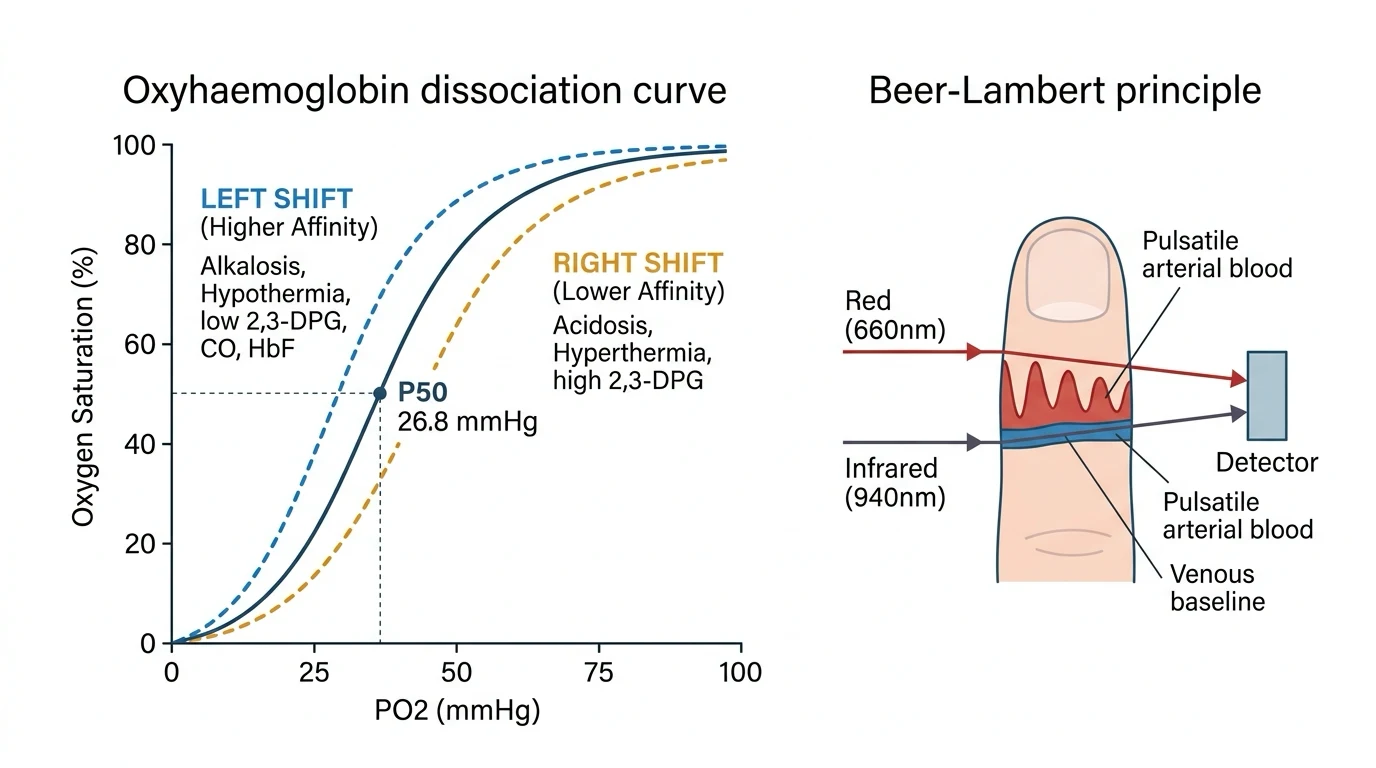
The oxyhaemoglobin dissociation curve relates the partial pressure of oxygen (PaO2) on the x-axis to the saturation (SaO2) on the y-axis. It is sigmoid in shape, and this shape is the key to its physiology. The curve is flat above a PaO2 of about 8 to 9 kPa (60 to 70 mmHg) — the saturation remains between 90 and 100 per cent across a wide range of PaO2 — and steep below this point, so that small further falls in PaO2 cause large falls in saturation. The flat top is a reservoir that protects saturation against moderate lung disease; the steep part is why a patient who is already at the shoulder desaturates rapidly when pushed a little further [4].
A direct consequence for monitoring: saturation is a poor index of PaO2 in the normal range. A saturation of 95 per cent corresponds to a PaO2 of about 10.6 kPa (80 mmHg), and a saturation still at 90 per cent corresponds to a PaO2 of only about 8 kPa (60 mmHg). The pulse oximeter therefore detects hypoxaemia late — by the time it falls, the PaO2 is already low. [1]
The P50 is the PaO2 at which haemoglobin is 50 per cent saturated. At standard conditions (37 degrees C, pH 7.40, normal 2,3-DPG) it is about 3.5 kPa (26.8 mmHg). The P50 is a measure of haemoglobin's affinity for oxygen, and it is moved by anything that alters that affinity: [1]
- LEFT shift (increased affinity, reduced unloading, lower P50): alkalosis, hypothermia, low 2,3-DPG (stored blood, after massive transfusion), fetal haemoglobin, carbon monoxide. The curve moves left and oxygen binds more tightly, which helps loading in the lung but impairs release to the tissues.
- RIGHT shift (reduced affinity, increased unloading, higher P50): acidosis, hyperthermia, high 2,3-DPG (chronic hypoxia, high altitude, anaemia), exercise. The curve moves right, oxygen binds more loosely, and unloading to the tissues improves. The Bohr effect — the shift caused by carbon dioxide and hydrogen ions — is the classical right-shift mechanism in actively metabolising tissue [4].
Paramagnetic oxygen analyser
Oxygen is unusual among respiratory and anaesthetic gases in being paramagnetic — its molecules have two unpaired electrons and are attracted into a magnetic field. Nitrogen, nitrous oxide, carbon dioxide and the volatile agents are diamagnetic (weakly repelled). This large difference is exploited in the paramagnetic oxygen analyser, the standard inspired-oxygen sensor on the modern anaesthetic machine. [1]
The classical design is the dumb-bell type: a pair of nitrogen-filled glass spheres on a delicate suspension is placed between the poles of a powerful magnet. The spheres are weakly diamagnetic and tend to be pushed out of the field, but the surrounding gas, if it contains oxygen, is itself pulled into the field and the force on the spheres changes in proportion to the oxygen concentration. The rotation of the dumb-bell is detected optically and a feedback coil restores it to the null position; the current in the coil is the measure of the oxygen concentration. Modern variants use a pair of chambers with a pressure transducer that senses the differential magnetic attraction of the sample versus a reference gas. The paramagnetic analyser is fast, accurate, does not consume oxygen and is not drift-prone, which is why it has displaced the older fuel-cell sensors for the breathing-circuit monitor [1].
The Clark (polarographic) electrode
The Clark electrode measures the partial pressure of oxygen, not its concentration. It is the sensor inside the blood-gas analyser that reports PaO2, and (in miniaturised form) the transcutaneous and intravascular PO2 probes. [1]
Its construction is an electrochemical cell. A platinum cathode and a silver/silver-chloride anode are immersed in an electrolyte solution and separated from the sample by an oxygen-permeable membrane (polypropylene or Teflon). A small polarising voltage (about 0.6 volts) is applied across the electrodes. Oxygen diffuses through the membrane and is reduced at the platinum cathode (oxygen plus water plus electrons giving hydroxide); a corresponding oxidation occurs at the anode. The resulting current is directly proportional to the partial pressure of oxygen at the membrane. Because each molecule of oxygen that reaches the cathode is consumed, the Clark electrode consumes oxygen — the sample must be flowing or the membrane must be small enough that the consumption does not deplete the local PO2 [1].
The Clark electrode needs a stable temperature (it is held at 37 degrees), it drifts with time as the membrane and electrolyte age, and it is sensitive to the membrane's permeability. It is the gold standard for PaO2 in the laboratory but is too delicate for prolonged inline use in the breathing circuit. [1]
The galvanic (fuel cell) sensor
The galvanic cell, or fuel cell, is an electrochemical oxygen sensor that is self-generating — it produces its own voltage and needs no external power supply. It uses a gold cathode and a lead anode in an electrolyte, separated from the gas by a membrane. Oxygen diffuses through the membrane, is reduced at the gold cathode, and the spontaneous reaction drives a current proportional to the PO2. [1]
Because it is self-powered, compact and inexpensive, the galvanic cell is the sensor of choice for portable oxygen analysers — the handheld device used to check a fixed-performance mask, a ventilator's inspired oxygen, or an oxygen concentrator output. Like the Clark electrode it consumes oxygen and so requires a flow of gas across the membrane; it also has a finite life because the lead anode is consumed, after which the cell must be replaced. It is slower to respond than the paramagnetic sensor and is less suited to the fast, continuous monitoring of the breathing circuit [1].
Arterial blood gas analysis
The arterial blood gas analyser is the reference standard for oxygenation. From a single arterial sample it reports the PaO2 (measured by the Clark electrode), the PaCO2 (measured by a Severinghaus electrode), and the pH, and from these it derives bicarbonate, base excess and the saturation — the calculated SaO2 from the measured pH, PaCO2 and PaO2 by assuming normal haemoglobin and no dyshaemoglobin. [1]
The important subtlety is the difference between the calculated and the measured saturation. If the patient has a dyshaemoglobin — carboxyhaemoglobin from smoke inhalation, methaemoglobin from dapsone or prilocaine — the calculated SaO2 will be wrong because the calculator assumes only oxy- and deoxyhaemoglobin are present. The co-oximeter, which measures absorbance at many more wavelengths (typically 128 or more across the visible band), directly quantifies oxy-, deoxy-, carboxy- and methaemoglobin and reports the measured SaO2. A discrepancy between the calculated and the co-oximetric SaO2 is the clue to an unsuspected dyshaemoglobin, and a pulse-oximeter reading that is higher than the true arterial saturation is the bedside signature of the same problem [3].
The normal PaO2 falls with age and with altitude; a useful rule of thumb for a healthy young adult breathing air is a PaO2 of about 13 kPa (100 mmHg), declining by roughly 0.3 kPa per decade. A PaO2 below 8 kPa (60 mmHg) on air defines type 1 respiratory failure [4].
Tissue oxygenation monitoring
Arterial saturation and PaO2 describe only the loading of oxygen onto haemoglobin; they do not confirm that oxygen is reaching and being used by the tissues. Several monitors address the delivery-to-cell leg of the chain [5][8].
- Near-infrared spectroscopy (NIRS) uses the relative transparency of tissue to near-infrared light (the optical window) to measure a regional tissue oxygen saturation — the cerebral rSO2 from a forehead sensor, or the somatic rSO2 from a flank or muscle sensor. It is continuous, non-invasive and does not depend on pulsatile flow, which makes it valuable in low-flow states, paediatric and cardiac surgery, and on bypass. Its limitation is that it reads a mixed arterial, capillary and venous weighted average and is affected by skin pigmentation unless melanin-corrected [2][6]. Newer techniques interrogate cytochrome-c-oxidase, the terminal enzyme of the electron transport chain, to gauge the redox state of the cell itself — a more direct index of cellular oxygenation [6].
- Mixed venous oxygen saturation (SvO2) is measured from a sample drawn from the distal port of a pulmonary artery catheter and reflects the oxygen left after the whole body has extracted what it needs; a normal SvO2 is about 65 to 75 per cent. A low SvO2 indicates that the body is extracting more because delivery is failing, and it falls before the lactate rises. In the cardiac ICU, the SvO2 response to transfusion is used to judge whether a transfusion has improved global oxygen balance [5].
- Central venous oxygen saturation (ScvO2) from a central line in the superior vena cava is a more accessible surrogate for SvO2, used in early-goal-directed therapy of sepsis (target above 70 per cent).
- Lactate is a global, downstream surrogate: a rising lactate signals that anaerobic metabolism has begun, but it lags the onset of tissue hypoxia and is also raised by adrenergic drive and impaired clearance.
- Hyperbaric and special environments. Direct tissue-oxygen monitoring becomes especially important when the delivery is being deliberately manipulated, as in hyperbaric oxygen therapy, where tissue probes track the rise in dissolved oxygen [8].
The anaesthetic machine oxygen analyser
The inspired-oxygen monitor sits in the inspiratory limb (or the Y-piece) of the breathing circuit and continuously displays the oxygen concentration the patient is receiving. On modern machines it is a paramagnetic sensor. The display is the final line of defence against a hypoxic gas mixture — against a emptying oxygen cylinder, a pipeline cross-connection, a flow-meter leak or a vaporiser mistake. [1]
Two alarm settings are mandatory. The low-oxygen alarm is set to alert if the inspired oxygen falls below the set threshold (commonly 30 per cent in theatre, higher in critical care). The hypoxic guard is a mechanical linkage on the flow-meter bank that prevents the nitrous-oxide flow from exceeding the oxygen flow and producing a hypoxic mixture, and it is paired with the oxygen-failure warning device (the Bosun whistle or its electronic equivalent) that alarms and interrupts nitrous oxide when the oxygen supply pressure falls. Together these make the oxygen analyser, the hypoxic guard and the oxygen-failure device the three layers of protection against a hypoxic mixture [1].
Applied: interpreting SpO2 versus PaO2, the oxygenation indices
Reading a pulse oximeter and a blood gas together requires the dissociation curve. Because the curve is flat above 8 to 9 kPa, a normal saturation does not exclude a fall in PaO2 — a patient whose PaO2 has dropped from 13 to 9 kPa still reads 97 per cent. Conversely, on the steep part of the curve a small fall in PaO2 causes a large fall in saturation, which is why the patient who desaturates is already significantly hypoxic. The gradient between the two is widened by any right shift (acidosis, fever) and narrowed by any left shift (alkalosis, hypothermia, stored blood) — a patient transfused with old bank blood unloads oxygen poorly at the tissues despite a healthy saturation [4].
The oxygenation indices quantify the lung's efficiency at transferring oxygen. The PaO2 to FiO2 ratio (the P/F ratio) is the simplest: a normal value on room air is above about 53 kPa (400 mmHg); a value below 40 kPa (300 mmHg) defines acute lung injury or mild ARDS, and below 27 kPa (200 mmHg) defines moderate-to-severe ARDS. The oxygenation index (the mean airway pressure times FiO2 times 100, divided by PaO2) folds in the ventilating pressure and is used in paediatric and ECMO practice to judge severity and to guide escalation. These indices appear in the APACHE and SOFA severity scores, where the PaO2 divided by FiO2 is the respiratory component, linking bedside oxygen measurement to prognostic scoring [3][5].
Clinical
- Standard approach
- Evidence-based
Alternative
- Modified technique
- Risk-benefit
Red flags
[1]References
- [1]Moon K, et al. Pulse Oximetry-A Perioperative Perspective Diagnostics (Basel), 2026.PMID 42351472
- [2]Kubo R, et al. Melanin-corrected absolute tissue oxygen saturation estimation via hybrid transmittance-reflectance spectroscopy Biomed Opt Express, 2026.PMID 42311288
- [3]Atuar B, et al. Reduce hypoxemia overestimation in pulse oximetry based on iso-pathlength: a Monte Carlo study Opt Lett, 2026.PMID 42066129
- [4]Afzal B, et al. Investigating Age-Dependent Oxygenation and Blood Perfusion in a Mouse Model of Peripheral Artery Disease (PAD) Using Multispectral Optoacoustic Tomography (MSOT), Laser Speckle Contrast Imaging (LSCI) and Histology Diagnostics (Basel), 2026.PMID 42351441
- [5]Okamoto K, et al. SvO₂ response to red blood cell transfusion in cardiovascular surgical icu patients: a retrospective observational study Crit Care, 2026.PMID 42332804
- [6]Ward R, et al. Recent near-infrared approaches to cytochrome-c-oxidase monitoring: a systematic review of instruments and algorithms Phys Med Biol, 2026.PMID 42013903
- [7]Shi Y, et al. Diffusion correction of Beer-Lambert law in visible light optical coherence tomography for retinal vessels Med Biol Eng Comput, 2026.PMID 42008039
- [8]Kmiec MM, et al. Real-Time Monitoring of Tissue Oxygenation During Hyperbaric Oxygen Exposure Using In Vivo EPR Oximetry Magn Reson Med, 2026.PMID 42324649