Anaes · Applied cardiovascular & respiratory physiology
Cardiac cycle & pressure-volume loops
Also known as Cardiac cycle · Wiggers diagram · Pressure-volume loop · Frank-Starling mechanism · Preload afterload contractility · Stroke volume
The cardiac cycle is the repeating sequence of pressure and volume changes that ejects blood from the heart, and the left-ventricular pressure-volume loop is its clearest graphical summary. The framework rests on five exam-critical ideas: the cycle has the phases atrial systole, isovolumetric contraction, ejection, isovolumetric relaxation, and filling, with the mitral and aortic valves opening and closing in a fixed order (the first and second heart sounds); stroke volume is end-diastolic volume minus end-systolic volume, and ejection fraction is stroke volume over end-diastolic volume; stroke volume is set by three determinants — preload, afterload and contractility; preload operates through the Frank-Starling mechanism, in which greater diastolic stretch (longer sarcomeres, and the elastic titin filament) yields stronger systole; and the pressure-volume loop makes all three determinants visible at once — preload shifts the end-diastolic point along the EDPVR, afterload tilts the loop, and contractility steepens the ESPVR. Built on the titin-and-heart-function review (Granzier 2025), the length-dependent-activation review (Cazorla 2011), the cardiac electromechanical-modelling review (Trayanova 2011), the working-heart preparation review (Usai 2025), the positive-airway-pressure haemodynamics review (Di Cristo 2025), and the heart-lung-interactions review (Hamahata 2023).
On this page & tools
Your progress
Saved locally on this device.
8 MCQs with explanations
Target exams
Red flags
Why this matters to the anaesthetist
If you can draw a PV loop and move it correctly for preload/afterload/contractility/diastolic failure, you can reason any haemodynamic stem. Primary classic; Final applied constantly.[5]
One-liner: Loop width = SV; ESPVR slope = contractility; EDPVR = diastolic stiffness; preload moves end-diastolic point; afterload raises ESP and ESV. [1]
Phases of the cardiac cycle (Wiggers linkage)
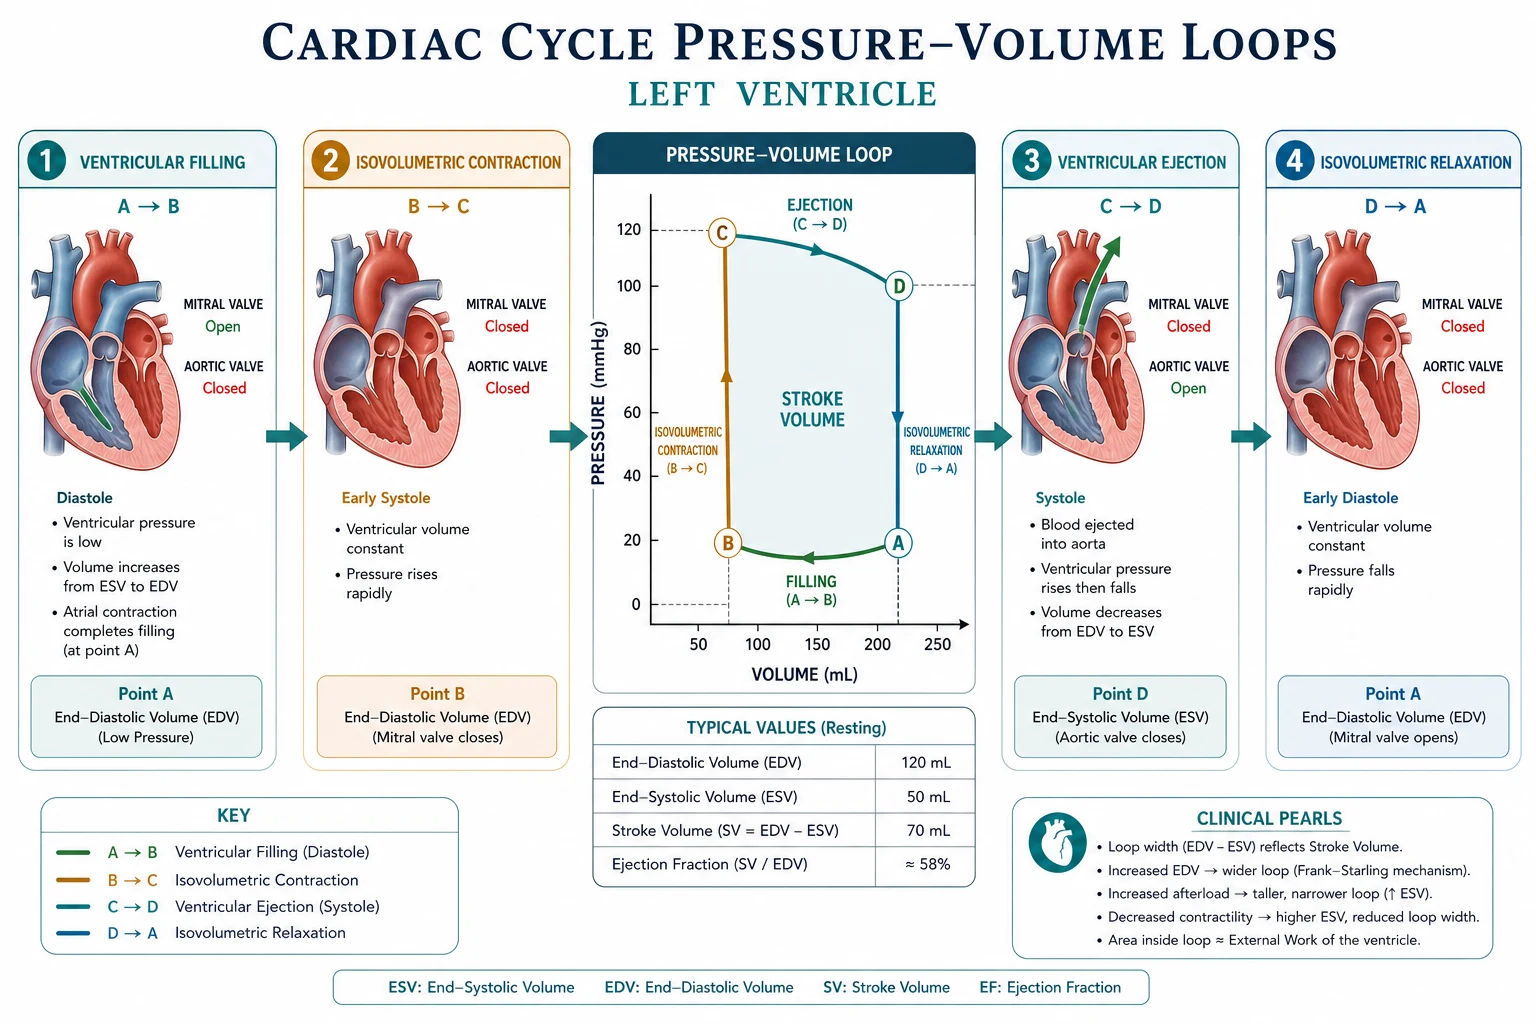
- Atrial systole — atrial kick (~15–30% of LV filling; more important if stiff LV).
- Isovolumetric contraction — MV closed, AV closed; pressure rises, volume fixed.
- Ejection — AV opens when LV > aortic pressure; rapid then reduced ejection.
- Isovolumetric relaxation — AV closes (S2); volume fixed; pressure falls.
- Filling — MV opens; rapid filling, diastasis, then atrial systole. [1]
Heart sounds: S1 = AV valve closure; S2 = semilunar closure. S3/S4 pathophys optional exam spice. [1]
Pressures (left vs right)
| Site | Approx normal |
|---|---|
| LV peak / aortic | 120 mmHg |
| Aortic diastolic | 80 mmHg |
| LVEDP | ~6–12 mmHg |
| LA mean | ~6–12 mmHg |
| RV peak | ~25 mmHg |
| PA mean | ~15 mmHg |
| RA mean | ~0–7 mmHg |
SV, EF, CO
- SV = EDV − ESV (~70 mL)
- EF = SV/EDV (~55–70%)
- CO = SV × HR; CI = CO/BSA [1]
Normal EF does not exclude diastolic heart failure (HFpEF) — stiff ventricle, high filling pressures, small cavity. [1]
Drawing the PV loop

Axes: volume x, pressure y. [1]
Corners: [1]
- Bottom-right: end-diastole (EDV, EDP)
- Top-right: aortic valve opening
- Top-left: end-systole (ESV) — lies on ESPVR
- Bottom-left: mitral valve opening [1]
ESPVR: line through end-systolic points; steeper = higher contractility. [1]
EDPVR: passive filling curve; steeper = less compliant. [1]
Moving the loop
| Change | Loop geometry | SV |
|---|---|---|
| ↑Preload (volume) | EDV rightward on EDPVR | ↑ if on Starling ascent |
| ↑Afterload | Higher ejection pressure, ↑ESV | ↓ especially if weak LV |
| ↑Contractility | Steeper ESPVR, ↓ESV | ↑ |
| Diastolic dysfunction | Steep EDPVR, high EDP for volume | SV may be small |
| Mitral regurg (qualitative) | Volume rises in systole to LA — loop shape distorts | Forward SV ↓ |
Frank–Starling
Increased sarcomere length (within limits) → increased stroke work via length-dependent Ca sensitivity (+ titin). Flattened in failure — fluids raise pressure more than SV. [1]
Ventricular interdependence & pericardium
RV overload shifts septum, impedes LV filling (PE, high PEEP). Tamponade equalises diastolic pressures — PV physiology constrained by external pressure. [1]
Anaesthetic interventions on the loop
- Propofol/volatiles: ↓contractility, vasodilation (↓preload/afterload).
- PEEP: ↓RV preload, ±↑RV afterload; LV may see complex effects.
- Phenylephrine: ↑afterload, reflex bradycardia; SV may fall if poor LV.
- Noradrenaline: pressor + some inotropy.
- Dobutamine: steeper ESPVR, some vasodilation.
- Aortic cross-clamp: sudden afterload spike. [1]
Numbers board
- SV ~70 mL; EF ~60%; CO ~5–6 L/min
- LV peak 120; RV 25 mmHg
- ESPVR = contractility index concept [1]
↑Preload
- EDV right
- Wider loop if ascent
- EDP rises on EDPVR
- Fluid responsive
↑Afterload
- Taller loop
- ESV increases
- SV falls if weak
- Clamp/vasopressor
Graph scripts
Draw baseline loop; overlay ↑preload, ↑afterload, ↑inotropy in three colours. [1]
Link Wiggers pressure-time to loop segments. [1]
Extended viva dialogue
Examiner: Point to stroke volume on the loop. [1]
Candidate: Horizontal width between EDV and ESV — the isovolumetric vertical limbs share the same volumes at their top/bottom pairs. [1]
Examiner: How does phenylephrine change the loop in a failing LV? [1]
Candidate: Afterload rises, end-systolic volume increases along a depressed ESPVR, stroke volume falls, and blood pressure may rise even as forward flow worsens — which is why pure α-agonists need caution in severe systolic failure. [1]
Clinical synthesis: Draw it, move three determinants, and you can narrate the entire haemodynamic plan. [1]
Pressure–volume area and efficiency (brief)
Stroke work ≈ loop area. PVA correlates with MVO2 teaching — larger loops cost more oxygen. Why afterload and volume overload stress the ischaemic heart. [1]
Right ventricular loop differences
Lower pressures, more sensitive to afterload (PEEP, PE, hypoxia HPV), crescentic geometry, interdependence with LV via septum and pericardium. [1]
Worked SAQ
SAQ: Draw and explain the LV pressure–volume loop (10 marks)
Axes volume (x) and pressure (y). End-diastole at bottom right; isovolumetric contraction vertical rise; ejection across the top to end-systole top left; isovolumetric relaxation vertical fall; filling along the bottom. Width is stroke volume. ESPVR slope indexes contractility; EDPVR indexes diastolic stiffness. Increased preload moves the end-diastolic point right; increased afterload raises end-systolic volume; inotropes steepen ESPVR and reduce ESV. [1]
Wiggers diagram correlation table
| Time event | ECG | Valves | Loop segment |
|---|---|---|---|
| Atrial kick | After P | MV open | End of filling |
| IVC start | After QRS onset | Both closed | Vertical up |
| AV open | Mid systole | AV open | Top leftward |
| AV close / S2 | End T | AV closed | Start vertical down |
| MV open | Early diastole | MV open | Bottom rightward |
Elastance concepts
Time-varying elastance E(t) = P(t)/V(t); maximal elastance Emax ≈ ESPVR slope. This is the formal contractility language behind the simple “steeper ESPVR” teaching. [1]
Ventriculo-arterial coupling
EA (arterial elastance) ≈ ESP/SV; optimal coupling when EA/Ees near 1. Vasopressors raise EA; failure reduces Ees — mismatch explains why pure afterload increase can cut efficiency. [1]
Extended viva add-on
Examiner: Show what aortic cross-clamping does to the LV loop. [1]
Candidate: Sudden afterload rise increases end-systolic pressure and end-systolic volume, narrows stroke volume if the ventricle cannot compensate, and raises myocardial wall stress and oxygen demand — dangerous if coronary supply is limited. [1]
Primary exam expansion — dense examiner pack
Construct the LV pressure–volume loop from scratch
Axes: volume (mL) x-axis, pressure (mmHg) y-axis. Four sides: [1]
- Bottom: diastolic filling — mitral valve open, volume rises, pressure low (compliance curve). Ends at end-diastolic volume (EDV) / end-diastolic pressure (EDP).
- Right vertical: isovolumetric contraction — mitral closes (S1), both valves closed, pressure rises at constant volume to aortic diastolic pressure.
- Top: ejection — aortic valve opens, volume falls to end-systolic volume (ESV), pressure follows afterload; ends at end-systolic pressure–volume point.
- Left vertical: isovolumetric relaxation — aortic closes (S2), pressure falls at constant volume until mitral opens. [1]
Stroke volume SV = EDV − ESV. Ejection fraction EF = SV/EDV. Stroke work ≈ area inside loop (approximate). [1]
ESPVR and EDPVR — the skeleton lines
End-systolic pressure–volume relationship (ESPVR): roughly linear; slope Ees (end-systolic elastance) indexes contractility — steeper = stronger. Intercept V0. Inotropes rotate ESPVR steeper; myocardial depression flattens it. [1]
End-diastolic pressure–volume relationship (EDPVR): exponential-ish compliance curve. Stiffer ventricle (diastolic dysfunction, ischaemia, tamponade external constraint) shifts EDPVR up/left — higher EDP for given EDV. [1]
Preload, afterload, contractility on the loop (draw three variants)
| Change | Loop change | SV |
|---|---|---|
| ↑ Preload (fluid) | EDV rightward; SV rises if on ascending Starling limb | ↑ |
| ↑ Afterload (vasoconstriction, clamp) | Higher ESP; ESV rises; loop taller/narrower | ↓ if uncompensated |
| ↑ Contractility | Steeper ESPVR; ESV falls | ↑ |
| ↓ Compliance | Higher EDP at same EDV; filling limited | ↓ potential |
Wiggers correlation (must be fluent)
| Event | ECG | Heart sounds | Valves | Loop |
|---|---|---|---|---|
| Atrial systole | After P | — | MV open | End-diastolic bump |
| IVC onset | After QRS | S1 (MV close) | All closed | Right vertical up |
| Ejection | ST segment period | — | AV open | Top limb leftward |
| IVR onset | Near end T | S2 (AV close) | All closed | Left vertical down |
| Filling | After IVR | S3 pathological | MV open | Bottom rightward |
Ventriculo-arterial coupling
Arterial elastance EA ≈ ESP/SV. Optimal coupling when EA/Ees near unity for efficient transfer. Pure vasoconstriction raises EA; heart failure lowers Ees — mismatch reduces SV efficiency. Vasodilators can improve coupling in failing hearts; pure dilators in hypovolaemia collapse ESP and coronary perfusion pressure. [1]
RV loop differences
RV is lower pressure, more sensitive to afterload (PVR), shares pericardium with LV (interdependence). PE, hypoxia HPV, high PEEP raise RV afterload — RV dilates, septal shift, LV filling falls — obstructive shock physiology. [1]
Clinical scenarios to draw
Aortic stenosis: high LV pressures, narrow SV if severe, slow upstroke clinically. Aortic regurgitation: large EDV, wide SV, low diastolic aortic pressure. Mitral regurgitation: V wave, reduced forward SV versus total SV. Tamponade: equalised diastolic pressures, small cavity volumes, exaggerated interdependence. IABP: reduces afterload in systole, augments diastolic pressure — loop and coronary perfusion teaching. [1]
Numbers teaching
LV EDV ~120 mL, ESV ~50 mL, SV ~70 mL, EF ~60% at rest (order of magnitude). MAP driving coronary diastolic flow; CPP ≈ ADP − LVEDP. [1]
SAQ: draw and label LV PV loop and show increased afterload (8 marks)
Axes and four limbs (3). Label EDV, ESV, SV, ESPVR (2). Increased afterload variant with explanation (2). One clinical example (aortic cross-clamp) (1). [1]
Viva
Q: What is the area of the loop? A: External stroke work (pressure–volume work) approximately. Q: How does venodilation affect the loop? A: Reduced venous return → lower EDV → smaller loop left-shifted. Q: Why is EF not pure contractility? A: EF depends on preload, afterload and contractility — isolated EF change is ambiguous. [1]
High-yield viva battery and numbers lock-in
Must-draw annotations
Label: EDV, ESV, SV, ESP, EDP, ESPVR slope (Ees), EDPVR, isovolumetric contraction and relaxation limbs, mitral and aortic valve opening/closing corners. State SV = EDV − ESV and EF = SV/EDV. [1]
Afterload versus preload manoeuvres (practise both)
Fluid bolus: loop widens rightward if recruitable. Venodilation: opposite. Phenylephrine: taller loop, ESV may rise, SV may fall. Inotrope: steeper ESPVR, smaller ESV. Combined shock: small loop, low pressures. [1]
Laplace link to wall tension
Wall tension ∝ P × r / wall thickness. Dilated hearts face higher tension for given pressure → higher MVO2. Why afterload reduction and remodelling matter. Ties PV loop area (stroke work) to oxygen demand. [1]
Full viva dialogue (additional)
Examiner: Show diastolic dysfunction on a PV loop. [1]
Candidate: The end-diastolic pressure–volume relationship shifts upward and leftward so that any given end-diastolic volume generates a higher end-diastolic pressure. The loop may be smaller if filling is limited, and pulmonary venous pressure rises clinically. [1]
Examiner: What happens to the loop in acute mitral regurgitation? [1]
Candidate: There is ejection into the LA during systole so the isovolumetric phases are disrupted, total SV may look large while forward SV falls, and V waves appear on LA pressure traces — the simple rectangle is deformed. [1]
Exam traps
- Calling EF a pure contractility index.
- Forgetting isovolumetric periods when both valves closed.
- Mixing RV and LV pressure scales.
- Ignoring pericardial constraint in tamponade loops. [1]
Examiner synthesis paragraph
If you can draw the LV pressure–volume loop in thirty seconds, label EDV, ESV, SV and the ESPVR slope, then deform it for raised afterload, reduced contractility and diastolic stiffness, you will pass most Primary PV-loop stations. Speak stroke work as loop area, couple the ventricles to arterial elastance, and connect diastolic coronary filling to the same pressures that set wall tension and myocardial oxygen demand. Clinical stems — aortic cross-clamp, tamponade, vasodilatory shock, aortic stenosis — are only loop edits plus a one-line management implication. [1]
References
- [1]Granzier HL. Discovery of Titin and Its Role in Heart Function and Disease Circ Res, 2025.PMID 39745989
- [2]Cazorla O, et al. Regional variation in myofilament length-dependent activation Pflugers Arch, 2011.PMID 21336586
- [3]Trayanova NA, et al. Cardiac electromechanical models: from cell to organ Front Physiol, 2011.PMID 21886622
- [4]Usai DS, et al. The isolated, perfused working heart preparation of the mouse-Advantages and pitfalls Acta Physiol (Oxf), 2025.PMID 40078031
- [5]Di Cristo A, et al. Hemodynamic Effects of Positive Airway Pressure: A Cardiologist's Overview J Cardiovasc Dev Dis, 2025.PMID 40137095
- [6]Hamahata N. Heart-Lung Interactions Semin Respir Crit Care Med, 2023.PMID 37541314