Anaes · Applied cardiovascular & respiratory physiology
Cardiac output & its determinants
Also known as Cardiac output · Cardiac index · Fick principle · Venous return · Mean systemic filling pressure · Guyton curves
Cardiac output — about 5 litres per minute at rest — is the product of heart rate and stroke volume, but in the steady state it is set equally by the venous return the circulation delivers to the heart. The framework rests on five exam-critical ideas: cardiac output equals heart rate times stroke volume, and the cardiac index normalises it to body surface area; the Fick principle measures cardiac output from oxygen consumption and the arteriovenous oxygen difference; heart rate is the autonomic lever on cardiac output, but tachycardia beyond an optimum cuts diastolic filling and lowers stroke volume; stroke volume is governed by preload, afterload and contractility (see the cardiac-cycle topic); and, in Guyton's framework, cardiac output equals venous return in the steady state, and the operating point is the intersection of the cardiac function curve and the venous return curve, set by the mean systemic filling pressure. Built on the venous-return and mean-systemic-filling-pressure review (Persichini 2022), the determinants-of-systemic-blood-flow review (Joyce 2020), the venous-return physics review (Brengelmann 2019), and three cardiac-output-measurement papers comparing thermodilution and the Fick method (Flick 2026 BJA, Rivera-Robles 2025, Abualsaud 2024).
On this page & tools
Your progress
Saved locally on this device.
Target exams
Red flags
Why this matters to the anaesthetist
Induction hypotension, PEEP-related collapse of blood pressure, neuraxial sympathectomy, septic high-output failure, and the decision between fluid and vasopressor are all cardiac-output problems. Primary candidates must write CO = HR × SV, state the Fick equation, define preload/afterload/contractility, explain mean systemic filling pressure and Guyton curves, and measure CO methods with limitations. [1]
Cardiac output and cardiac index
CO = HR × SV. Resting adult CO ≈ 5–6 L/min. Cardiac index (CI) = CO / BSA, normal ≈ 2.5–4.0 L·min−1·m−2. Indexing allows comparison across body size. CO rises with exercise (up to 4–6×), pregnancy (~30–50%), sepsis (often high), and anaemia (compensatory). [1]
The Fick principle
CO = V̇O2 / (CaO2 − CvO2) [1]
Direct Fick uses measured oxygen consumption and arterial and mixed venous contents (PAC). Estimated Fick substitutes assumed V̇O2 from nomograms — systematically error-prone, often overestimating CO versus thermodilution. Reverse Fick computes V̇O2 from measured CO and contents. Fick fails with intracardiac shunts if sampling sites are wrong [5][6].
Heart rate
Autonomic balance at the SA node sets HR. Increasing HR raises CO until diastolic filling time is so short that SV falls — classically problematic above ~150–170/min depending on the ventricle and rhythm (loss of atrial kick in AF multiplies the problem). Severe bradycardia limits CO despite large SV. Coronary perfusion depends on diastolic time — tachycardia hurts supply while raising demand. [1]
Stroke volume: preload, afterload, contractility
Preload: wall stress at end-diastole ≈ related to end-diastolic volume/pressure. Frank–Starling: within limits, greater sarcomere stretch → greater stroke work. Surrogates: CVP (poor), PADP, PCWP, LVEDV by echo, IVC dynamics, PPV/SVV (conditional). [1]
Afterload: wall stress during ejection ≈ (P × r) / (2h) (Laplace). SVR is a common systemic surrogate: SVR = (MAP − CVP) × 80 / CO (dyn·s·cm−5). High afterload reduces SV especially in failing hearts; vasopressors can therefore cut CO if they crush a struggling LV, while they may raise CO if they restore coronary perfusion pressure and venous return. [1]
Contractility: intrinsic inotropic state; ESPVR slope on PV loops. Catecholamines increase; most anaesthetics decrease; ischaemia decreases. [1]
Venous return and mean systemic filling pressure
In steady state CO = venous return (VR). [1]
VR = (Pms − Pra) / Rv [1]
- Pms (mean systemic filling pressure): ~7–10 mmHg — elastic recoil pressure of the stressed vascular volume if the heart stops.
- Pra: right atrial pressure — back-pressure opposing return.
- Rv: resistance to venous return. [1]
Raise Pms (volume, venoconstriction) or lower Pra (within limits) or lower Rv → raise VR. Anaesthesia venodilates (↓Pms), PEEP raises Pra, haemorrhage ↓ stressed volume — all cut VR and CO [1][3].
Stressed vs unstressed volume: only stressed volume generates Pms. Sympathetic venoconstriction recruits unstressed volume into stressed volume without external fluid. [1]
Guyton cardiac function and venous return curves
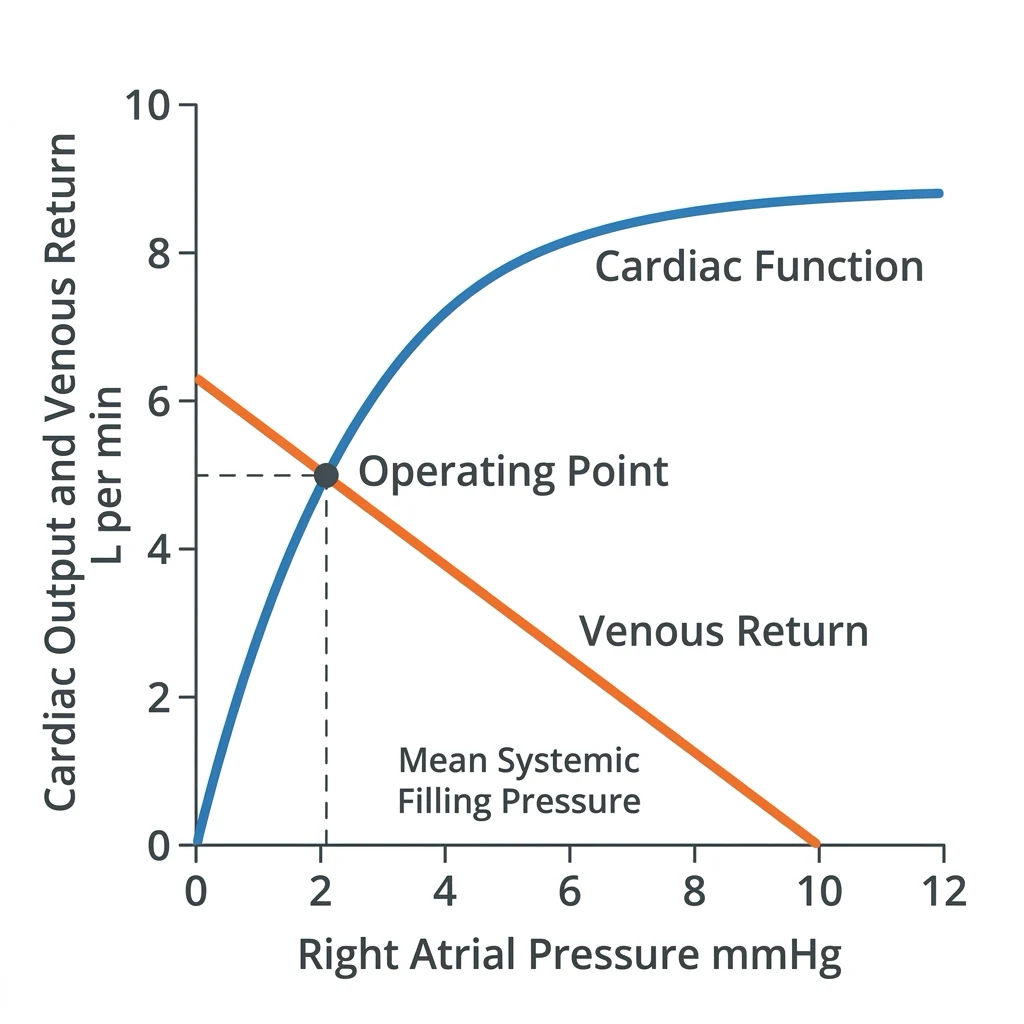
X-axis: right atrial pressure. Y-axis: flow (CO or VR). [1]
- Cardiac function curve: rises with Pra (Frank–Starling) then plateaus; depressed by poor contractility; raised by inotropes.
- Venous return curve: maximum when Pra is very low; zero VR when Pra = Pms; slope related to −1/Rv. [1]
Intersection = operating point. Fluids shift VR curve (↑Pms). Vasopressors may ↑Pms via venoconstriction and change cardiac curve via arterial pressure/coronary perfusion. PEEP shifts and rotates curves unfavourably for VR. This single diagram is the highest-yield haemodynamic picture in the Primary. [1]
Distribution of cardiac output
Approximate resting shares: brain ~15%, heart ~5%, kidneys ~20%, liver/splanchnic ~25%, muscle ~20%, skin/other remainder — not proportional to mass. Autoregulation defends vital organ flow across a MAP range; skin and muscle are more passive. In shock, redistribution is sympathetic and humoral. [1]
Measuring cardiac output
| Method | Principle | Strengths | Weaknesses |
|---|---|---|---|
| PAC thermodilution | Cold bolus temp-time curve | Clinical reference tradition | Invasive; TR, shunts error |
| Continuous PAC | Thermal filament | Trends | Drift, same PAC risks |
| Pulse contour | Arterial waveform model | Beat-to-beat | Needs calibration; arrhythmia, aortic disease |
| Oesophageal Doppler | Descending aortic flow | Less invasive | Assumptions on flow fraction |
| Echo LVOT VTI | VTI × CSA × HR | Structural data too | User skill; intermittent |
| Fick | V̇O2 / a−v O2 | Physiologic gold if direct | Hard; estimated Fick biased |
| Bioimpedance/reactance | Thoracic electrical | Noninvasive | Variable accuracy |
Trend and clinical context beat fetishising a single number [4][5][6].
Anaesthetic relevance — moving the curves
- Induction: venodilatation ↓Pms; loss of sympathetic tone; often relative hypovolaemia unmasked; positive pressure ↑Pra.
- Neuraxial: sympathetic block → venodilation + arterial dilation; high block → bradycardia (T1–T4).
- PEEP/auto-PEEP: ↑Pra, possibly ↑Rv of pulmonary circuit, RV afterload up — CO falls, especially if hypovolaemic.
- Inotropes vs vasopressors: match to the failed determinant (contractility vs vascular tone vs volume).
- Sepsis: high CO, low SVR; extraction defects; high CO ≠ adequate cells. [1]
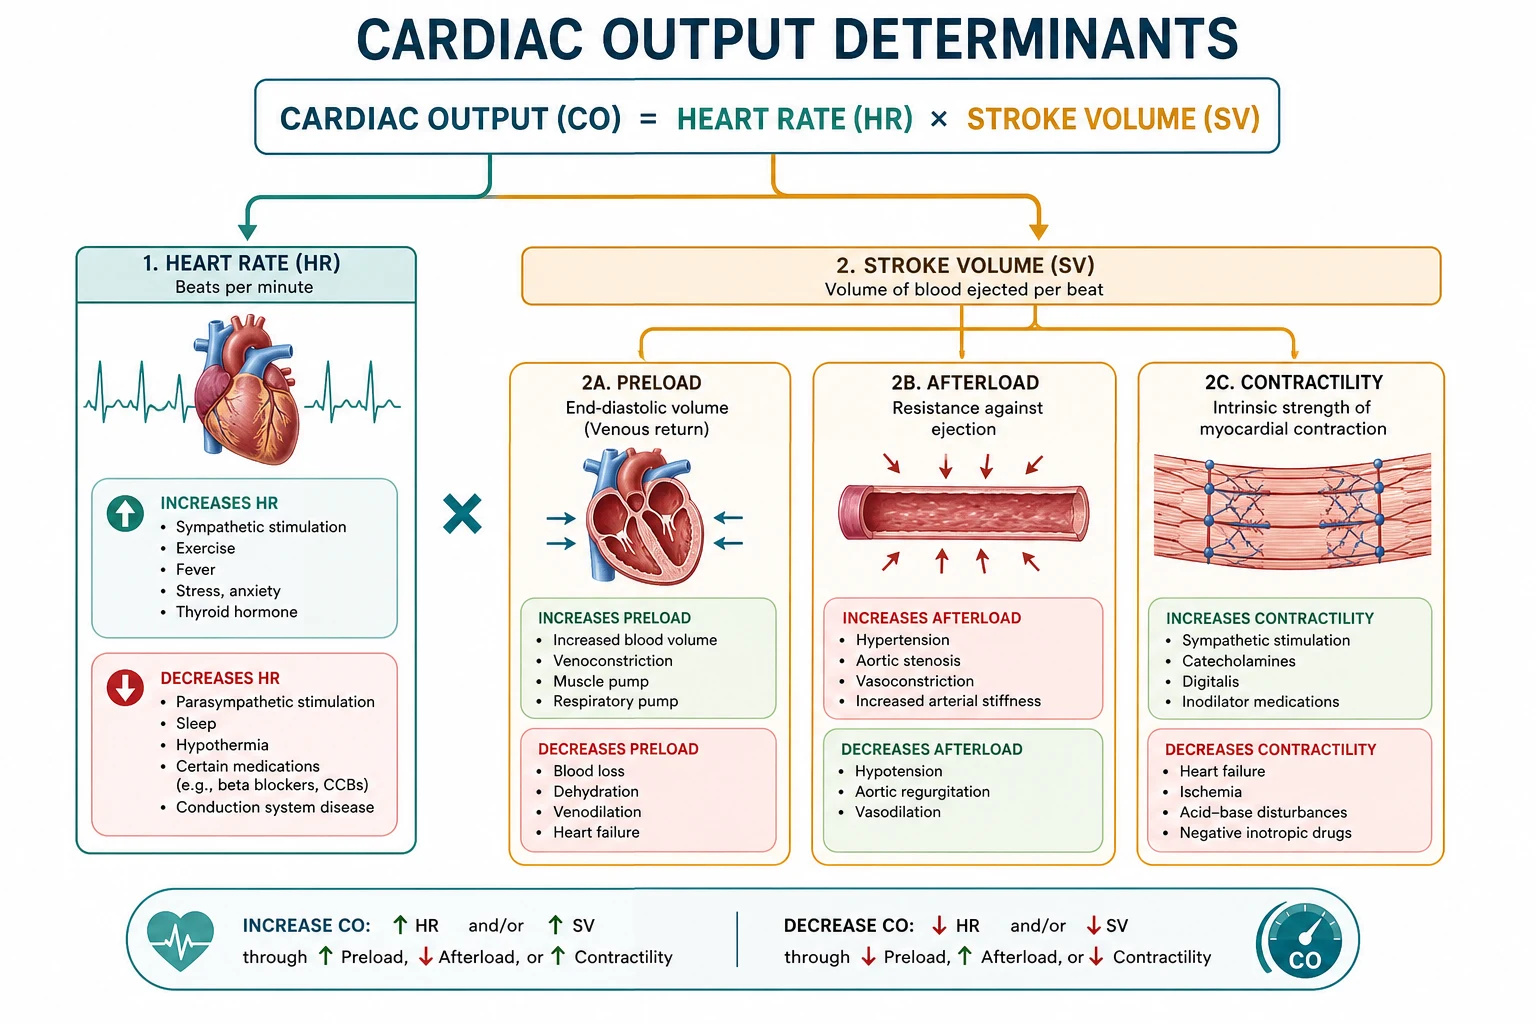
Heart-side problem
- Low contractility
- Extreme HR
- Valve disease
- Shift cardiac curve down
Return-side problem
- Low Pms (dilatation, bleed)
- High Pra (PEEP, tamponade)
- High Rv
- Shift VR curve down
Worked Fick example
V̇O2 250 mL/min, CaO2 20 mL/dL, CvO2 15 mL/dL → a−v diff 5 mL/dL = 50 mL/L → CO = 250/50 = 5 L/min. [1]
PV loop link
Stroke volume is loop width; preload is EDV; afterload relates to arterial elastance and ESP; contractility is ESPVR slope. Anaesthetics shrink loops; vasopressors rotate arterial elastance. [1]
Viva traps
- CO equals VR in steady state — not optional philosophy.
- Estimated Fick over-reads often.
- Tachycardia can lower CO.
- SVR formula units: remember ×80 for Wood units to dynes.
- Pms is not CVP; CVP is Pra, the back-pressure. [1]
SAQ: Guyton analysis of induction hypotension
"At induction venodilating anaesthetic agents reduce mean systemic filling pressure, shifting the venous return curve downward. Positive-pressure ventilation raises right atrial pressure, reducing the gradient for venous return. The cardiac function curve may also be depressed by negative inotropy. Their intersection — cardiac output — falls, and blood pressure falls with it. Treatment restores mean systemic filling pressure with fluid or venoconstricting vasopressors, reduces excessive intrathoracic pressure, and supports contractility if needed." [1]
Dynamic preload indices conditions
PPV and SVV predict fluid responsiveness under controlled ventilation without spontaneous effort, in sinus rhythm, with closed chest, and with adequate tidal volumes historically ≥8 mL/kg (lower TV reduces predictive power). They fail in ARDS low-TV ventilation, open chest, arrhythmia, and spontaneous breathing — state limitations. [1]
Ventricular interdependence
RV and LV share septum and pericardium. RV failure with high PVR (hypoxia, PE, high PEEP) dilates RV, underfills LV, and drops systemic CO. Treating "LV failure" with pure systemic vasoconstriction may worsen RV. Pulmonary vasodilators, optimised PEEP, and noradrenaline for coronary perfusion are RV-aware strategies. [1]
Oxygen delivery coupling
DO2 = CO × CaO2 × 10. Raising CO or Hb or SaO2 all raise DO2. Critical DO2 concept: below a threshold VO2 falls with DO2. Goal-directed therapy debates which targets matter, but the equation structure is non-negotiable physiology. [1]
Primary exam expansion
Frank–Starling detailed statement
"Within physiological limits, the energy of contraction is a function of the length of the muscle fibre before contraction." Sarcomere length optimises actin–myosin overlap and calcium sensitivity. Beyond the optimum, overdistension fails to increase SV and increases wall stress and oxygen demand. AV valves and pericardium constrain the clinical curve. [1]
Afterload mismatch
A weak LV ejects poorly against high SVR. Reducing afterload (nitroprusside carefully, IABP, vasodilators) can raise SV more than MAP falls, improving CO. Conversely, a vasodilated septic patient may need restored afterload (noradrenaline) so that coronary perfusion pressure supports the heart. [1]
Mean systemic filling pressure measurement concepts
Pms can be estimated by inspiratory hold manoeuvres plotting VR surrogates vs Pra and extrapolating to zero flow, or by brief ventricular fibrillation in lab settings. Clinically we infer Pms changes: fluid raises it; venodilatation lowers it. [1]
Pregnancy and exercise CO
Pregnancy: increased blood volume (↑Pms), reduced SVR, increased HR → high CO. Exercise: muscle pump and sympathetics raise VR and Pms; HR and contractility rise; CO multiplies. Both are physiological high-output states. [1]
Thermodilution error sources
Tricuspid regurgitation recirculates cold injectate; shunts mis-time curves; low CO exaggerates variability; injectate volume/temperature errors; respiratory cycle variation — average multiple injections. Know why a number might be wrong. [1]
Haemorrhage class and CO
Early compensated haemorrhage: CO maintained by HR and venoconstriction recruiting unstressed volume. Decompensated: Pms falls, CO falls, vasoconstriction critical. Anaesthesia removes compensation — "unmasking" hypovolaemia at induction after prep blood loss. [1]
PEEP and RV afterload
High PEEP increases West zone 1/2 conditions and RV afterload while also raising Pra. The RV may dilate and fail, dropping LV preload via interdependence. Optimal PEEP balances recruitment (better LV preload via better lung and less HPV strain) against overdistension. [1]
Extended viva dialogue
Examiner: What determines cardiac output? [1]
Candidate: Cardiac output is heart rate times stroke volume. Stroke volume depends on preload, afterload and contractility. In the steady state cardiac output equals venous return, which is the pressure gradient from mean systemic filling pressure to right atrial pressure divided by the resistance to venous return. [1]
Examiner: Draw Guyton curves. [1]
Candidate: On axes of right atrial pressure and flow, the cardiac function curve rises then plateaus. The venous return curve falls as right atrial pressure rises and crosses zero at mean systemic filling pressure. Their intersection is the operating cardiac output. Fluids raise Pms and shift venous return; inotropes raise the cardiac curve; PEEP raises right atrial pressure and cuts venous return. [1]
Examiner: State Fick and its pitfalls. [1]
Candidate: CO equals oxygen consumption divided by the arterial-minus-mixed-venous oxygen content difference. Direct Fick is the physiological gold standard if measurements are accurate. Estimated Fick using assumed oxygen consumption often overestimates cardiac output compared with thermodilution and should not be trusted in isolation. [1]
Examiner: How does anaesthesia reduce cardiac output? [1]
Candidate: Venodilatation reduces mean systemic filling pressure. Myocardial depression reduces the cardiac function curve. Positive-pressure ventilation raises right atrial pressure. Loss of sympathetic tone removes venoconstriction that had maintained stressed volume. The intersection falls — output falls — blood pressure falls unless compensated. [1]
Clinical synthesis: Ask whether the problem is heart, venous return, rate, or distribution before reaching for the next drug. [1]
Worked SAQ model answers
SAQ: Discuss the determinants of cardiac output including venous return (10 marks)
Cardiac output is the product of heart rate and stroke volume and equals venous return in the steady state. Heart rate is set by autonomic balance at the sinoatrial node; extreme tachycardia shortens diastole enough to reduce stroke volume and may lower output. [1]
Stroke volume depends on preload, afterload and contractility. Preload relates to end-diastolic fibre length and the Frank–Starling mechanism. Afterload is the wall stress during ejection, often indexed by systemic vascular resistance for the left ventricle. Contractility is the intrinsic inotropic state, represented by the end-systolic pressure–volume relationship. [1]
Venous return equals (mean systemic filling pressure minus right atrial pressure) divided by resistance to venous return. Mean systemic filling pressure, about 7 to 10 mmHg, is the upstream elastic recoil pressure of the stressed vascular volume. Anaesthetic venodilatation and haemorrhage lower it; fluid and venoconstriction raise it. Positive-pressure ventilation raises right atrial pressure and reduces the gradient for return. [1]
Guyton's graphical analysis plots cardiac function and venous return against right atrial pressure; their intersection is operating cardiac output. Clinical interventions move these curves. Measurement methods include thermodilution, pulse contour, echocardiography and Fick; each has error, and trends with clinical context outperform single readings. [1]
SAQ: Explain induction hypotension using Guyton physiology (5 marks)
Induction agents reduce sympathetic tone and venodilate, lowering mean systemic filling pressure. Positive-pressure breaths raise right atrial pressure. The venous return curve falls and the gradient narrows; the cardiac function curve may also be depressed. Output falls and blood pressure falls. Treatment restores venous return with fluid or vasopressors that restore stressed volume and supports the heart if contractility is impaired. [1]
Clinical scenario walkthroughs
Scenario 1 — Massive PE in PACU
A patient becomes hypotensive, tachycardic and hypoxaemic with a falling EtCO2. Physiology: acute rise in RV afterload, RV dilation, underfilling of the LV via interdependence, fall in CO, and increased alveolar dead space. MAP falls because CO falls despite high SVR. Treatment physiology: oxygen, RV-aware support (avoid pure high-dose systemic vasodilators), noradrenaline for coronary perfusion pressure, thrombolysis/embolectomy as indicated — not large fluid loads into a failing RV without care. [1]
Scenario 2 — High PEEP in ARDS
Raising PEEP recruits lung (good for oxygenation) but may raise Pra and RV afterload (bad for VR and RV). If BP falls when PEEP rises, the operating point has moved unfavourably on Guyton curves. Optimise volume status, reduce overdistension, and reassess. [1]
Scenario 3 — Sepsis
Low SVR, often high CO, low Pms from venodilation, impaired extraction. MAP low mainly from SVR; CO may still be inadequate relative to demand. Noradrenaline restores venous and arterial tone (Pms and SVR); fluid if still fluid-responsive; inotropy if myocardial depression present. High CO alone never proves adequate cellular oxygen use. [1]
Scenario 4 — Tamponade
Elevated and equalised diastolic pressures, low SV, tachycardia-dependent CO. Venous return is obstructed at the heart level — the cardiac function curve is compressed. Anaesthetic venodilation and positive pressure can arrest output; maintain preload and catecholamines until drainage. [1]
Red flags
- Failing CO is often a venous-return problem, not only a heart problem.
- Extreme tachycardia shortens filling — rate control may raise output.
- Pms drives VR; anaesthesia and sepsis lower it; fluid and venoconstriction raise it.
- Estimated Fick can mislead versus thermodilution.
- High CO in sepsis does not guarantee adequate utilisation. [1]
References
- [1]Persichini R, et al. Venous return and mean systemic filling pressure: physiology and clinical applications Crit Care, 2022.PMID 35610620
- [2]Joyce W. What determines systemic blood flow in vertebrates? J Exp Biol, 2020.PMID 32079682
- [3]Brengelmann GL. Venous return and the physical connection between distribution of segmental pressures and volumes Am J Physiol Heart Circ Physiol, 2019.PMID 31518160
- [4]Flick M, et al. Agreement of minimally invasive pulse wave analysis with pulmonary artery and transpulmonary thermodilution cardiac output measurements in perioperative and intensive care medicine: a systematic review and meta-analysis Br J Anaesth, 2026.PMID 42230211
- [5]Rivera-Robles J, et al. Post lung-transplant predictive value of thermodilution vs estimated Fick cardiac output measurement JHLT Open, 2025.PMID 40144726
- [6]Abualsaud R, et al. Time to Calm the Fick Down? A Systematic Review and Meta-Analysis of Thermodilution Compared to Direct Fick in Tricuspid Regurgitation CJC Open, 2024.PMID 39525819