Anaes · Applied cardiovascular & respiratory physiology
Oxygen transport & the dissociation curve
Also known as Oxyhaemoglobin dissociation curve · P50 · Bohr effect · Haldane effect · 2,3-DPG · Oxygen content
Oxygen is carried almost entirely bound to haemoglobin, and the oxyhaemoglobin dissociation curve governs both how it loads in the lung and how it unloads in the tissues. The framework rests on five exam-critical ideas: arterial oxygen content is the sum of haemoglobin-bound oxygen (about 1.34 mL per gram of haemoglobin times the saturation) plus the small dissolved fraction (0.003 times PaO2), so haemoglobin concentration dominates oxygen content; the dissociation curve is sigmoid, with a flat plateau above a PaO2 of about 60 to 70 mmHg (which protects saturation as PaO2 falls) and a steep lower portion (which aids tissue unloading); the P50 (the PaO2 at 50 percent saturation, about 27 mmHg) is the index of haemoglobin-oxygen affinity; the curve shifts RIGHT with raised hydrogen ion, CO2, temperature and 2,3-DPG (easier tissue unloading, the Bohr effect) and LEFT with the opposite, fetal haemoglobin, carbon monoxide and methaemoglobin (tighter binding, harder unloading); and carbon dioxide is carried as bicarbonate (about 70 percent), carbamino compounds (about 20 percent) and dissolved (about 10 percent), with oxygenation aiding CO2 unloading in the lung (the Haldane effect). Built on the P50-outcomes study (Karakurt 2026), the bisphosphoglycerate-mutase structure study (2,3-DPG, Martinez-Rodriguez 2026), the high-altitude oxygen-affinity study (Woyke 2025), the haemodialysis oxygen-affinity study (Sharma 2025), the carbon-monoxide-poisoning blood-gas study (Ke 2026), and the high-affinity Hb Rothschild report (Nuzhnaya 2025).
On this page & tools
Your progress
Saved locally on this device.
8 MCQs with explanations
Target exams
Red flags
Why this matters to the anaesthetist
Oxygen delivery is the product of cardiac output and arterial oxygen content. Content is almost entirely haemoglobin-bound; the dissociation curve determines how saturation relates to partial pressure and how readily tissues extract oxygen. Every decision about transfusion thresholds, acid–base, temperature, carbon monoxide, stored blood, and interpretation of SpO2 versus PaO2 rests on this physiology. Primary candidates must write the oxygen content equation, draw and shift the ODC, define P50, and explain Bohr and Haldane effects with numerical anchors. [1]
How oxygen is carried
Oxygen is carried in blood in two forms: [1]
- Dissolved in plasma — proportional to PaO2 by Henry's law: dissolved O2 (mL/dL) ≈ 0.003 × PaO2 (mmHg). At PaO2 100 mmHg, dissolved ≈ 0.3 mL/dL — trivial when Hb is normal, useful under hyperbaric oxygen.
- Bound to haemoglobin — each gram of Hb binds up to 1.34 mL O2 when fully saturated (Hüfner's constant; some texts use 1.36 or 1.39 depending on measurement assumptions). Practically: [1]
CaO2 (mL/dL) = (1.34 × [Hb g/dL] × SaO2) + (0.003 × PaO2) [1]
Worked example: Hb 15 g/dL, SaO2 1.0, PaO2 100 → bound 20.1 + dissolved 0.3 = 20.4 mL/dL (often quoted ~20 mL/100 mL). [1]
Oxygen delivery: DO2 = CO × CaO2 (with unit conversion: if CO in L/min and CaO2 in mL/dL, DO2 mL/min = CO × CaO2 × 10). Resting DO2 ~1000 mL/min; VO2 ~250 mL/min; extraction ratio ~25%; mixed venous saturation ~75%. [1]
Anaemia lowers content without lowering PaO2 or SpO2 — the patient can have SpO2 100% and still deliver poorly. Hypoxaemia lowers saturation. Low cardiac output lowers DO2 even if content is normal. Shock physiology is the product of all three. [1]
The oxyhaemoglobin dissociation curve
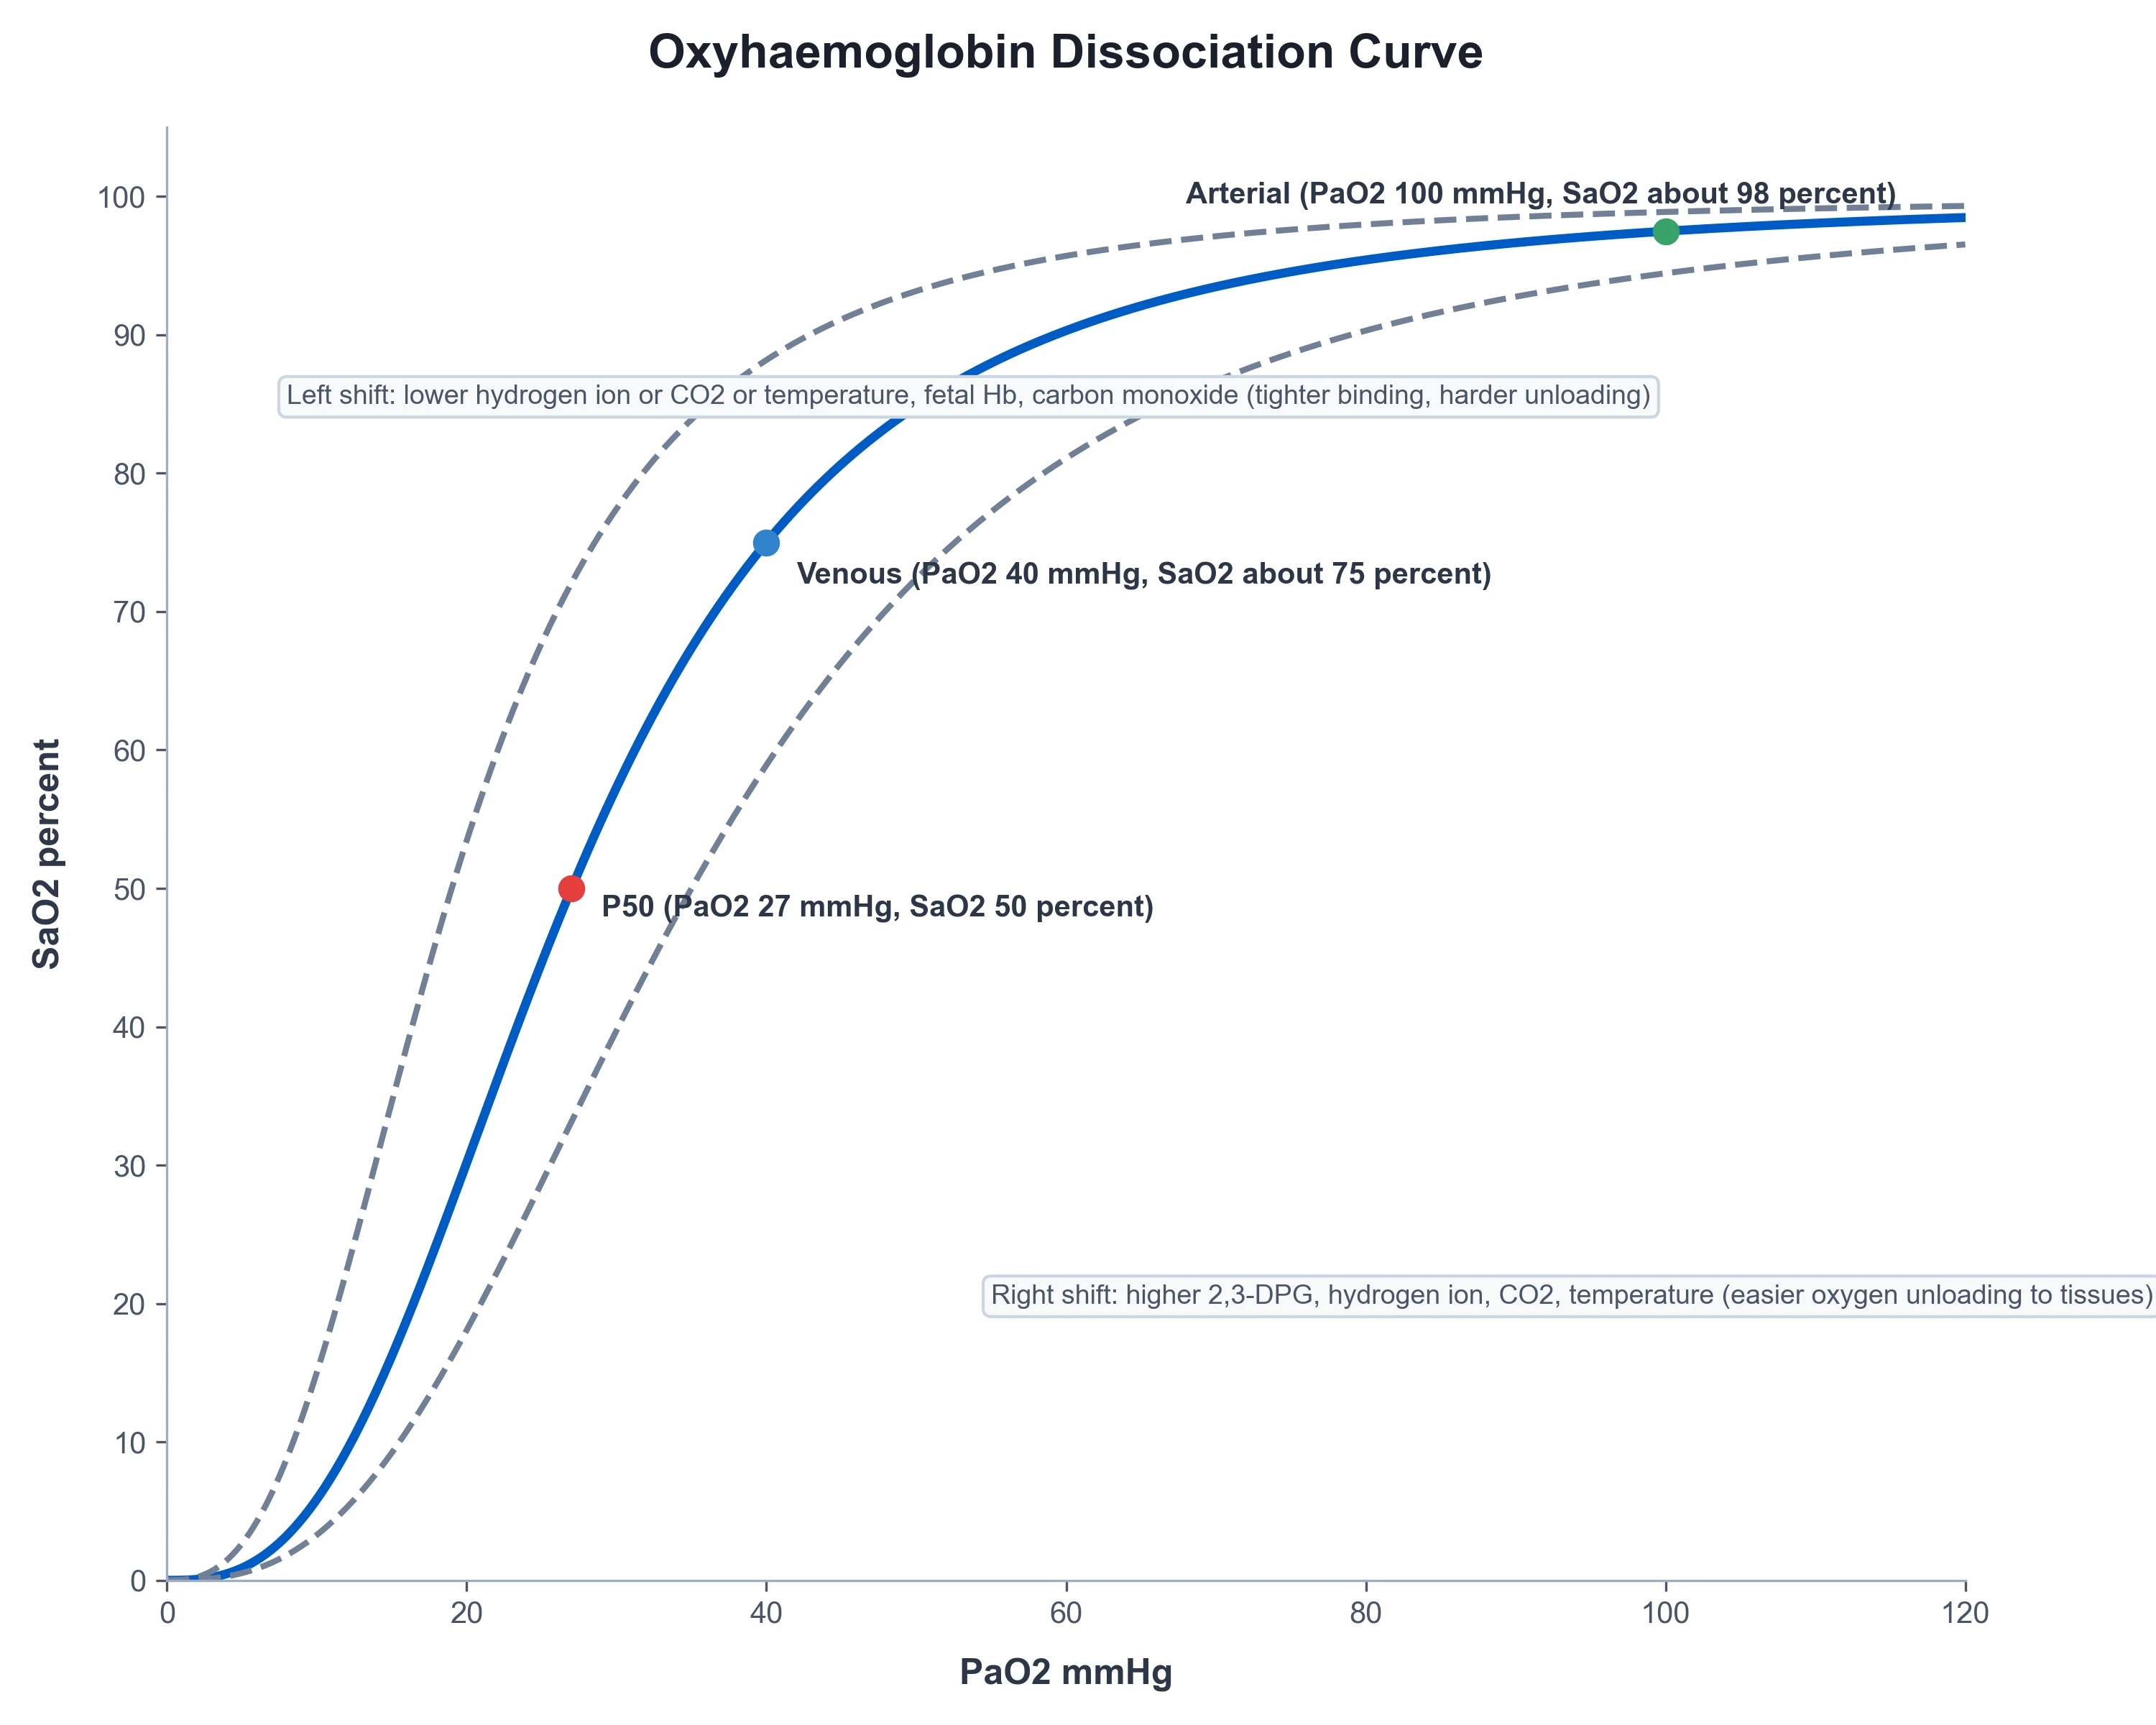
Plot percentage saturation of Hb (y) against PO2 (x). The curve is sigmoid because of cooperative binding: Hb is a tetramer (2α2β in adults); binding of each O2 molecule increases affinity of remaining sites via T (tense, deoxy) → R (relaxed, oxy) conformational change. [1]
Landmark points (must recite): [1]
| SaO2 | Approx PaO2 |
|---|---|
| 97–98% | 100 mmHg (arterial normal) |
| 90% | ~60 mmHg (steep portion begins clinically) |
| 75% | ~40 mmHg (typical mixed venous) |
| 50% | P50 ≈ 26–27 mmHg (standard conditions) |
Flat upper portion: from PaO2 60 → 100 mmHg, saturation only rises from ~90% to ~97%. SpO2 is therefore an insensitive detector of falling PaO2 on the plateau — by the time SpO2 falls clearly, PaO2 is already on the steep part. [1]
Steep lower portion: small further falls in PO2 unload large amounts of O2 — designed for tissues. [1]
P50 — the affinity index
P50 is the PO2 at which Hb is 50% saturated under standard conditions (pH 7.40, PCO2 40 mmHg, 37 °C). Normal adult P50 ≈ 26–27 mmHg. [1]
- Increased P50 = right shift = lower affinity = easier unloading
- Decreased P50 = left shift = higher affinity = tighter binding [1]
Fetal Hb (HbF) has lower affinity for 2,3-DPG and a left-shifted curve relative to adult Hb in vivo context of placental transfer (facilitates O2 uptake from maternal blood). Myoglobin has a hyperbolic curve with very low P50 — storage, not transport. [1]
Right shift — easier unloading
Factors that right-shift (raise P50): [1]
- Increased PCO2
- Increased [H+] (acidosis) — Bohr effect
- Increased temperature
- Increased 2,3-diphosphoglycerate (2,3-DPG / 2,3-BPG) [1]
Exercise, fever, and tissue acidosis all favour unloading exactly where metabolic demand is high. Chronic anaemia and high altitude increase red-cell 2,3-DPG, right-shifting and aiding unloading (with trade-offs for loading in the lung if extreme). [1]
Left shift — tighter binding
Factors that left-shift (lower P50): [1]
- Alkalosis / low PCO2
- Hypothermia
- Decreased 2,3-DPG (stored blood)
- Carbon monoxide
- Methaemoglobin (and some haemoglobinopathies)
- Fetal haemoglobin characteristics [1]
Left shift aids pulmonary loading but impairs tissue unloading — dangerous when combined with low content (CO poisoning). [1]
Bohr and Haldane effects
Bohr effect: rising PCO2 and [H+] decrease Hb–O2 affinity (right shift), facilitating unloading in metabolically active tissues. Quantitatively related to the linkage between O2 and proton/CO2 binding sites. [1]
Haldane effect: deoxygenation of Hb increases its capacity to carry CO2 (as carbamino compounds and by increased buffering of H+ from carbonic acid). Oxygenation in the lung reverses this, unloading CO2. The Haldane effect contributes a large fraction of CO2 exchange — often more than the simple dissolved CO2 difference. See the carbon-dioxide-transport topic for carriage percentages. [1]
These are reciprocal allosteric linkages: the same molecular properties that make Hb a good O2 transporter make it a good CO2 transporter. [1]
Carbon monoxide and methaemoglobinaemia
Carbon monoxide (CO): binds Hb with affinity ~200–250× that of O2 → forms carboxyhaemoglobin (COHb). Effects: (1) reduces O2 binding sites (content falls); (2) left-shifts remaining sites (unloading impaired); (3) standard pulse oximeters misread COHb and may show falsely reassuring SpO2; (4) diagnosis needs co-oximetry. Treatment: 100% oxygen (shortens CO half-life); hyperbaric O2 in selected severe cases. [1]
Methaemoglobin (MetHb): iron in Fe3+ state cannot bind O2; remaining Fe2+ sites left-shifted. Causes: oxidant drugs (benzocaine, prilocaine, dapsone, nitrites). Chocolate-brown blood, SpO2 often ~85% plateau, PaO2 (dissolved) normal. Treatment: methylene blue (care in G6PD deficiency), ascorbic acid adjunct; exchange in extreme cases. [1]
Stored blood and 2,3-DPG
In storage, red cells deplete 2,3-DPG over days → left-shifted ODC → impaired unloading after massive transfusion until 2,3-DPG regenerates over hours. Also: citrate, potassium leak, low pH of unit, and temperature — all relevant to massive transfusion physiology. Modern additive solutions mitigate but do not eliminate the 2,3-DPG issue. [1]
Oxygen extraction and venous point
The arteriovenous O2 difference normally ~5 mL/dL. Mixed venous PO2 ~40 mmHg, SvO2 ~65–75%. If DO2 falls, extraction rises (SvO2 falls) until a critical DO2 where VO2 becomes supply-dependent. Anaesthetists use ScvO2/SvO2 as global adequacy markers — imperfect but physiologically grounded. [1]
Anaesthetic relevance
- Interpret SpO2 with the curve in mind: 100% ≠ adequate content; 90% ≈ PaO2 60 mmHg.
- Hypothermia and alkalosis left-shift — during rewarming and permissive hyperventilation strategies, remember unloading effects.
- Acidotic, hypercarbic, febrile patients unload more easily but may have other problems (shift is not a treatment goal per se).
- Transfusion raises content; it does not raise PaO2.
- Pulse oximetry limitations: dyes, MetHb, COHb, poor perfusion, ambient light — co-oximetry when toxicologically indicated.
- Hyperbaric O2 can dissolve enough O2 to support life without Hb in extreme experimental settings — illustrates dissolved term under high PO2. [1]
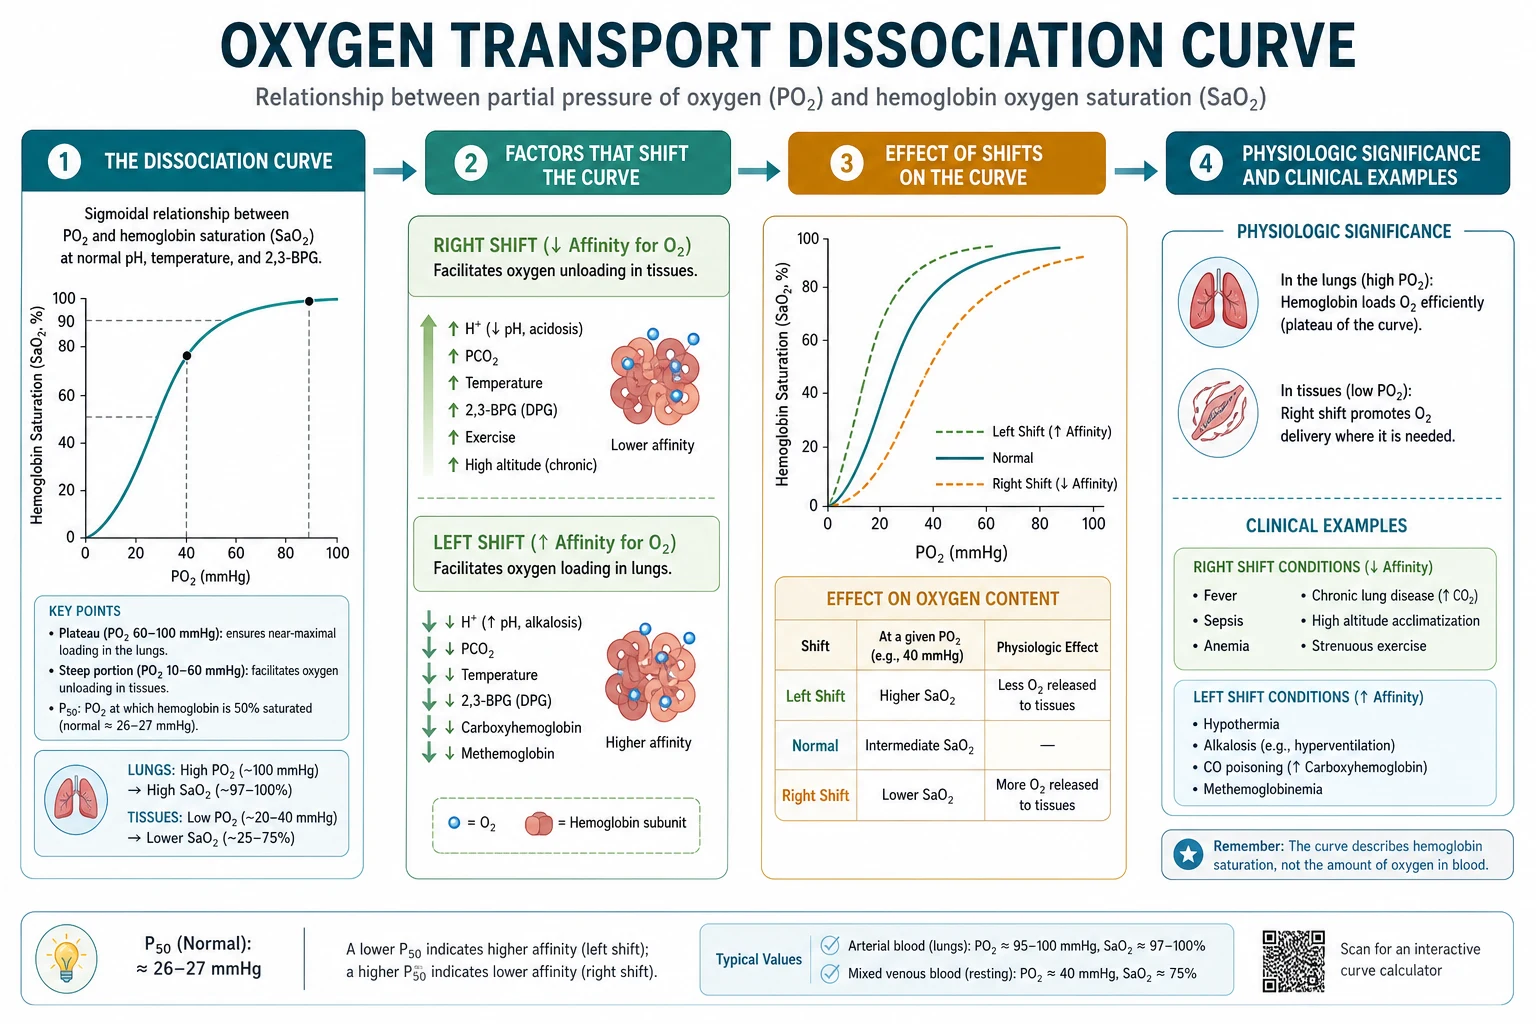
Right shift (↑P50)
- Acidosis, high PCO2
- Fever
- ↑2,3-DPG
- Easier tissue unloading
Left shift (↓P50)
- Alkalosis, low PCO2
- Hypothermia
- ↓2,3-DPG, CO, MetHb
- Harder unloading; CO also blocks sites
Equations summary board
- CaO2 = (1.34 × Hb × SaO2) + (0.003 × PaO2)
- CvO2 = (1.34 × Hb × SvO2) + (0.003 × PvO2)
- DO2 = CO × CaO2 × 10
- VO2 = CO × (CaO2 − CvO2) × 10 (Fick)
- P50 ≈ 27 mmHg standard
- Rule of thumb: 4-5-6 / 7-8-9 → PO2 40-50-60 ≈ Sat 70-80-90% (approx teaching mnemonic) [1]
Graph viva script
"Draw axes PO2 0–100 mmHg, sat 0–100%. Sigmoid curve through (27,50), (40,75), (60,90), (100,97). Draw right-shifted curve for acidosis and label increased P50. Draw left-shifted for CO and note maximum saturation reduced if COHb present. Mark arterial and venous points and the a–v saturation difference." [1]
Extended clinical scenarios
Massive transfusion: left-shifted ODC from low 2,3-DPG; cold blood; alkalosis after citrate metabolism later; watch ionised calcium and potassium. Content may be restored while unloading is transiently impaired. [1]
Pregnancy: maternal 2,3-DPG rises; mild hyperventilation (PaCO2 ~30) left-shifts — net placental transfer depends on gradients and HbF properties. [1]
Cyanide vs CO: cyanide blocks utilisation at cytochrome oxidase (histotoxic) — PO2 and content may be normal, venous oxygen high; CO blocks carriage and left-shifts. Different co-oximetry and history patterns. [1]
SAQ: oxygen content calculation
"Arterial oxygen content equals 1.34 multiplied by haemoglobin concentration multiplied by saturation, plus 0.003 multiplied by PaO2. For haemoglobin 10 g/dL and saturation 100% with PaO2 100 mmHg, content is 13.4 plus 0.3 equals 13.7 mL/dL, compared with about 20 mL/dL at haemoglobin 15. This is why anaemia reduces oxygen delivery without changing the pulse oximeter reading." [1]
Allosteric effectors molecular sketch
2,3-DPG binds the central cavity of deoxy-Hb, stabilising the T state and reducing O2 affinity. Protons and CO2 stabilise T state (Bohr). Temperature increases thermal motion and reduces affinity. CO binds with high affinity to the R-preferring sites and forces remaining subunits toward higher affinity for O2 — double hit of content loss and left shift. [1]
Clinical blood gas reporting pearls
Standard pulse oximeters use two wavelengths and assume only oxy and deoxy Hb. COHb absorbs similarly to oxyHb at 660 nm patterns that fool devices; MetHb absorbs at both wavelengths pushing SpO2 toward 85%. Multiwavelength co-oximeters measure fractional saturations: FO2Hb, FCOHb, FMetHb. Report "functional" vs "fractional" saturation carefully in vivas. [1]
Stored blood timeline
2,3-DPG falls substantially by 1–2 weeks of storage depending on preservative. After transfusion, regeneration occurs over 6–24 hours in vivo. Massive transfusion of near-outdate blood can theoretically impair unloading; in practice oxygen delivery is still improved by raising Hb, but the physiology is fair game for examiners. [1]
Primary exam expansion
Full DO2–VO2 teaching block
Resting VO2 ≈ 250 mL/min (3–4 mL/kg/min). DO2 ≈ 1000 mL/min. OER ≈ 0.25. Mixed venous O2 content ≈ 15 mL/dL; SvO2 ≈ 75%. When CO falls, OER rises and SvO2 falls if VO2 constant. When anaemia develops, CO often rises compensatorily. When SaO2 falls, the same. Critical illness may raise VO2 (sepsis, shivering, MH) or impair extraction (cytopathic hypoxia, shunting microcirculation). [1]
Rule-of-thumb saturation ladder
PaO2 27 → sat 50% (P50). PaO2 40 → sat ~75%. PaO2 60 → sat ~90%. PaO2 100 → sat ~97%. These numbers should be automatic. [1]
Temperature correction debates
Blood gas analysers measure at 37 °C. Alpha-stat versus pH-stat management in hypothermia (cardiac surgery) is applied ODC and dissociation chemistry: whether to correct gases to patient temperature and aim for pH 7.4 at actual temperature (pH-stat) or interpret uncorrected at 37 °C (alpha-stat). Know that hypothermia left-shifts the ODC and reduces metabolic rate. [1]
Fetal oxygen transfer paragraph
Maternal arterial content high; placental PO2 relatively low; fetal HbF and higher Hb concentration plus double Bohr effect (maternal right shift from fetal CO2, fetal left shift from maternal CO2 unloading) facilitate transfer. Fetal PaO2 is low by adult standards (~25–30 mmHg in umbilical vein teaching figures) yet content is adequate because of HbF/Hb concentration. [1]
Anaemia versus hypoxaemia versus cytopathic hypoxia
Anaemia: low content, normal PaO2. Hypoxaemia: low PaO2/SaO2. Stagnant hypoxia: low flow. Histotoxic: cyanide, inability to use O2 (high venous O2). Classifying hypoxia types is classic Primary material tied to the content equation. [1]
Transfusion threshold physiology
Raising Hb raises CaO2 linearly. Whether that improves outcomes depends on whether DO2 was limiting VO2 and on transfusion risks. Physiology explains the mechanism; trials set the thresholds — keep them distinct in answers. [1]
Drawing the ODC in a viva — timed script
Axes, sigmoid, mark P50 27, arterial point 100/97, venous 40/75, draw right shift with arrow "exercise, acidosis," left shift with "CO, cold, alkalosis," mention Bohr and Haldane by name, write content equation underneath. That sequence scores methodically. [1]
Extended viva dialogue
Examiner: Write the arterial oxygen content equation and calculate a worked example. [1]
Candidate: CaO2 equals 1.34 times haemoglobin times SaO2 plus 0.003 times PaO2. For Hb 15 g/dL, SaO2 1.0, PaO2 100 mmHg: bound oxygen is 20.1 mL/dL and dissolved 0.3 mL/dL, total about 20.4 mL/dL. For Hb 8 g/dL at the same saturation, bound oxygen falls to 10.7 mL/dL — severe reduction in content without any change in SpO2. [1]
Examiner: What is P50 and what shifts the curve? [1]
Candidate: P50 is the PO2 at 50% saturation under standard conditions, normally 26 to 27 mmHg. Right shift (higher P50, lower affinity) is caused by acidosis, hypercarbia, fever and increased 2,3-DPG. Left shift is caused by alkalosis, hypocapnia, hypothermia, reduced 2,3-DPG, fetal haemoglobin properties, carbon monoxide and methaemoglobin. [1]
Examiner: Explain Bohr and Haldane effects without mixing them up. [1]
Candidate: Bohr: rising CO2 and hydrogen ion reduce haemoglobin affinity for oxygen, unloading oxygen in metabolically active tissues. Haldane: deoxygenation of haemoglobin increases its capacity to carry carbon dioxide as carbamino compounds and by better proton buffering. Bohr is about the oxygen curve; Haldane is about carbon dioxide carriage. [1]
Examiner: Why is pulse oximetry unreliable in carbon monoxide poisoning? [1]
Candidate: Standard two-wavelength pulse oximeters cannot distinguish carboxyhaemoglobin from oxyhaemoglobin appropriately and read falsely high SpO2. Carbon monoxide also left-shifts the dissociation curve of remaining sites. Diagnosis requires multiwavelength co-oximetry and clinical suspicion; treatment is high-flow oxygen to competitively displace CO. [1]
Clinical synthesis: Every DO2 discussion is content times flow. Do not treat the oximeter; treat content, flow and utilisation. [1]
Worked SAQ model answers
SAQ: Describe the oxyhaemoglobin dissociation curve and factors that shift it (10 marks)
The oxyhaemoglobin dissociation curve relates haemoglobin oxygen saturation to partial pressure of oxygen. It is sigmoid because of cooperative binding among the four haem subunits as haemoglobin transitions between tense and relaxed states. Key points include P50 of approximately 27 mmHg at 50% saturation, mixed venous point near 40 mmHg and 75% saturation, the clinically important 60 mmHg near 90% saturation, and arterial blood near 100 mmHg and 97% saturation. [1]
The flat upper portion means saturation changes little as PaO2 falls from 100 to 60 mmHg, so pulse oximetry is a late warning of hypoxaemia on the plateau. The steep lower portion favours unloading in tissues. A right shift increases P50 and decreases affinity, aiding unloading; causes include raised PCO2, raised hydrogen ion concentration (Bohr effect), raised temperature and raised 2,3-DPG. A left shift decreases P50; causes include alkalosis, hypocapnia, hypothermia, low 2,3-DPG, carbon monoxide and methaemoglobin. [1]
Oxygen content equals 1.34 × [Hb] × saturation + 0.003 × PO2. Delivery is cardiac output times content. Anaemia reduces content without reducing saturation; carbon monoxide reduces content and left-shifts remaining sites while fooling standard pulse oximeters. Stored blood is depleted of 2,3-DPG and is temporarily left-shifted after massive transfusion. [1]
SAQ: Distinguish dissolved oxygen, saturation and content (5 marks)
Partial pressure is the dissolved oxygen tension driving diffusion. Saturation is the fraction of available haemoglobin binding sites occupied. Content is the total volume of oxygen per volume of blood, dominated by haemoglobin-bound oxygen. Clinical decisions fail when these three are conflated — for example assuming a normal SpO2 excludes tissue hypoxia in anaemia or low-output states. [1]
Red flags
- Oxygen content is dominated by haemoglobin-bound oxygen; anaemia desaturates delivery, not necessarily the oximeter.
- The plateau means SpO2 lags PaO2 — a falling SpO2 already means PaO2 under ~60 mmHg territory.
- CO left-shifts and fools pulse oximetry; co-oximetry required.
- Right shift aids unloading; left shift aids loading but can starve tissues.
- Stored blood loses 2,3-DPG — massive transfusion impairs unloading transiently. [1]
References
- [1]Karakurt Y, et al. Association of Day-1 Hemoglobin Oxygen Affinity (p50) with Severe Intraventricular Hemorrhage in Preterm Infants Indian Pediatr, 2026.PMID 41949748
- [2]Martinez-Rodriguez S, et al. New human bisphosphoglycerate mutase structures provide insights into the structural basis of BPGM deficiency and citrate inhibition Int J Biol Macromol, 2026.PMID 41354380
- [3]Woyke S, et al. A new approach to haemoglobin oxygen affinity research at high altitude: Determination of haemoglobin oxygen dissociation curves and 2,3-bisphosphoglycerate in an experimental human crossover hypoxic chamber study Eur J Appl Physiol, 2025.PMID 40314729
- [4]Sharma S, et al. Effects of hemodialysis on hemoglobin oxygen affinity and cardiac function Clin Kidney J, 2025.PMID 40832120
- [5]Ke J, et al. Arterial blood gas analysis in risk stratification of acute carbon monoxide poisoning Indian J Med Res, 2026.PMID 42295710
- [6]Nuzhnaya E, et al. First Symptomatic Pediatric Case of Hb Rothschild (HBB: c.112T>C, p.Trp38Arg): Low-Oxygen-Affinity Hemoglobin Presenting with Persistent Pseudohypoxemia Diagnostics (Basel), 2025.PMID 41464181