ICU · equipment-physics
Ultrasound & Imaging Physics — Comprehensive (Piezoelectric Effect, Frequency Versus Penetration, Axial and Lateral Resolution, B-Mode and M-Mode, Doppler, Artefacts, Probe Types)
Also known as Ultrasound physics · Piezoelectric effect · Pulse-echo principle · Acoustic impedance · Axial resolution · Lateral resolution · Spatial pulse length · B-mode · M-mode · Doppler ultrasound · Nyquist limit · Aliasing · Ultrasound artefacts · Acoustic shadowing · Reverberation · Ring-down artefact · Curvilinear probe · Phased array probe
Ultrasound and imaging physics for the ICU First Part: the PIEZOELECTRIC effect (crystals convert electrical energy to mechanical sound energy on transmission and back to electrical energy on reception), the pulse-echo principle (time-gated depth from the 1540 m/s soft-tissue speed of sound), the central trade-off between FREQUENCY and PENETRATION (higher frequency gives better resolution but penetrates less deeply because attenuation rises with frequency, so deep/cardiac use 2-5 MHz and superficial/vascular use 10-15 MHz), acoustic impedance and reflection (why air and bone obstruct and why coupling gel is used), AXIAL resolution (the ability to distinguish two objects along the beam — equals half the spatial pulse length, improved by higher frequency and shorter pulse length), LATERAL resolution (the ability to distinguish two objects side by side — improved by focusing the beam and narrowing its width), imaging modes (B-mode greyscale, M-mode motion over time, colour Doppler for direction and speed, pulsed-wave and continuous-wave spectral Doppler), the Nyquist aliasing limit, the common ARTEFACTS (acoustic shadowing behind calcified structures like gallstones and bone, acoustic enhancement behind fluid, reverberation, mirror image, and ring-down from gas), and the probe types (curvilinear for abdominal and POCUS, linear for vascular, phased array for cardiac).
On this page & tools
Your progress
Saved locally on this device.
8 MCQs with explanations
Target exams
Red flags
Overview
Ultrasound is sound above the audible range (above 20 kHz; medical ultrasound uses 2-15 MHz). It images by sending short pulses of sound into the body and timing the echoes that return, and it is central to ICU practice - echocardiography, vascular access, FAST, lung and pleural scanning, and DVT assessment.[1]
The pulse-echo principle
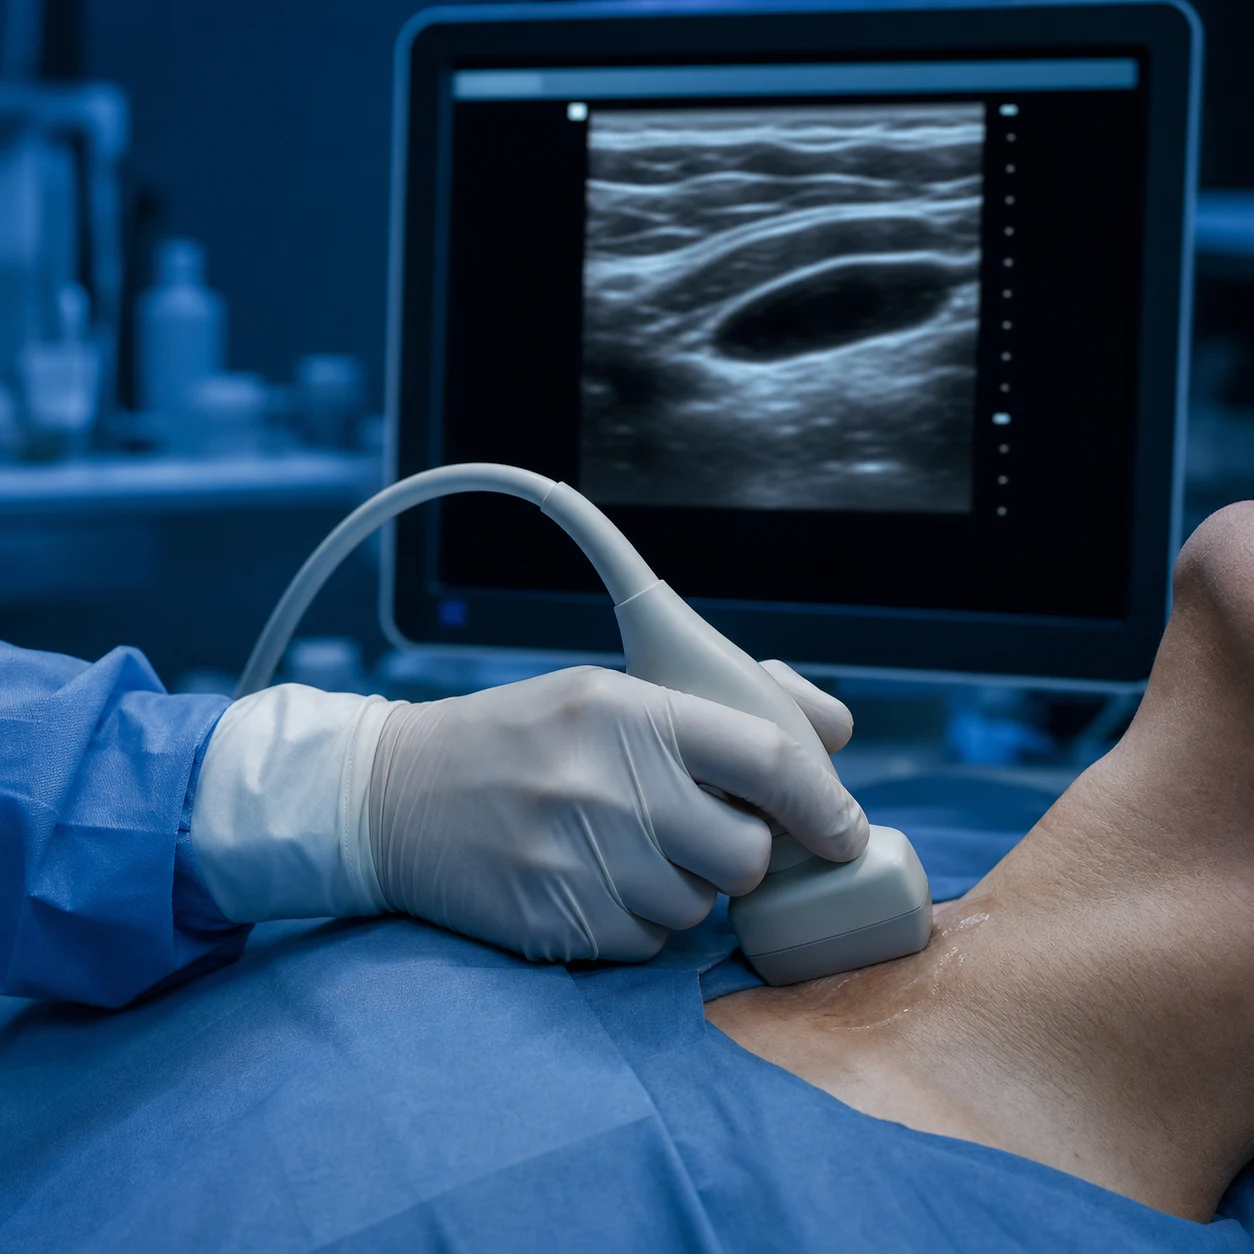
- A piezoelectric crystal in the transducer converts electrical energy to a mechanical (sound) pulse on transmission and back to an electrical signal on reception.[1]
- The machine times the echo's return and, knowing the speed of sound in soft tissue (about 1540 m/s), calculates the depth of the reflecting structure. The brightness of each returning echo sets the greyscale of the pixel.[1]
Frequency, resolution, and penetration
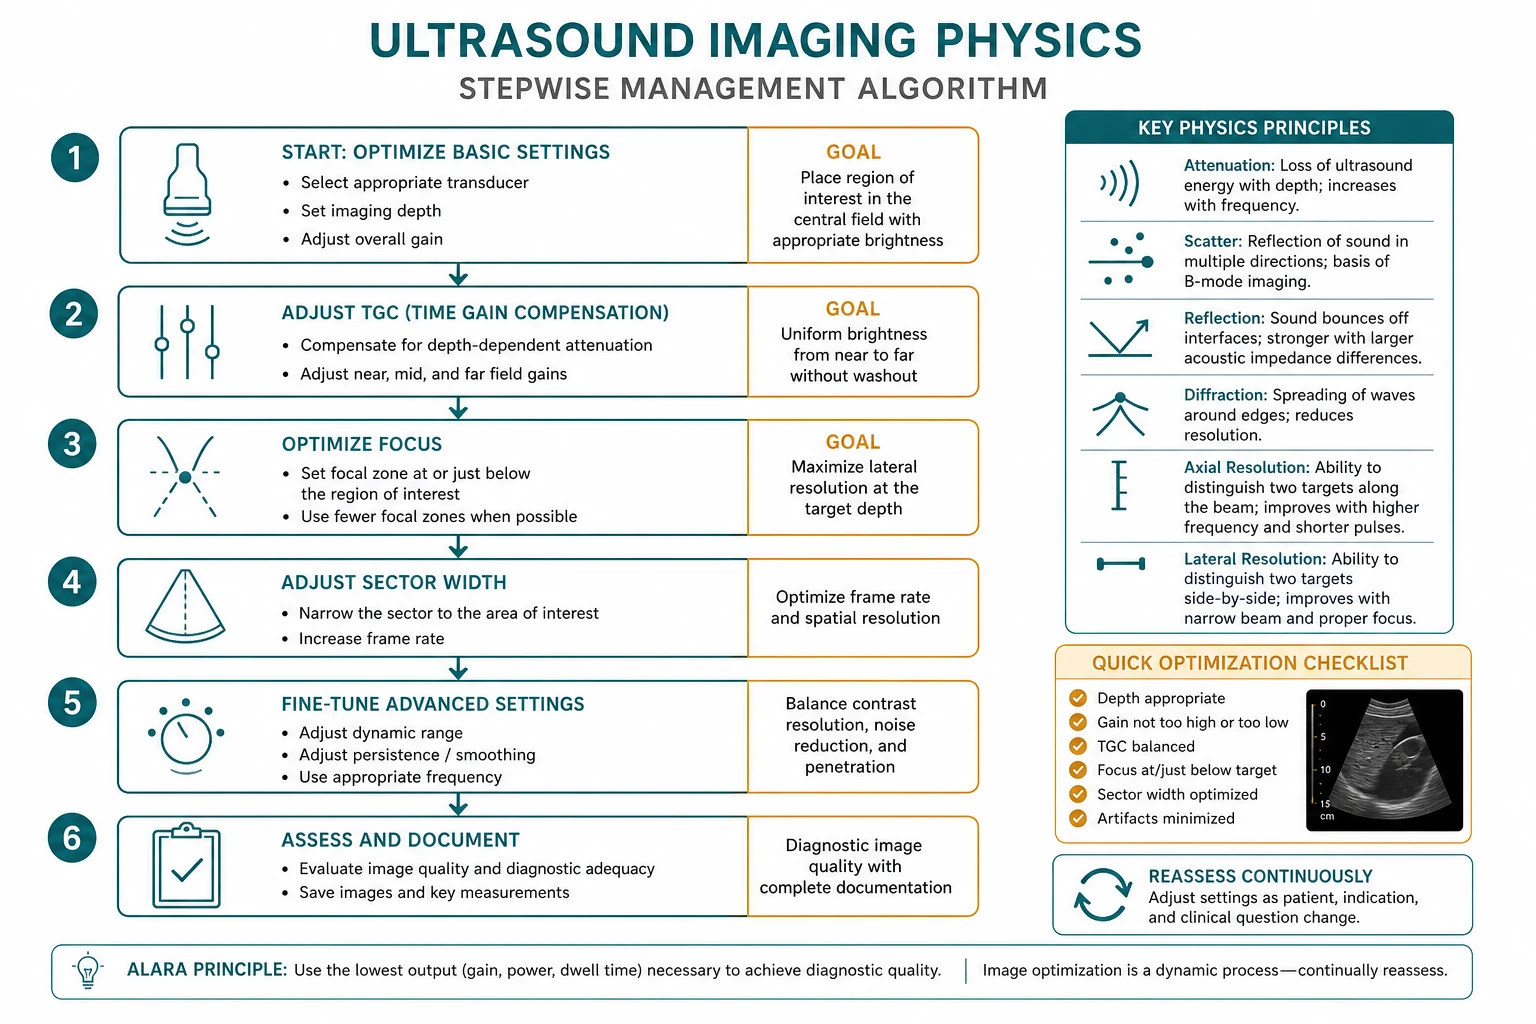
- Higher frequency gives finer resolution (shorter wavelength) but penetrates less deeply because attenuation rises with frequency; lower frequency penetrates deeper but resolves less detail.[1]
- So deep structures (abdominal, cardiac) use about 2-5 MHz; superficial structures (vascular access, line placement) use 10-15 MHz.[1]
Acoustic impedance and reflection
- Reflection occurs at the boundary between tissues of different acoustic impedance (the product of density and the speed of sound); the bigger the difference, the more sound is reflected. This is why soft-tissue interfaces image well.[1]
- Air and bone have very different impedances from soft tissue, so air reflects almost all sound (the lung and bowel gas are not penetrated) and bone casts an acoustic shadow. Coupling gel excludes the air-skin interface.[1]
Imaging modes
- B-mode (brightness) produces the familiar two-dimensional greyscale image; M-mode (motion) shows movement of a structure along a single line over time (used for lung sliding and valve motion).[1]
- Doppler detects movement: the frequency of sound reflected from a moving target shifts in proportion to its velocity. The Doppler shift is proportional to 2 times the transmitted frequency, the target velocity, and the cosine of the angle between the beam and flow, divided by the speed of sound; it is maximal when the beam is aligned with flow and zero at 90 degrees.[1]
- Colour Doppler colours flow by direction (the mnemonic BART - Blue Away, Red Toward); spectral Doppler (pulsed-wave for a sampled depth, continuous-wave for high velocities) plots velocity against time.[1]
Aliasing (Nyquist limit)
- Pulsed-wave Doppler samples flow at a specific depth, and by the Nyquist theorem it cannot correctly display velocities that produce a shift above half the pulse repetition frequency - the velocity wraps around the baseline, an artefact called aliasing. Continuous-wave Doppler, which listens continuously, has no Nyquist limit and is used for high-velocity jets (e.g. aortic stenosis).[1]
Artefacts
- Acoustic shadowing behind strongly reflecting structures (bone, calculi, calcium) where sound cannot pass.[1]
- Acoustic enhancement (increased brightness) behind fluid-filled structures (bladder, cyst) that attenuate little sound.[1]
- Reverberation - repeated echoes between two reflectors, producing evenly spaced lines (the basis of lung B-lines).[1]
The piezoelectric effect — the heart of the transducer
The transducer is the component that makes ultrasound possible, and it works by the piezoelectric effect (from the Greek piezein, to press). Certain crystalline and ceramic materials - lead zirconate titanate (PZT), quartz, and polyvinylidene fluoride (PVDF) - have a property called piezoelectricity: when a mechanical stress deforms the crystal lattice, an electrical voltage is generated across its faces (the direct piezoelectric effect), and conversely when a voltage is applied the crystal physically deforms and changes shape (the converse or inverse piezoelectric effect).[1][1]
The transducer exploits BOTH directions of this effect: [1]
- Transmit (electrical to mechanical). The machine applies a brief, high-voltage electrical pulse to the crystal. The crystal rapidly deforms and snaps back, vibrating at its resonant frequency and emitting a short burst (a pulse) of mechanical ultrasound into the tissue. This is the inverse piezoelectric effect - electrical energy in, mechanical sound out.
- Receive (mechanical to electrical). The returning echo, a mechanical pressure wave, strikes the crystal and deforms it again. By the direct piezoelectric effect this deformation generates a small voltage proportional to the pressure of the echo, which the machine amplifies, processes and maps onto the image. This is mechanical sound in, electrical energy out.[1]
So a single piezoelectric element is BOTH the loudspeaker and the microphone - it sends, then listens, then sends again. A modern transducer is an array of many such elements (64 to 256 in a typical array) that are fired in coordinated groups to steer and focus the beam electronically.[1]
Why the crystal thickness matters. A piezoelectric crystal vibrates most efficiently at its resonant frequency, which is determined by its thickness: a thinner crystal resonates at a higher frequency, a thicker crystal at a lower frequency. The crystal is cut to half the wavelength of the desired transmitted frequency (half-wave thickness). This is why you cannot simply turn a 3 MHz cardiac probe into a 12 MHz vascular probe - the resonant frequency is built into the hardware.[1]
Matching layer and backing block. Two further components complete the transducer. Because the crystal's acoustic impedance is much higher than soft tissue, a matching layer (one or more quarter-wavelength coats of intermediate impedance) is applied to the crystal face to ease the impedance transition and let sound pass into the body rather than reflect off the skin. A backing (damping) block behind the crystal absorbs rearward-travelling sound and shortens the ring-down of each pulse, producing a short, clean pulse - essential for good axial resolution (see below).[1][1]
The two directions of the piezoelectric effect
| Direction | What happens | Energy conversion | Clinical role |
|---|---|---|---|
| Transmit (converse / inverse effect) | Machine applies a voltage pulse to the crystal; the crystal deforms and vibrates, emitting a sound pulse | Electrical to mechanical | Generates the ultrasound pulse sent into tissue |
| Receive (direct effect) | A returning echo deforms the crystal; the deformation generates a voltage proportional to echo pressure | Mechanical to electrical | Detects the echo and converts it to the image signal |
| Resonant frequency | Set by crystal thickness (half-wave); thinner crystal equals higher frequency | Hardware-determined | A 3 MHz probe cannot become a 12 MHz probe - the frequency is built in |
The pulse-echo principle in depth — how depth and brightness are made
The image is built from thousands of pulse-echo cycles per second (the pulse repetition frequency, PRF). Each cycle is: send a brief pulse, then listen for the echoes that return during the waiting period, then send the next pulse. Two pieces of physics make the image:[1]
- Depth from time. Sound travels at an assumed 1540 m/s in soft tissue (the average speed; the machine uses this single assumed value for all tissues). For an echo to return from a reflector at depth d, the sound must travel down AND back, a round trip of 2d. Depth is therefore distance = speed multiplied by time divided by 2. The machine simply times the echo's return: an echo arriving 130 microseconds after the pulse came from 10 cm deep (0.00013 s times 1540 m/s, divided by 2).[1]
- Brightness from amplitude. The strength (amplitude) of the returning echo sets the brightness of the displayed pixel: a strong echo is bright white, a weak echo is grey, and no echo is black. The amplitude depends on how much sound was reflected (a function of the acoustic impedance mismatch at the interface) and how much was attenuated on the round trip.[1]
Time gain compensation (TGC). Deeper echoes are weaker simply because they have travelled farther and been attenuated more, not because the tissue is different. Without correction the image would darken with depth. The machine compensates by amplifying later-arriving (deeper) echoes more than earlier (shallower) ones - time gain compensation - so that two identical structures at different depths appear equally bright.[1]
Frequency versus penetration — the central trade-off
This is the single most examinable relationship in ultrasound physics. The wavelength of the emitted sound is the transmitted frequency divided by the speed of sound (1540 m/s). For a 5 MHz probe the wavelength is 1540 divided by 5,000,000, equal to about 0.3 mm. Resolution is fundamentally limited by wavelength - you cannot resolve structures much smaller than one to two wavelengths - so a higher frequency, with its shorter wavelength, resolves finer detail.[1][1]
But frequency is also the enemy of penetration. Ultrasound is attenuated as it travels - scattered, reflected, and absorbed (converted to heat) by tissue. Crucially, attenuation increases with frequency: roughly, the attenuation coefficient in soft tissue is about 0.5 dB per cm per MHz. A 10 MHz beam is attenuated roughly twice as much per centimetre as a 5 MHz beam, so it fades much faster with depth. The practical consequence:[1][1]
- Higher frequency = better resolution but shallower penetration.
- Lower frequency = deeper penetration but poorer resolution. [1]
There is no free lunch: you trade one for the other, and you choose the probe based on how deep the target sits. [1]
Frequency, penetration, and resolution — the trade-off
| Probe frequency | Wavelength in soft tissue | Best axial resolution | Penetration depth | Typical ICU use |
|---|---|---|---|---|
| 2-3 MHz (curvilinear / phased array) | ~0.5-0.8 mm | ~0.3-0.4 mm (1-2 SPL) | Deep, up to 25-30 cm | Abdomen, FAST, cardiac (TTE/TOE), obese patients |
| 4-5 MHz (curvilinear) | ~0.3 mm | ~0.2 mm | Moderate, up to 15-20 cm | General abdominal, thoracic, lung, pleural effusion |
| 5-8 MHz (phased / curvilinear) | ~0.2 mm | ~0.1 mm | Moderate, up to 10-15 cm | Cardiac detail, renal, bladder, deeper vascular |
| 10-15 MHz (linear) | ~0.1-0.15 mm | ~0.05-0.08 mm | Shallow, up to 4-6 cm | Vascular access, internal jugular and femoral lines, superficial DVT, nerve blocks |
Rule of thumb: always use the highest frequency that still penetrates to your target. For a 2 cm deep internal jugular vein, a 10-15 MHz linear probe gives exquisite resolution; for a transverse view of the abdominal aorta in an obese patient you may need to drop to 2-3 MHz to reach 15 cm, accepting poorer resolution as the price of seeing anything at all.[1]
Acoustic impedance and reflection — why some interfaces image and others do not
Acoustic impedance (Z) is the product of tissue density (rho) and the speed of sound in that tissue (c): Z = rho times c, measured in rayls (kg per square metre per second). It is a measure of how easily sound travels through a medium. When a sound wave meets a boundary between two tissues of different impedance, some energy is reflected back and the rest is transmitted onward. The larger the impedance difference, the greater the fraction reflected.[1]
The proportion of the beam reflected at a perpendicular interface is given by the reflection coefficient: R = ((Z2 minus Z1) squared) divided by ((Z2 plus Z1) squared), where Z1 and Z2 are the impedances of the two media. This yields the clinically crucial observations:[1]
- Soft tissue to soft tissue interfaces (liver to kidney, muscle to fat) have small impedance differences, so a little sound reflects - enough to define the interface without blocking the beam. These image well.
- Soft tissue to gas (air) is an enormous impedance mismatch. At a tissue-air interface essentially ALL the sound is reflected back and almost none is transmitted. This is why the aerated lung and gas-filled bowel cannot be imaged through - the beam never penetrates them. It is also why coupling gel is mandatory: gel has impedance close to soft tissue and excludes the air-skin interface that would otherwise reflect the entire beam at the skin surface.[1]
- Soft tissue to bone is also a large mismatch; bone reflects strongly AND absorbs sound, casting a dense acoustic shadow behind it. Ribs and sternum are acoustic obstacles to be angled around.[1]
Acoustic impedance of common media (relative to soft tissue)
| Medium | Impedance vs soft tissue | Effect on the beam | Clinical consequence |
|---|---|---|---|
| Soft tissue / water / blood | Baseline (similar to each other) | Small reflections at interfaces, good transmission | Most organs image clearly; fluid is echo-poor (black) |
| Fat | Slightly lower than soft tissue | Mild reflection at interfaces | Defines organ boundaries |
| Gas / air | Very much lower | Almost 100 per cent reflected | Lung and bowel gas block the beam; gel excludes the air-skin gap |
| Bone / calculi / calcium | Much higher | Strong reflection plus absorption | Casts a dense acoustic shadow behind |
| Metal | Very high | Total reflection | Echogenic line with a clean shadow behind |
Axial resolution — distinguishing objects along the beam
Axial resolution is the ability to distinguish two separate structures that lie along the line of the beam (one behind the other, at different depths) as two distinct objects rather than one blurred image. It is determined by the spatial pulse length (SPL) - the physical length of each emitted sound pulse, which is the number of cycles in the pulse multiplied by the wavelength.[1]
Two reflectors can be resolved as separate only if they are far enough apart that the echo from the deeper one does not overlap the echo from the shallower one. The minimum separable distance along the beam axis is half the spatial pulse length (SPL divided by 2). Axial resolution therefore equals:[1]
Axial resolution = spatial pulse length / 2 = (number of cycles times wavelength) / 2 [1]
How to improve axial resolution (make the number smaller): [1]
- Higher frequency - shorter wavelength, so shorter SPL. But this costs penetration (see above).
- Shorter pulse (fewer cycles) - achieved by damping the crystal with the backing block, so it emits a short, clean burst (typically 2-3 cycles) rather than ringing on. This is why damping matters for image quality.
- Lower frequency actually gives WORSE axial resolution because longer wavelength means longer SPL - another reason low-frequency probes look "softer".[1]
Because axial resolution depends on pulse length and not on beam width, it is uniform along the entire length of the beam (it does not degrade with depth, unlike lateral resolution). Typical axial resolution at 5 MHz is about 0.2-0.3 mm; at 12 MHz about 0.05-0.1 mm.[1]
Axial versus lateral resolution
| Property | Axial resolution | Lateral resolution |
|---|---|---|
| Definition | Distinguishing two objects along the beam (at different depths) | Distinguishing two objects side by side (at the same depth) |
| Determines | Clarity of layers front-to-back (e.g. intima-media thickness) | Clarity of side-by-side detail (e.g. separating two adjacent veins) |
| Equals | Spatial pulse length / 2 | Beam width at the focal zone |
| Improved by | Higher frequency (shorter wavelength); shorter pulse (more damping) | Focusing the beam (electronic or lens) to narrow its width |
| Worsened by | Lower frequency; long ringing pulse (poor damping) | Beam wider than the structures; wrong focal depth |
| Uniform with depth? | Yes - constant along the beam | No - best at the focus, worse near and far |
Lateral resolution — distinguishing objects side by side
Lateral resolution is the ability to distinguish two structures side by side (at the same depth, separated horizontally) as two distinct objects. It is equal to the beam width at that depth: two objects can be resolved as separate only if the beam is narrower than the distance between them. If the beam is wider than both objects, it hits them simultaneously and they are smeared into one.[1]
Unlike axial resolution, lateral resolution is NOT uniform along the beam - it varies with depth because the beam is not parallel-sided. The beam has a natural waist where it is narrowest - the focal zone - and lateral resolution is best exactly there. Above and below the focus the beam is wider and resolution worse. The beam is therefore focused to narrow the waist and to place that narrow waist at the depth of interest.[1]
How to improve lateral resolution: [1]
- Focusing the beam. A focused beam converges to a narrow waist (the focus) then diverges again. This can be done mechanically (an acoustic lens on the probe face) or, in modern arrays, electronically by firing the outer elements of the array slightly before the inner elements, creating a curved wavefront that converges at a chosen depth. Electronic focusing lets the operator move the focal zone up or down to match the target.
- Increasing the number of active elements (aperture) sharpens the focus and narrows the beam.
- Apodisation - tapering the firing strength of outer elements - reduces the side lobes that degrade lateral resolution.[1]
The trade-off of focusing: a tightly focused beam has a narrow, sharp waist but a short focal zone (depth of field) - it is excellent at one depth and poor above and below. A weakly focused beam has a wider waist but a longer useful depth of field. Adjustable multi-zone focusing lets the machine synthesise good lateral resolution over a greater depth by combining several focal zones, at the cost of a lower frame rate (because each focal zone needs its own set of pulse-echo lines).[1]
Slice thickness (elevational) resolution is the third dimension - the beam is also a few millimetres thick in the plane perpendicular to the image, and structures within that thickness are summed into a single image line, which also limits resolution. This is improved by matching the slice thickness to the focal depth and, in 4D probes, by a matrix array.[1]
Probe types — choosing the right footprint
Different clinical targets demand different probe footprints, frequencies, and beam shapes. The four common ICU probes are:[1][4]
- Curvilinear (convex) probe. A curved-face array of elements producing a sector / trapezoid-shaped image with a wide near-field footprint. Frequencies typically 2-5 MHz. Its broad field of view and good depth penetration make it the workhorse for abdominal scanning (FAST, renal, bladder, aorta), lung and pleural scanning, and general POCUS. The curved footprint spreads the scan lines, giving a wide field at depth at the cost of some lateral resolution near the surface.[1]
- Linear array probe. A flat row of elements producing a rectangular image with a flat, wide near-field. Frequencies 5-15 MHz (high). Its high frequency and fine resolution suit superficial structures: vascular access (internal jugular, subclavian, femoral lines), peripheral nerve blocks, DVT compression, and soft-tissue/musculoskeletal scanning. It cannot image deep structures well because high frequency attenuates.[4]
- Phased array probe. A small, flat footprint with relatively few elements (typically 64-128) that are all fired with carefully timed delays to steer and focus a single sector beam (electronic steering). The small footprint fits the intercostal spaces, and the low frequency (1-5 MHz) penetrates the chest wall, making it the cardiac probe par excellence - transthoracic and transoesophageal echo. The small footprint is also useful between ribs for lung scanning.[1]
- Endocavitary (intracavitary) probe. A small probe on a long handle, often high frequency, for transvaginal or transrectal imaging; rarely used in general ICU but relevant in obstetric ICU practice.[1]
Probe types and their ICU applications
| Probe | Footprint / image shape | Typical frequency | Field of view | Best for | Limitation |
|---|---|---|---|---|---|
| Curvilinear (convex) | Curved face; sector/trapezoid | 2-5 MHz | Wide, deep (up to 30 cm) | Abdomen (FAST, aorta, renal, bladder), lung/pleura, general POCUS | Lower lateral resolution near the surface |
| Linear array | Flat; rectangular | 5-15 MHz | Wide near-field, shallow (up to 6 cm) | Vascular access, nerve blocks, DVT, superficial soft tissue | Poor penetration - useless for deep targets |
| Phased array | Small flat; sector (steered) | 1-5 MHz | Deep, narrow footprint | Cardiac (TTE/TOE), between ribs, lung between intercostal spaces | Narrow near-field; more side-lobe artefact |
| Endocavitary | Small, on a handle | 5-10 MHz | Close-range sector | Transvagual/transrectal (obstetric ICU) | Limited depth and application |
Imaging modes — B-mode, M-mode, and Doppler
B-mode (brightness mode, greyscale)
B-mode is the standard two-dimensional greyscale image. A line of pulses is sent along one beam direction, the returning echoes along that line are mapped to brightness (amplitude) versus depth, and the beam is then steered to the next line; repeating this across many lines builds up a 2D image, refreshed many times per second (the frame rate). Strong reflectors are white, fluid is black, and most soft tissue is shades of grey. B-mode is the basis of nearly all diagnostic scanning - FAST, echocardiography, vascular, lung.[1][4]
M-mode (motion mode)
M-mode displays the motion of structures along a single line (one beam direction) over time. Depth is shown on the vertical axis and time on the horizontal axis; the brightness at each depth-time point reflects the echo amplitude. Because it samples only one line, M-mode has a very high temporal resolution (up to 1000+ lines per second) and is ideal for timing rapid motion - lung sliding (the seashore sign versus the barcode/stratosphere sign in pneumothorax), valve leaflet motion, and measuring chamber dimensions or wall thickness at a precise point in the cardiac cycle.[1][2]
Doppler modes
Doppler exploits the fact that sound reflected from a moving target returns with a shifted frequency - higher if the target moves toward the probe, lower if it moves away. The Doppler shift (delta f) is given by the Doppler equation:[1]
delta f = (2 times f0 times v times cos theta) / c [1]
where f0 is the transmitted frequency, v is the target velocity, theta is the angle between the beam and the direction of flow, and c is the speed of sound. The shift is proportional to velocity and to cos theta, so it is maximal when the beam is aligned with flow (theta = 0, cos theta = 1) and zero when the beam is perpendicular to flow (theta = 90, cos theta = 0) - Doppler is blind at 90 degrees. This angle-dependence is the source of the most common quantification error in ultrasound.[1]
Three Doppler modes are used in ICU:[1][4]
- Colour Doppler. Overlays colour on the B-mode image to show direction and mean velocity of flow. By convention BART - Blue Away, Red Toward (red is flow toward the probe, blue is flow away); the lighter the hue, the higher the velocity. Turbulent or high-velocity flow appears as a mosaic of colours. Colour Doppler gives a rapid visual map of where flow is and its direction (e.g. identifying a vessel, showing regurgitant jets, confirming flow in a vein before line insertion).[1]
- Pulsed-wave (PW) Doppler. Samples flow at a specific, operator-selected depth (the sample volume). A pulse is sent and the machine listens only for echoes returning from that depth (range gating), allowing velocity measurement at a precise location - e.g. across a single valve, in the left ventricular outflow tract, or in a hepatic vein. Its limitation is the Nyquist limit: it cannot correctly measure shifts above half its pulse repetition frequency, so high-velocity flow aliases (wraps around the baseline, underestimating peak velocity).[1]
- Continuous-wave (CW) Doppler. Two crystals - one transmitting continuously, one receiving continuously - so it listens to flow along the entire beam without depth discrimination. Because it samples continuously, it has no Nyquist limit and can measure very high velocities (e.g. a stenotic aortic valve at 5 m/s, severe tricuspid regurgitation). You pay for this with loss of range - it reports the maximum velocity anywhere along the beam, not at a chosen depth.[1]
Power Doppler is a variant that maps the total Doppler power (amplitude of the shift) rather than its direction, trading directional information for greatly increased sensitivity to slow flow (useful in low-flow organs like testes and kidneys), at the cost of no directional or velocity information and more susceptibility to motion artefact.[1]
Colour, pulsed-wave, and continuous-wave Doppler
| Mode | What it shows | Depth / location? | Velocity range | Best for |
|---|---|---|---|---|
| Colour Doppler | Direction + mean velocity as colour overlay on B-mode | Yes (mapped onto the image) | Qualitative (low to moderate) | Finding flow, direction, jets, confirming a vessel |
| Pulsed-wave (PW) | Spectral velocity vs time at ONE chosen depth | Yes (range-gated sample volume) | Limited - aliases above Nyquist limit | Localised flow (valve inflow, LVOT, a specific vein) |
| Continuous-wave (CW) | Spectral velocity vs time along the whole beam | No (no depth discrimination) | Unlimited - measures very high velocities | High-velocity jets (aortic stenosis, severe TR, VSD) |
| Power Doppler | Total flow power (amplitude), no direction | Yes | Most sensitive to slow flow | Low-flow organs, slow venous flow; motion-sensitive |
Aliasing and the Nyquist limit — revisited in detail
Aliasing is a fundamental limit of pulsed-wave Doppler. To measure velocity at a specific depth, PW Doppler sends a pulse and waits for the echo from that depth before sending the next pulse - so the pulse repetition frequency (PRF) sets how often it samples. By the Nyquist-Shannon sampling theorem, a signal can be reconstructed only if it is sampled at least twice per cycle; the maximum frequency that can be correctly displayed is half the PRF (the Nyquist limit).[1]
If the true Doppler shift exceeds the Nyquist limit, the displayed velocity wraps around to the opposite side of the baseline - the spectrum appears to reverse direction - so a high forward velocity is shown as an apparent backward flow, and the peak velocity is underestimated. Visually this is the classic wrap-around on a spectral trace.[1]
To eliminate aliasing and measure a high velocity correctly: [1]
- Switch to continuous-wave Doppler - it has no Nyquist limit and can measure any velocity (the standard approach for aortic stenosis and high-velocity jets).
- Raise the pulse repetition frequency (decrease the depth setting if possible, since shallower sampling allows a higher PRF).
- Lower the baseline and increase the velocity scale to shift the wrap point.
- Align the beam with flow (reduce theta) so that the measured shift is meaningful, and use a lower transmit frequency (the Doppler shift is proportional to f0, so a lower f0 produces a smaller shift for the same velocity, staying under the Nyquist limit).[1]
Colour Doppler aliasing appears as a sudden reversal of colour at the point of highest velocity (e.g. red to blue across a stenotic jet without a black gap between them - the twinkling / aliasing sign), which is itself a clue to turbulence and high velocity.[1]
Artefacts — when the image lies
Artefacts are appearances in the image that do not correspond to real anatomy. They arise because the machine makes two simplifying assumptions that are sometimes false: that sound always travels in a straight line, and that it always travels at exactly 1540 m/s. When these assumptions fail, the machine misplaces echoes and generates artefacts. Recognising artefacts (and sometimes using them diagnostically) is examinable and clinically essential.[1]
Acoustic shadowing
Acoustic shadowing is a dark (anechoic) region behind a structure that strongly reflects or absorbs sound, so that little or no sound reaches the tissue beyond it. The shadow appears because the deep tissue returns no echoes - the beam was blocked. Causes:[1][1]
- Calculi (gallstones, kidney stones) - the dense stone reflects and absorbs almost all sound, casting a clean shadow behind it (the hallmark of a gallstone versus a polyp).
- Bone (ribs, skull) - casts a dense shadow; ribs must be angled around to image the chest and upper abdomen.
- Calcification (calcified valves, atherosclerotic plaque, old haematoma) - shadows.
- Gas - bowel gas casts a dirty shadow that obscures everything behind it (a common obstacle in abdominal scanning). [1]
Acoustic enhancement (posterior / through-transmission)
Acoustic enhancement is the opposite of shadowing - an abnormally BRIGHT region behind a structure that attenuates sound very little, so that the tissue beyond it receives a stronger-than-usual beam and returns brighter echoes. The classic cause is a fluid-filled structure (a simple cyst, the full bladder, ascites, a gallbladder) through which sound passes with almost no attenuation. The bright enhancement behind a cyst is what confirms it is fluid-filled rather than solid, and the brain of TGC may be overcompensating for the fluid's low attenuation.[1][1]
Reverberation
Reverberation occurs when a sound pulse bounces back and forth between two strong reflectors (or between the probe and a reflector) before returning, so that the machine (assuming one round trip) plots the delayed echoes at progressively greater depths, producing evenly spaced parallel lines (A-lines in the lung). It is the mechanism behind lung A-lines (reverberation of the pleural line) and lung B-lines / comet-tail artefacts (a specialised reverberation from thickened interlobular septa in pulmonary oedema).[2][3]
Comet-tail and ring-down artefacts
Comet-tail artefact is a short, tightly spaced form of reverberation produced by two close reflective interfaces (e.g. cholesterol in a gallstone, or a small metal clip), appearing as a tapering train of bright echoes. Ring-down artefact is closely related but arises from gas bubbles that resonate, producing a bright trailing echo train - classically seen as the multiple parallel B-lines (vertical ring-down from the pleura) that indicate interstitial syndrome in lung ultrasound.[1][2]
Mirror image artefact
Mirror image artefact arises when sound reflects off a strong smooth reflector (classically the diaphragm) to a structure, then back along the same path; the machine plots a duplicate ("mirrored") copy of the structure on the far side of the reflector - e.g. a mirror image of the liver apparently sitting in the lung base above the diaphragm. Recognising it avoids mistaking the duplicate for a real lesion.[1]
Refraction (edge shadowing)
Refraction bends the beam as it passes obliquely between tissues of different speed (Snell's law), so echoes are misplaced laterally. At the curved edge of a fluid-filled structure (a cyst or gallbladder), refraction spreads the beam out into a shadow on each side - edge shadowing - which can mimic a septum or solid component if not recognised.[1]
Side-lobe and slice-thickness artefacts
Off-axis energy (side lobes) and the finite thickness of the beam slice can place echoes where there is no real structure, appearing as bright echoes within an anechoic cyst. These are minimised by good focusing and apodisation.[1]
Common ultrasound artefacts and how to recognise them
| Artefact | Mechanism | Appearance | Clinical example |
|---|---|---|---|
| Acoustic shadowing | Strong reflector/absorber blocks the beam | Dark region behind a structure | Gallstone, rib, calcified valve |
| Acoustic enhancement | Low-attenuation fluid lets more sound through | Bright region behind a cyst | Simple cyst, full bladder, ascites |
| Reverberation | Echoes bounce between reflectors | Evenly spaced parallel lines | Lung A-lines |
| Comet-tail / ring-down | Tightly spaced reverberation or gas resonance | Tapering bright echo train | Lung B-lines in pulmonary oedema |
| Mirror image | Reflection off a strong smooth surface (diaphragm) | Duplicate structure on the far side | Liver "mirrored" above the diaphragm |
| Edge shadowing | Refraction at the curved edge of a cyst | Shadow at the side of a cyst | Septum-like artefact beside a cyst |
| Side-lobe artefact | Off-axis beam energy returns from elsewhere | Bright echoes within an anechoic cyst | Sludge-like echoes in a simple cyst |
| Speed displacement | Sound travels slower/faster than 1540 m/s | Structure misplaced in depth | Apparent shift through fat |
The Doppler equation and angle correction — avoiding the common error
Because the Doppler shift is proportional to cos theta, any angle between the beam and flow reduces the measured velocity by cos theta, and at 90 degrees the measured shift is zero. To report a true velocity the operator must angle-correct: align a cursor on the spectral display with the direction of flow so the machine divides by cos theta. Two pitfalls:[1][1]
- Never angle-correct venous flow for line placement or DVT assessment. Veins have slow, low-velocity flow where the error of an assumed angle dwarfs the measurement; angle correction can manufacture a velocity reading from noise. Use colour and compressibility, not spectral velocity, for veins.
- Always align the beam with high-velocity jets (aortic stenosis, tricuspid regurgitation) and minimise theta, because a small angle error at high velocity produces a large velocity error - e.g. mis-estimating peak aortic velocity undergrades stenosis severity.[1]
Biologic effects and safety — thermal and mechanical indices
Although diagnostic ultrasound is generally safe, it deposits energy in tissue, and two indices are displayed to guide safe use:[1]
- Thermal index (TI). Estimates the maximum temperature rise (degrees C) that could occur in tissue under the beam. A TI below 1 is generally considered safe; prolonged exposure (especially to bone, which absorbs more energy, or in the first trimester of pregnancy) should be kept as low as reasonably achievable (the ALARA principle).
- Mechanical index (MI). Estimates the likelihood of cavitation (microbubble formation and collapse) from the peak negative pressure of the pulse. An MI below 1.9 is generally safe in non-contrast imaging; contrast microbubbles lower the cavitation threshold. [1]
Doppler modes deposit more energy than B-mode (they fire more intensely and more often), so for fetal and ocular scanning the lowest-power settings consistent with a diagnostic image are used, and exposure time is minimised. The ALARA principle - lowest output, shortest time, smallest window - governs all scanning, particularly in pregnancy.[1]
Choosing the probe and mode — a practical framework
Selecting probe and mode for an ICU scan
- DECIDE the depth of the target first. Depth drives frequency, which drives probe choice. A superficial target (IJ vein at 2 cm) wants high frequency; a deep target (aorta at 15 cm in an obese patient) wants low frequency. Estimate depth before you reach for a probe.[1]
- MATCH the probe footprint to the acoustic window.
- Between ribs (cardiac, lung) - phased array (small footprint fits the intercostal space, low frequency penetrates).[1]
- Open abdominal surface (FAST, renal, aorta, bladder) - curvilinear (wide field of view, good depth).[4]
- Superficial structures (vessels, nerves, soft tissue) - linear (high resolution).[4]
- SET the depth so the target sits in the mid-field, not pinned at the bottom. This keeps the focal zone over the region of interest and the frame rate reasonable.[1]
- ADJUST the focus (if manual) to the target depth - lateral resolution is best at the focal zone. With auto-focusing, confirm the focal markers bracket the target.[1]
- OPTIMISE gain and TGC so fluid is black and soft tissue is mid-grey - not so dark that low-level echoes vanish, not so bright that noise fills the cysts. Adjust TGC so the near and far fields are equally bright.[1]
- ADD Doppler when you need flow information:
- Colour Doppler to find a vessel, confirm patency, and map regurgitant jets.
- Pulsed-wave to measure velocity at a single depth (e.g. mitral inflow, LVOT).
- Continuous-wave for high-velocity jets (aortic stenosis, severe TR).[1]
- ALIGN the beam with flow (minimise theta) and never angle-correct slow venous flow. For high-velocity jets, hunt for the window that aligns beam and jet to avoid underestimating peak velocity.[1]
- RECOGNISE and work around artefacts: reposition to escape bowel gas and rib shadows; identify a cyst by its enhancement and a stone by its shadow; do not over-call pathology from a single artefact pattern.[1]
- SCAN from multiple windows and angles before concluding - a shadowed view at one angle may be wide open from another. Ultrasound is operator-dependent; the quality of the answer depends on the operator.[4]
Troubleshooting a poor image
When the image is poor - a systematic fix
- IS THERE AIR between probe and skin? Reapply coupling gel liberally; an air gap reflects the entire beam at the skin.[1]
- IS BONE OR GAS IN THE WAY? Reposition around ribs (use the probe footprint between intercostal spaces) and wait for or roll the patient to shift bowel gas.[1]
- IS THE FREQUENCY TOO HIGH FOR THE DEPTH? Switch to a lower-frequency (curvilinear/phased) probe, or drop the frequency if the probe is multi-frequency. A beautifully resolved near-field with a dark, empty deep field means penetration is insufficient.[1]
- IS THE DEPTH SET TOO DEEP (target tiny at the bottom) or too shallow? Reset depth so the target fills the mid-screen.[1]
- IS GAIN TOO LOW (dark) OR TOO HIGH (white-out / noise in cysts)? Adjust overall gain; check TGC so far-field echoes are adequately amplified.[1]
- IS THE FOCUS IN THE WRONG PLACE? Move the focal zone to the target depth (if manually adjustable).[1]
- IS DOPPLER ALIASING? For PW aliasing, switch to CW, raise the PRF/scale, lower the baseline, or lower the transmit frequency. For colour aliasing (twinkle), it may actually indicate the high-velocity jet of interest.[1]
- IS THE ANGLE POOR FOR DOPPLER? Reapproach so the beam aligns with flow (theta near 0); recall Doppler is blind at 90 degrees.[1]
Exam practice — SAQs
SAQ — Choosing the probe and recognising artefacts at the bedside
10 minutes · 10 marks
A 72-year-old woman in ICU day 4 after laparotomy for perforated diverticulitis becomes hypotensive (BP 88/50) and hypoxic. The registrar performs bedside ultrasound, first using a 10 MHz linear probe over the midline to assess the abdominal aorta but obtains only a beautifully resolved near-field with a dark, empty deep field. Switching to a 3 MHz curvilinear probe reveals the aorta and a fluid-filled gallbladder with a bright region behind it and a dense dark band behind an echogenic focus within. On lung scanning of the dependent zones, vertical ring-down artefacts arise from the pleural line.
SAQ — Lung ultrasound and the BLUE protocol in acute respiratory failure
10 minutes · 10 marks
A 65-year-old man is admitted to the ICU with acute respiratory failure - respiratory rate 32, SpO2 88 per cent on 15 L per min oxygen via a non-rebreather mask, blood pressure 110/70, afebrile, no chest pain. He has a history of ischaemic heart disease. Lung auscultation reveals bilateral fine crackles. You perform bedside lung ultrasound to refine the differential diagnosis of acute respiratory failure.
Clinical pearls
Red flags
Key trials and evidence
Volpicelli 2012 — International evidence-based recommendations for point-of-care lung ultrasound (PMID 22392031)
Source
Intensive Care Medicine - first international consensus conference on point-of-care lung ultrasound (PoCLUS)
Design
Multidisciplinary panel of 28 experts from 8 countries; GRADE and RAND appropriateness methods; 73 statements evaluated
Key finding 1
65 strong recommendations on lung ultrasound in the critically ill, covering interstitial syndrome, alveolar consolidation, pneumothorax, and pleural effusion
Key finding 2
Standardised the artefact-based interpretation of the normally aerated lung (A-lines, lung sliding) and the pathological patterns (B-lines, consolidation)
Clinical bottom line
Lung ultrasound relies on artefact analysis (reverberation A-lines, ring-down B-lines) rather than tissue imaging - the physics of artefacts IS the clinical exam
Lichtenstein & Meziere 2008 - the BLUE protocol (PMID 18468674)
Source
Chest - prospective study of 260 patients with acute respiratory failure
Design
Bedside lung ultrasound integrated into a diagnostic algorithm (BLUE protocol) compared with the final ICU diagnosis
Key finding
Lung ultrasound alone gave the correct diagnosis in 90.5 per cent of cases (acute pulmonary oedema from bilateral A/B profiles, pneumothorax from absent lung sliding with A-lines, consolidation, DVT-associated profiles)
Clinical bottom line
Demonstrates that reverberation and ring-down artefacts (A-lines, B-lines) and M-mode (lung sliding) are diagnostically decisive in the critically ill - artefact recognition is clinical, not merely physics
Feldman, Katyal & Blackwood 2009 - US artefacts (PMID 19605664)
Source
Radiographics - review of ultrasound image artefacts
Design
Pictorial review classifying artefacts by mechanism: beam characteristics, propagation in matter, and image-processing assumptions
Key finding
Systematised shadowing, enhancement, reverberation, comet-tail/ring-down, mirror image, refraction/edge shadowing, and side-lobe artefacts with their mechanisms and recognition criteria
Clinical bottom line
Recognising artefacts both improves image quality and uses them as diagnostic clues to tissue composition - the examinable artefact framework for the First Part
Mayo et al 2009 - competence in critical care ultrasonography (PMID 19318664)
Source
Chest - ACCP/SRLF joint competence statement
Design
Expert consensus defining the scope and competencies of critical care ultrasonography (general and cardiac)
Key finding
Defined the cognitive competencies (including probe selection, artefact recognition, and Doppler principles) and the practical applications expected of the intensivist
Clinical bottom line
Establishes the physics knowledge (piezoelectric pulse-echo, frequency/penetration, resolution, Doppler, artefacts) as a core competency for ICU practice
Prognosis and outcomes
How ultrasound physics determines what you can and cannot see
| Scenario | Consequence | Determining physics |
|---|---|---|
| High-frequency probe on a deep target | Beautiful near-field, dark/empty deep field | Attenuation rises with frequency; insufficient penetration |
| Beam perpendicular to flow (90 degrees) | No Doppler shift measured | cos 90 equals 0; Doppler is blind at 90 degrees |
| Pulsed-wave on a high-velocity jet | Wrap-around aliasing, underestimated peak velocity | Shift above Nyquist limit (half the PRF) |
| Air between probe and skin | No image - black screen | Air reflects nearly all sound; gel excludes the interface |
| Bone or stone in the beam path | Dark acoustic shadow hides deep structures | Strong reflection plus absorption |
| Fluid-filled structure in the beam | Bright enhancement behind confirms fluid | Low attenuation lets more sound through to the deep tissue |
| Thickened interlobular septa (oedema) | Multiple vertical B-lines | Ring-down/reverberation artefact from the septa |
| Smooth strong reflector (diaphragm) | Mirror image of the liver above it | Reflection duplicates the structure on the far side |
Summary
Ultrasound physics reduces to a handful of examinable ideas: a piezoelectric crystal transduces electrical to mechanical energy and back (pulse-echo); frequency trades resolution for penetration (use the highest frequency that reaches the target); acoustic impedance governs reflection (air and bone obstruct); axial resolution equals half the spatial pulse length and lateral resolution equals beam width (improved by focusing); B-mode images in greyscale, M-mode shows motion over time, and Doppler measures velocity (colour for direction, pulsed-wave for depth but with the Nyquist aliasing limit, continuous-wave for high velocities, all angle-dependent); and the common artefacts - shadowing, enhancement, reverberation, mirror image, and ring-down - arise from the machine's assumptions about sound travel and can both mislead and diagnose. Matching the probe (curvilinear, linear, phased array) to the target depth and acoustic window is where the physics becomes clinical.[1][1][1]
References
- [1]Feldman MK, Katyal S, Blackwood MS US artifacts Radiographics, 2009.PMID 19605664
- [2]Volpicelli G, Elbarbary M, Blaivas M, et al. International evidence-based recommendations for point-of-care lung ultrasound Intensive Care Med, 2012.PMID 22392031
- [3]Lichtenstein DA, Meziere GA Optimizing the accuracy of detecting a functional corpus luteum in dairy cows Theriogenology, 2008.PMID 18468674
- [4]Mayo PH, Beaulieu Y, Doelken P, et al. Impact of pulmonary artery pressure on exercise function in severe COPD Chest, 2009.PMID 19318664