ICU · Quality / safety
Quality Improvement, Patient Safety & Incident Analysis
Also known as Quality improvement · QI · Patient safety · Incident analysis · Root cause analysis · RCA · PDSA cycle · Model for Improvement · Lean · Six Sigma · DMAIC · Checklist · Care bundle · Sentinel event · Never event · CLABSI · VAP · CAUTI · Just culture · Swiss cheese model · Daily goals · Rapid response team · Standardised mortality ratio · Ventilator day · Handover
Quality improvement (QI), patient safety, and incident analysis in the ICU. QI methods: the Model for Improvement, the PDSA cycle (plan-do-study-act), Lean (waste removal, value-stream), Six Sigma (defect reduction, DMAIC), root cause analysis (RCA), fishbone/Ishikawa, the 5 Whys, audit and feedback, the Triple Aim, and statistical process control (run/control charts). Patient safety in ICU: types of error (medication, procedural, diagnostic, handover/communication), healthcare-associated infections (CLABSI, VAP, CAUTI), pressure injuries, falls, unplanned extubation. Safety culture: the just culture (Marx), blame-free/near-miss reporting, the Swiss cheese model (Reason), incident reporting systems, the Global Trigger Tool. Checklists and bundles in ICU: the WHO Surgical Safety Checklist, the central line bundle, the ventilator (VAP) bundle, the intubation checklist, the daily goals checklist. Risk management; audit vs research vs QI; key ICU QI metrics (ventilator days, LOS, mortality/SMR, readmission, CLABSI/VAP rates); Sentinel Events and Never Events (ANZ / WHO / Joint Commission frameworks).
On this page & tools
Your progress
Saved locally on this device.
8 MCQs with explanations
Target exams
Overview & definition
Quality improvement (QI) is the systematic, data-driven effort to close the gap between the care we KNOW works (evidence) and the care patients ACTUALLY receive. Patient safety is the discipline — and the moral imperative — of preventing avoidable harm from that care. In the ICU the two are inseparable: the ICU generates more errors, more drug doses, more invasive procedures, and more handovers per patient-day than any other hospital ward, because critically ill patients are the most complex, the most unstable, and the most dependent on human-system interaction.[1][1]
The scale of the problem is large. The landmark U.S. studies (Harvard Medical Practice Study, IOM To Err is Human, Classen Global Trigger Tool) converged on a finding that ~10% of hospital admissions involve a harmful adverse event, and roughly half are preventable; the ICU, with its device load and pharmacological density, sits at the high end of that range. Classen et al. found that routine voluntary reporting captured only ~1 in 10 of the harms the trigger tool detected, which is why incident reports are necessary but never sufficient.[1][16][18]
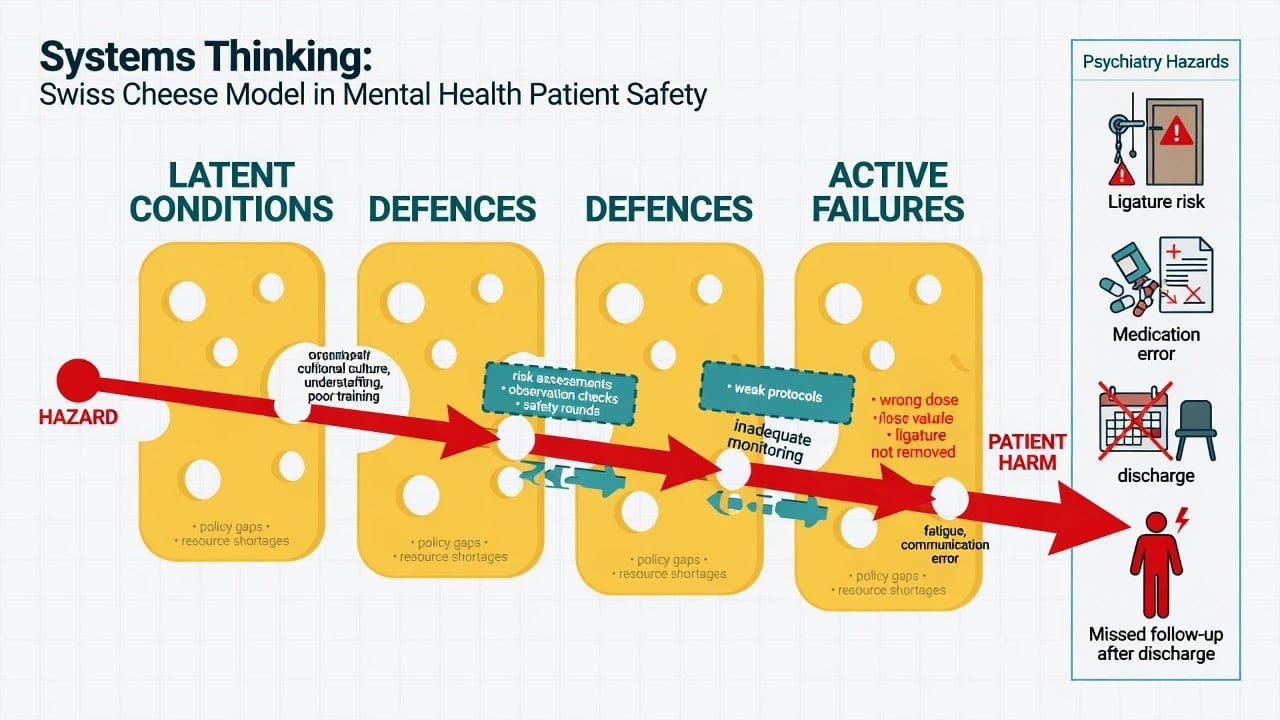
The modern answer is a systems approach (Reason): errors are not primarily individual failures but consequences of latent system conditions (poor design, production pressure, fatigue, missing standardisation). The clinician is the last, fallible barrier; defence in depth — multiple thin Swiss-cheese slices (checklists, double-checks, alarms, redundancy) — catches most errors before they reach the patient. The cultural corollary is the just culture (Marx): distinguish human error (manage via system redesign) from at-risk behaviour (coach) and reckless behaviour (sanction). A blame culture suppresses reporting; a blame-free culture erodes accountability. The just culture holds both.[1][20]
The high-yield exam architecture: (1) QI methods — Model for Improvement + PDSA, Lean, Six Sigma/DMAIC, audit/feedback, statistical process control; (2) Incident analysis — RCA, fishbone, 5 Whys, the London Protocol, Sentinel Events and Never Events; (3) Patient-safety targets — medication/procedural/diagnostic/handover errors, device-associated infections (CLABSI/VAP/CAUTI), pressure injuries, falls; (4) Reliability tools — checklists, bundles, daily goals, standardised handover (ISBAR/I-PASS); (5) Safety culture — just culture, incident reporting, the Global Trigger Tool; (6) Measurement — structure/process/outcome metrics, SMR, ventilator-day rate, ICU LOS; (7) Audit vs research vs QI — the regulatory distinction that governs whether ethics approval is needed. [1]
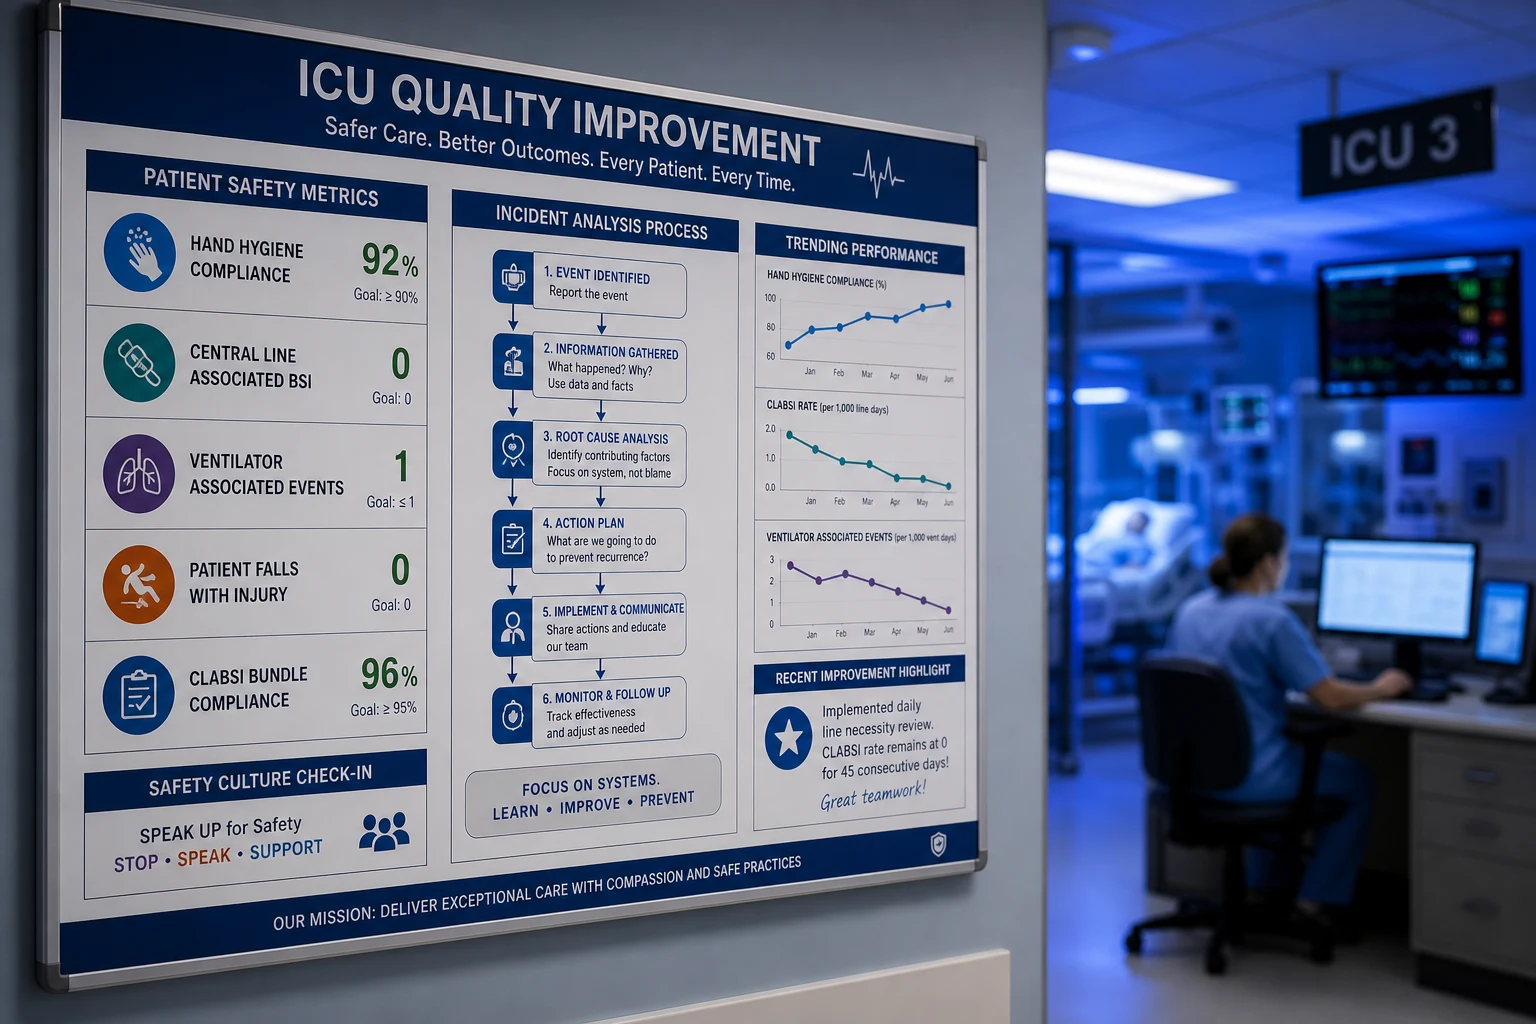
The QI framework — Donabedian and the Triple Aim
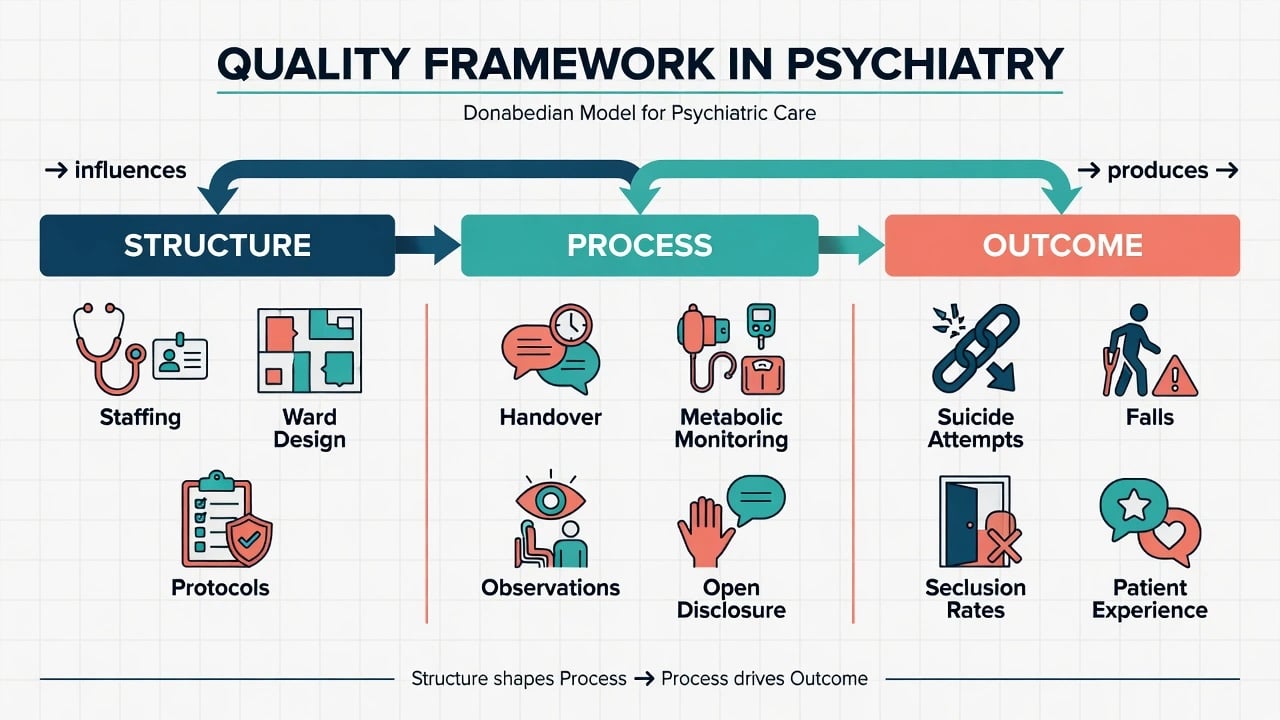
Every QI conversation in the exam begins with how you structure the question. The Donabedian model (1966) gives the spine: any quality question can be framed as Structure (the setting, staffing, equipment, protocols), Process (what is actually done — the right drug, the right dose, the right time, the bundle element completed), or Outcome (what happens to the patient — mortality, infection, LOS, satisfaction). Berwick's Triple Aim (IHI, 2008) reframes the policy goal: (1) better individual experience of care, (2) better population health, (3) lower per-capita cost. A fourth aim — clinician well-being / joy in work (the "Quadruple Aim") — was added once it became clear that burnout drives medical error and that you cannot have safe care with a demoralised workforce.[1]
Structure / Process / Outcome — the Donabedian model applied to the ICU
| Domain | Definition | ICU example | Strength / weakness |
|---|---|---|---|
| Structure | The setting, resources, and organisation of care | ICU bed-to-nurse ratio; presence of an intensivist 24/7; closed vs open unit; availability of ultrasound, smart pumps, CPOE; presence of an incident-reporting system | Easiest to measure and to change; furthest from the patient — a good structure doesn't guarantee good care |
| Process | What is actually done for the patient | Central line insertion with full barrier precautions and ultrasound; the VAP bundle applied each day; the sepsis bundle delivered within 1 hour; daily sedation interruption; daily delirium screening | Closest to what the clinician controls; bundle adherence is a high-yield process metric; sensitive to local culture |
| Outcome | What happens to the patient | ICU and hospital mortality; standardised mortality ratio (SMR); CLABSI/VAP/CAUTI rates per 1000 device-days; ICU LOS; unplanned extubation rate; family satisfaction | What patients and payers actually care about; but heavily confounded by case mix — must be risk-adjusted (SMR, APACHE/SAPS) |
- Process metrics are the highest-yield improvement targets because they are within the team's control, change quickly with intervention, and link causally to outcome. Outcome metrics (e.g. SMR) are essential for accountability and benchmarking but are slow, confounded, and hard to act on alone. The mature QI programme reports all three layers, with process metrics leading the dashboard.[1]
QI methods — the toolkit
No single method fits every problem. The skilled QI clinician knows several, picks the right one for the problem, and is comfortable running small PDSA cycles inside a larger Lean or Six Sigma programme. [1]
The Model for Improvement (IHI) — three questions + the PDSA cycle
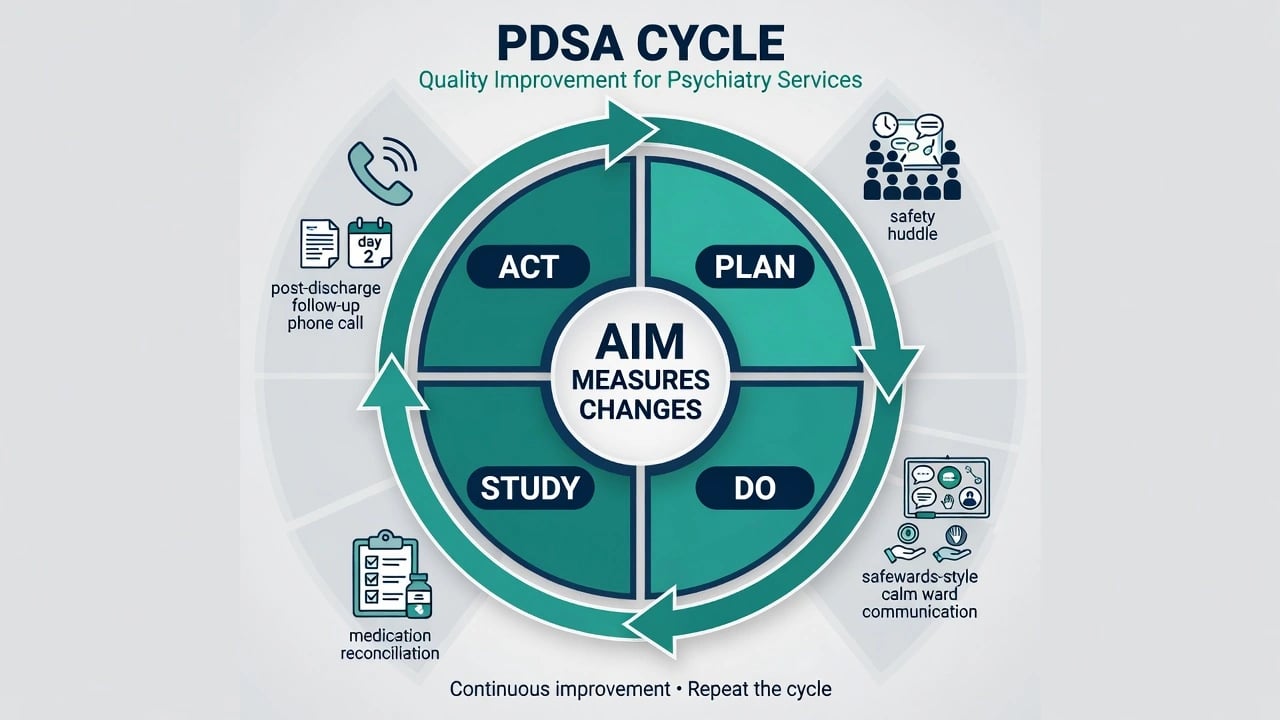
The Model for Improvement, developed by Associates in Process Improvement and popularised by the Institute for Healthcare Improvement, is the dominant QI architecture in critical care. It begins with three questions: (1) What are we trying to accomplish? (a specific, measurable aim — e.g. "reduce CLABSI from 4.2 to <1 per 1000 catheter-days within 12 months"); (2) How will we know a change is an improvement? (define the metric and how it is charted, usually on a run or control chart); (3) What changes can we make that will result in improvement? (the change concepts, drawn from the literature, frontline ideas, and other units). Only then does the PDSA cycle test the change.[15]
The PDSA cycle — plan, do, study, act (one small test)
- PLAN — define the test before you run it. State the question and the prediction ("if we move intubation drugs to a standardised pre-filled tray at the bedside, we predict the time-to-ready and the omission-error rate will fall"). Define the population, the metric, the data source, the time period, who does what, and the sample size (start small — one nurse, one shift, one patient). Write down the prediction so the Study phase can compare against it.[15]
- DO — run the test, exactly as planned, and capture the data. Run the test on the small scale defined in Plan. Collect quantitative (times, counts, error rates) AND qualitative data (what was hard, what surprised people, what was unexpected). Note deviations from plan and any contextual changes. Do not skip this — undocumented deviations make the Study phase meaningless.
- STUDY — compare results to the prediction and learn. Did the data match the prediction? If yes — why? If no — why not? Use a run chart to see signal through noise. Look for unintended consequences (the new tray created confusion, or freed up time that was spent elsewhere). The learning IS the deliverable, not just the metric movement.
- ACT — decide what to do next. Three options: (a) ADAPT — modify the change and run another PDSA (most common — the first test rarely lands perfectly); (b) ADOPT — the test worked; scale it to the next level (more shifts, more patients, a second unit) with another PDSA; (c) ABANDON — the change did not work or had unacceptable downsides; pick a different change concept. PDSA is iterative — most improvements take 4–10 linked cycles before they stabilise.[15]
- Run PDSA cycles small and fast. The point of PDSA is rapid, cheap, low-risk learning — change one thing, test on one nurse on one shift for one day, then iterate. Scaling an untested change across the whole unit in one go (the "big bang") is not QI, it is risky practice change. The classical error is to call a unit-wide roll-out a "PDSA" — it is not, because it has no iterative learning loop.[15]
Lean — eliminate waste, define value
Lean, derived from the Toyota Production System and brought to healthcare, asks: what creates value for the patient, and what is waste (muda)? Anything that does not add value from the patient's perspective is a target for removal. The eight wastes in healthcare are easily remembered as DOWNTIME: Defects (errors, rework), Overproduction (printing reports nobody reads), Waiting (for beds, scans, results, handover), Non-utilised talent (the junior who spots the problem but is not heard), Transportation (moving patients for tests), Inventory (expired drugs, overstocked stores), Motion (staff walking to find equipment), Extra-processing (duplicate documentation). Lean tools include value-stream mapping (walk the patient's journey, time each step, mark value-add vs waste), 5S (Sort, Set in order, Shine, Standardise, Sustain — visual workplace organisation), kaizen (continuous small improvement by frontline staff), and gemba (go to where the work happens to see reality).[1]
Six Sigma — reduce variation and defects
Six Sigma, developed at Motorola and brought to healthcare by GE, is a data-driven method to reduce variation and eliminate defects. The name denotes a statistical target: process performance so tight that defects are vanishingly rare (<3.4 defects per million opportunities). The core engine is the DMAIC cycle: Define (the problem, the customer, the project scope), Measure (baseline performance — how bad is it really?), Analyse (find the root causes using data and statistical tools — Pareto charts, regression, fishbone), Improve (design and pilot the intervention), Control (sustain the gain with monitoring, standard work, and statistical control). Six Sigma suits problems with measurable defects and high volume (e.g. laboratory turnaround, medication dispensing). Lean Six Sigma blends the two: Lean removes waste, Six Sigma removes variation.[1]
QI methods compared — pick the right tool for the problem
| Method | Origin | Core question | Best for | Key tools |
|---|---|---|---|---|
| Model for Improvement + PDSA | Deming / IHI | "What are we trying to accomplish; how will we know; what change can we test?" | Testing a specific change idea in a clinical setting | PDSA cycle, run chart, driver diagram |
| Lean | Toyota Production System | "What adds value for the patient; what is waste?" | Removing waste from a complex care pathway | Value-stream map, 5S, kaizen, gemba, A3 thinking |
| Six Sigma | Motorola / GE | "What drives variation and defects in this process?" | High-volume, defect-counted processes (lab, pharmacy) | DMAIC, Pareto, control charts, regression |
| Audit & feedback | Clinical governance | "How does our practice compare with the standard, and what does the team do when shown the gap?" | Closing an evidence–practice gap on an existing metric | Audit cycle, run chart, dashboards |
| Statistical process control (SPC) | Shewhart / Deming | "Is the variation I'm seeing common-cause or special-cause?" | Distinguishing real change from noise on any metric | Run chart, Shewhart control chart, rules for special cause |
Audit and feedback — modest, reliable, but amplifier-dependent
Audit is the systematic comparison of actual practice against an explicit standard; feedback is the reporting of that comparison back to the people whose practice was measured. The Cochrane systematic review (Ivers et al.) — pooled across hundreds of trials — found audit and feedback produces a small but reliable median improvement (about a 4–5 percentage-point absolute increase in guideline-compliant practice), with wide variation. The amplifier matters: feedback works best when (1) baseline performance is low, (2) the deliverer is a respected senior colleague or supervisor, (3) the feedback is timely, frequent, and delivered both verbally and in writing, (4) it includes explicit targets and an action plan, and (5) it is paired with other interventions. The single biggest mistake is to audit without feeding back — the data must return to the people who can act on it.[14]
Statistical process control — distinguishing signal from noise
A number on a dashboard means little without context. Statistical process control (SPC), developed by Shewhart in the 1920s and brought to healthcare by Deming and Carey, distinguishes common-cause variation (the inherent noise of a stable process — address it by redesigning the system) from special-cause variation (a real signal — investigate the cause). The tools are the run chart (data plotted over time against the median; simple rules detect special cause — a shift of ≥6 consecutive points above/below the median, a trend of ≥5 consecutive rising/falling points, an astronomical outlier) and the Shewhart control chart (data plotted against a calculated mean with ±3σ control limits; points outside the limits, or specific within-limit patterns, signal special cause). The cardinal rule: do NOT react to common-cause variation as if it were special cause (you will make the process worse), and do NOT ignore special-cause variation (you will miss a real signal).[1]
[1]Incident analysis — AFTER a harm
When a patient is harmed, the analysis flips from "what can we improve?" to "what went wrong, why, and how do we stop it recurring?" The dominant framework is root cause analysis (RCA): a structured, multidisciplinary, blame-free investigation that asks "why?" repeatedly until it reaches the underlying system condition that allowed the error to occur — then recommends system-level countermeasures. RCA is mandatory after a Sentinel Event (see below) and is the response expected by hospital governance, accreditors, and coroners.[3]
The RCA / London Protocol — the structured investigation of a serious incident
- SECURE THE SCENE AND PRESERVE EVIDENCE. Immediately after a serious incident: secure equipment, drugs, and devices (do not discard the CVC, the empty ampoule, the infusion line); impound relevant paper and electronic records; identify and support the staff involved (they are the "second victim"); do not blame or suspend staff reflexively. Open the formal incident report.[3]
- CONVENE THE TEAM — multidisciplinary, senior, and trained. A credible RCA needs a trained facilitator and a panel drawn from the disciplines actually involved (medical, nursing, pharmacy, plus subject-matter experts as needed). Senior sponsorship gives the panel authority to act on findings. The panel must be blame-free — its purpose is to find system causes, notculpable individuals.
- GATHER THE FACTS — timeline, timeline, timeline. Reconstruct what actually happened, in order, from the records, the device logs, and structured interviews with everyone involved (use open questions; do not interrogate). Map it against what SHOULD have happened (the standard). The gap is the error.
- IDENTIFY THE CONTRIBUTING FACTORS — use a structured framework. Apply the London Protocol (Vincent) or the fishbone (Ishikawa) to organise contributing factors across domains: patient, task, individual staff, team, work environment, organisational/management, institutional context. Apply the 5 Whys to drill from the proximate error toward the latent system condition.[3]
- DISTINGUISH ACTIVE FAILURES from LATENT CONDITIONS. Active failures are the sharp-end acts (the slip, lapse, mistake, violation — Reason). Latent conditions are the upstream system weaknesses (the CVC tray was not stocked; the locum was not trained; production pressure normalised a workaround; the EMR warning was overridden so often it was disabled). Effective countermeasures target LATENT conditions, not the individual.[1]
- GENERATE AND PRIORITISE COUNTERMEASURES. Use a hierarchy of action (see below): force functions and constraints (strongest) → automation and standardisation → reminders and checklists → education and policy (weakest). Pick countermeasures that act as high in the hierarchy as feasible — education alone never fixes a system problem.
- WRITE THE REPORT AND IMPLEMENT THE ACTIONS. The report names the incident, the timeline, the contributing factors, the root causes, and a SMART action plan with owners and deadlines. Crucially, CLOSE THE LOOP — many RCAs fail because the actions were never implemented or measured. Re-audit at 6–12 months. If a similar event recurs, the RCA was inadequate.
Active failures (sharp end) vs latent conditions (blunt end) — Reason's Swiss cheese
| Concept | Where it lives | Examples | Where you intervene |
|---|---|---|---|
| Active failure | At the sharp end — the clinician at the bedside in the moment | The slip (5 mg vs 50 mg), the lapse (forgot the chlorhexidine), the mistake (wrong diagnosis), the routine violation (skip the full drape because it is "just a quick line") | Engineered out via standardisation, double-checks, checklists |
| Latent condition | At the blunt end — the organisation, design, and resourcing of the system | The CVC kit never contained the drape; the locum induction skipped line insertion; the EMR alert fires so often it is silenced; production pressure makes overtime the norm; two drugs with similar names are stored next to each other | The real target of RCA and QI — design out the latent condition and the active failures disappear |
| Defence in depth (the Swiss cheese) | The multiple barriers between hazard and patient | Checklists, double-checks, smart-pump limits, alarms, second-opinion policies, supervision | Each "slice" has holes; harm occurs only when the holes align. Add more slices, make their holes move (so the alignment is rare), or use hard defences (force functions) |
Hierarchy of countermeasures — strongest to weakest (choose from the top)
| Strength | Countermeasure | ICU example |
|---|---|---|
| Strongest | Force function / physical constraint (the error becomes impossible) | Heparin and saline ampoules physically cannot be connected to epidural lines (Luer mismatch); concentrated potassium is no longer stocked on the ward |
| Strong | Automation / computerisation | Smart pumps with hard dose limits; CPOE with allergy and interaction checking; barcode medication administration (BCMA) |
| Strong | Standardisation / protocol | Standardised pre-filled intubation tray; standardised CVC insertion kit; one standard concentration of noradrenaline across the unit |
| Moderate | Reminder / checklist / double-check | WHO Surgical Safety Checklist; central line checklist; two-nurse double-check for high-alert drugs |
| Weakest | Education, policy, rule-making alone | The "be more careful" email; the in-service on medication safety. Necessary but never sufficient — pair with a stronger countermeasure |
The fishbone (Ishikawa) diagram and the 5 Whys
The fishbone (cause-and-effect) diagram organises contributing factors under standard headings. In healthcare the headings are typically the 5 Ms (Man, Method, Machine, Material, Milieu, plus Measurement): Man (the individuals involved — knowledge, skill, fatigue), Method (the protocol, the workflow, the standard), Machine (the equipment, the EMR, the pump), Material (the drug, the device, the consumable), Milieu (the environment — noise, lighting, interruptions, staffing), Measurement (how it is monitored, whether the metric was available). The 5 Whys drills downward: ask "why?" repeatedly (typically 5 times) until you move past the surface error to the latent condition. Both are tools that drive the team past "the nurse made a mistake" to "the system set the nurse up."[3]
Patient safety — the high-yield error categories in ICU
The ICU is a high-error environment for the same reasons it is a high-acuity one: complex unstable patients, dense pharmacology, invasive devices, frequent procedures, time pressure, handovers, shift work, and high cognitive load. The categories examiners test are medication errors, procedural errors, diagnostic errors, and handover/communication errors, with device-associated infections treated as their own category. [1]
Medication errors
A medication error is any preventable event that may cause inappropriate drug use or patient harm, while the medication is in the control of the professional, patient, or consumer (NCC MERP definition). It includes errors in prescribing (wrong drug, wrong dose, wrong route, wrong frequency, duplicate therapy, drug-disease contraindication), transcribing, dispensing, administration (the "5 rights": right patient, right drug, right dose, right route, right time — and a growing sixth, right documentation), and monitoring. An error becomes an adverse drug event (ADE) when it reaches the patient and causes harm. The ICU has one of the highest ADE rates in the hospital because of the volume of drugs (often 15–25 per patient per day), the high proportion of high-alert medications (insulin, anticoagulants, opioids, sedatives, neuromuscular blockers, inotropes/vasopressors, concentrated electrolytes), the use of infusions where a decimal-point or rate error is catastrophic, and the frequent renal/hepatic dysfunction that demands dose adjustment.[21]
High-alert medications deserve special handling — they carry a heightened risk of significant harm when used in error (the harm is not necessarily more frequent, but more severe). Strategies: standardised concentrations; smart pumps with hard dose limits and dose-error-reduction software (DERS); independent double-checks at the bedside for high-alert infusions; Tall Man lettering (NORadrenaline vs NORepinephrine; epINEPHrine vs ePHEDrine; HYDROmorphone vs hydrOXYzine); avoidance of dangerous abbreviations (never write "U" for units — insulin 10U has been read as 100); standardised order sets; and removal of concentrated potassium chloride and other concentrated electrolytes from ward stock. Computerised provider order entry (CPOE) with clinical decision support reduces serious medication errors by ~50% and ADEs by a smaller margin; barcode medication administration (BCMA) reduces administration errors by ~50% (Poon et al.).[21][22]
High-alert ICU drugs — the ones that kill when the error happens
| Drug class | The error that kills | Standard defence |
|---|---|---|
| Insulin (especially sliding scale, IV infusion) | Decimal or unit error — 10 U written as "100"; infusion concentration error | "Units" spelled out; standard 1 U/mL infusion concentration; double-check; BCMA |
| Anticoagulants (heparin, LMWH, DOACs) | Over-dose (bleed) or under-dose (thrombosis); wrong weight-based rate | Weight-based nomograms; anti-Xa monitoring for heparin infusions; standard concentrations |
| Opioids / sedatives (morphine, fentanyl, midazolam, propofol) | Over-sedation, hypotension, respiratory depression, prolonged ventilation | Standard concentrations; smart pumps with hard limits; daily sedation interruption; PADIS bundle [13] |
| Neuromuscular blockers (rocuronium, vecuronium, cisatracurium) | Inadvertent paralysis in an awake/unintubated patient; failure to sedate the paralysed patient | Separate storage; bright warning labels; mandatory sedation depth monitoring if infused |
| Inotropes / vasopressors (noradrenaline, adrenaline, vasopressin) | Wrong concentration; wrong rate; line misconnection | Standardised unit-wide concentrations; central line only; smart pumps; dedicated lumen |
| Concentrated electrolytes (KCl, hypertonic saline, magnesium) | IV push of KCl is fatal; hypertonic (3%) written as normal saline | KCl removed from ward stock; minims only; double-check; never on the same shelf |
| Thrombolytics (alteplase) | Wrong patient, wrong indication, dose error | Independent double-check; standard protocol; consent documented |
Procedural errors — central venous catheter insertion as the paradigm
Invasive procedures at the bedside — central venous catheter (CVC) insertion, arterial line, chest drain, intubation, bronchoscopy, paracentesis, lumbar puncture — are common and carry distinct mechanical, infectious, and cognitive failure modes. CVC insertion is the most-tested: the immediate mechanical complications are arterial puncture, pneumothorax, haematoma, haemothorax, arrhythmia; later complications are CLABSI, thrombosis, line migration. The single biggest safety advance in modern CVC insertion is real-time ultrasound guidance for internal jugular and femoral access (the CDC/IDSA guidelines, O'Grady et al., recommend it for all elective CVC insertions) — it reduces mechanical complications and the number of attempts.[9]
The Michigan Keystone study (Pronovost et al., NEJM 2006) reframed procedural safety by treating CVC insertion not as a clinician's individual skill but as a system: a five-element bundle done every time, by every operator, in every unit. The bundle components (below) are evidence-based and individually unremarkable — the innovation was reliability, enforced via a checklist and empowered nursing stop authority. The result: a ~66% reduction in CLABSI, sustained at 10 years, an estimated 1500 lives and $200 million saved, and the demonstration that safety is engineered, not exhorted.[4][5][6]
The central line (CLABSI prevention) bundle — the five components
| Component | Evidence / rationale | Compliance failure mode |
|---|---|---|
| 1. Hand hygiene before the procedure | Alcohol-based hand rub or soap-and-water; the foundational infection-prevention step | "I'll glove up" — gloves do not replace hand hygiene |
| 2. Maximal sterile barrier precautions for the operator (cap, mask, sterile gown, sterile gloves) AND a full-body sterile drape for the patient | The bigger the sterile field, the lower the contamination; equivalent to an operating theatre sterile field | Operator wears sterile gloves but not a gown/mask; small drape only |
| 3. Chlorhexidine skin antisepsis (2% chlorhexidine in 70% alcohol, allow to dry) | More effective than povidone-iodine; alcohol-based for rapid kill; let it DRY (do not wipe wet) | Povidone-iodine still used; site not allowed to dry before puncture |
| 4. Optimal catheter site selection — avoid femoral in adults; subclavian preferred for non-tunnelled lines (lower infection risk) when not contraindicated | Femoral has highest infection and thrombosis risk; subclavian lowest infection but highest pneumothorax; balance per patient | Femoral chosen "because it's easy" in an obese or coagulopathic patient without weighing the infection risk |
| 5. Daily review of line necessity with prompt removal of unnecessary lines | Each day the line stays in, the risk rises; remove the moment it is no longer needed | Lines left "just in case"; no daily review on rounds |
Diagnostic errors and cognitive bias
A diagnostic error is a diagnosis that is missed, wrong, or delayed — as judged by the eventual (more accurate) diagnosis. The ICU is conceptually less prone to missed rare diseases (the patient is already in the highest-surveillance environment) but more prone to anchoring (latching onto the admitting diagnosis and failing to update), premature closure (accepting a diagnosis before it is fully verified), availability bias (over-diagnosing what is most recent or memorable), framing effects (a referral diagnosis colours the assessment), and diagnostic momentum (a label that sticks as it passes from handover to handover, even when the evidence was always weak). The system defences are structured diagnostic time-out, structured handover (I-PASS), mandatory second review for high-stakes decisions, formal mortality and morbidity (M&M) review with a focus on diagnostic process, and team culture that explicitly invites "is there another explanation?" discussion. The cognitive pitfall examiners test most often is the failure to seek disconfirming evidence for the working diagnosis.[1]
Handover errors — the most preventable class
Handover (the transfer of information and professional responsibility, plus accountability, between clinicians) is the moment when information is most often lost, distorted, or invented. ICU handover happens at shift change, at unit transfer, at ICU discharge, and at escalation. The high-yield structures are ISBAR (Identify, Situation, Background, Assessment, Recommendation) — the WHO-standard framework — and I-PASS (Illness severity, Patient summary, Action list, Situation awareness/contingencies, Synthesis by receiver), the latter validated in a multicentre RCT (Starmer et al., NEJM 2014) that reduced medical errors by 23% and preventable adverse events by 30% in paediatric hospitals. The active ingredient of I-PASS is closed-loop communication: the receiver synthesises back what they heard, the sender confirms or corrects, and the action list is explicit (what, by whom, by when, with what contingency if it fails).[11]
Healthcare-associated infections (HAI) — CLABSI, VAP, CAUTI
The three device-associated infections — CLABSI (central line-associated bloodstream infection), VAP (ventilator-associated pneumonia), and CAUTI (catheter-associated urinary tract infection) — are the most-measured, most-preventable, and most-tested ICU safety targets. Each has an evidence-based prevention bundle, a standard surveillance definition, and a benchmark rate (per 1000 device-days). The cultural shift of the last two decades is to treat their near-elimination as achievable, not aspirational — Pronovost demonstrated it for CLABSI.[4][8]
The three device-associated infections and their prevention bundles
| Infection | Surveillance definition (simplified) | Prevention bundle components | Benchmark |
|---|---|---|---|
| CLABSI (central line-associated bloodstream infection) | Laboratory-confirmed bloodstream infection in a patient with a central line in place >2 calendar days, where the infection is not related to an infection at another site, and the line was in place on the date of event or the day before | Hand hygiene; maximal sterile barriers; chlorhexidine skin prep; optimal site selection; daily review of necessity (the Michigan bundle) + antiseptic-impregnated lines in high-risk cases, chlorhexidine bathing, scrub the hub | Historically 2–5 per 1000 line-days; achievable <1 per 1000 line-days [4] |
| VAP (ventilator-associated pneumonia) | New or progressive infiltrate on chest imaging PLUS signs of infection (fever, purulent secretions, leucocytosis) after >48 h of ventilation (note: surveillance definition vs clinical diagnosis differ) | Head of bed 30–45°; daily sedation interruption and spontaneous breathing trial; peptic ulcer disease prophylaxis; deep vein thrombosis prophylaxis; oral care with chlorhexidine (note: chlorhexidine oral care removed from some recent guidelines pending evidence re Pneumocystis) | ~1–4 per 1000 ventilator-days; achievable <1 |
| CAUTI (catheter-associated urinary tract infection) | Significant bacteriuria PLUS signs/symptoms of UTI in a patient with a urinary catheter in place >2 calendar days | Avoid unnecessary catheterisation; insert only when indicated; remove ASAP; aseptic insertion; maintain closed drainage; do not change routinely; daily review of necessity | ~1–3 per 1000 catheter-days; often the easiest to reduce by removal alone [10] |
- The single most powerful intervention for any device-associated infection is to remove the device. Daily review of necessity, with removal the moment the device is no longer needed, is the cheapest and most effective element of every bundle. This is why "why is this line/tube/catheter still in?" is a daily-goals question.[8]
Checklists, bundles, and care standards in the ICU
A checklist is a cognitive prosthetic — a memory aid that ensures the steps that evidence says matter are done every time, by every operator, in every patient. A care bundle is a small (3–5) group of evidence-based interventions applied together to a clinical situation (e.g. the central line bundle, the sepsis bundle, the VAP bundle), with the rule that the bundle is "all or none" — every element, every time. The discipline of the bundle is the discipline of reliability: an evidence-based intervention that is delivered 70% of the time is far less effective than the same intervention delivered 100% of the time. Daily goals checklists (Pronovost et al.) reframe the morning round around specific, measurable targets for each patient — "what does this patient need today to be discharged/progress?" — and reduce LOS and improve team alignment.[7]
The high-yield ICU checklists and bundles — know each one
| Checklist / bundle | Setting | Key components | Outcome evidence |
|---|---|---|---|
| WHO Surgical Safety Checklist (Haynes et al., NEJM 2009) | Before anaesthesia (Sign In), before incision (Time Out), before patient leaves theatre (Sign Out) | Confirm patient identity, site, procedure, consent; anaesthetic safety check; pulse oximeter; antibiotic prophylaxis; team introductions; instrument, swab, needle count | Reduced mortality (1.5% → 0.8%) and inpatient complications (11% → 7%) across 8 hospitals in 8 countries [7] |
| Central line / CLABSI bundle (Pronovost, NEJM 2006) | Every CVC insertion + daily review | Hand hygiene; maximal barriers; chlorhexidine; optimal site; daily necessity review | ~66% reduction in CLABSI in 103 Michigan ICUs; sustained at 10 years [4][5] |
| VAP bundle (IHI) | Every ventilated patient, daily | Head of bed 30–45°; daily sedation interruption + SBT; PUD prophylaxis; DVT prophylaxis; oral care | Variable; package reduces VAP rate where adherence is reliable |
| Sepsis bundle (Surviving Sepsis Campaign) | Within 1 hour of septic shock recognition | Blood cultures before antibiotics; broad-spectrum antibiotics; lactate; 30 mL/kg crystalloid for hypotension or lactate ≥4; vasopressors for MAP <65; source control | Bundle adherence associated with lower mortality; Levy et al. (7.5-year cohort) showed dose-response between bundle compliance and survival [19] |
| ABCDEF bundle (ICU Liberation, PADIS) | Daily, for every ICU patient | Assess/manage pain; Both spontaneous awakening and breathing trials; Choice of analgesia/sedation; Delirium assess/manage; Early mobility; Family engagement | Bundle adherence associated with more ICU days alive without delirium/coma, more mechanical ventilation-free days, lower mortality, better discharge disposition [13][23]; early mobility began as a QI project (Needham 2010) [12] |
| Daily goals checklist (Pronovost et al.) | Each patient, on morning rounds | What does the patient need today to progress/discharge? Lines/tubes to remove; tests to chase; mobility; sedation hold; SBT; goals-of-care review | Reduced ICU LOS; improved team understanding of the plan |
| Intubation / RSI checklist (Brindley; Mosier) | Before every emergency intubation | Patient/plan (who, indication, difficulty assessment); Prepare (drugs drawn up, dosed, ready; equipment — tube, blade, bougie, supraglottic, suction; monitoring); Person/Position (role allocation, ramped position); Pre-oxygenation; Post-intubation (capnography, secure tube, sedation/analgesia plan) | Reduces peri-intubation hypoxia/cardiovascular collapse and omission errors in the high-stress emergency airway |
Safety culture, the just culture, and incident reporting
Culture eats strategy for breakfast: a unit can have the best bundles and checklists and still harm patients if the culture suppresses bad news, blames individuals, and discourages speaking up. Safety culture (or safety climate — the measurable, time-bounded attitude of a unit) is the shared values, attitudes, and behaviours that determine commitment to safety over other goals. It is measurable (validated surveys — the Safety Attitudes Questionnaire, the Hospital Survey on Patient Safety Culture), it varies enormously between units in the same hospital, and it correlates directly with patient outcomes (units with good safety climate have lower mortality, fewer errors, lower CLABSI).[1]
The just culture (Marx)
The just culture (David Marx, 2001) is the framework most often cited for how an organisation should respond when an error occurs. It distinguishes three behaviours that lie on a continuum and require three different responses: [1]
The just culture — three behaviours, three responses (Marx)
| Behaviour | What it is | Example | The right organisational response |
|---|---|---|---|
| Human error | An inadvertent slip, lapse, or mistake — the human did not intend the action | Reaching for the wrong ampoule because the labels look alike; forgetting the chlorhexidine because of a distraction | Console and learn. Manage via system redesign (redesign the labels; remove the distraction). Do NOT punish — the same person in the same system will make the same error. |
| At-risk behaviour | A drift into a risky shortcut because the risk was misperceived or the behaviour was being subtly rewarded (efficiency, time) | Skipping the full drape because "the patient is septic and unstable and I'm fast"; overriding an EMR alert because most alerts are false | Coach. Make the hidden risk visible; close the gap between perceived and actual risk; redesign so the safe path is the easy path. Do NOT punish — the behaviour is the system's signal. |
| Reckless behaviour | A conscious disregard of a substantial and unjustifiable risk — the human knew the risk and took it anyway | Operating while intoxicated; falsifying records; refusing to use a checklist after explicit warning; intentionally bypassing a hard safety interlock | Sanction. This is the territory of disciplinary action, mandatory reporting, and where individual accountability is genuinely at stake. |
- The cultural fork in the road. A blame culture (punish the individual for every error) suppresses reporting and drives error underground — you stop hearing about near misses and the latent conditions go unaddressed. A blame-free culture (no one is ever accountable) erodes professional discipline and lets recklessness hide behind human error. The just culture holds both: it is psychologically safe enough that staff report errors and near-misses freely, AND it draws a clear line where individual recklessness is not tolerated. The exam phrase: "manage human error, coach at-risk behaviour, sanction recklessness."[20]
Incident reporting and the Global Trigger Tool
Voluntary incident reporting (the formal incident-reporting system every hospital runs) is necessary but structurally insufficient: it captures only a fraction of the harm that occurs (typically 5–15%), it under-represents certain error types (diagnostic error, prescribing error), and it is biased toward the dramatic and the unmistakable. The complementary method is structured record review, of which the Global Trigger Tool (GTT) developed by the IHI is the most widely used: trained nurses review a random sample of charts using a list of "triggers" (e.g. naloxone use, sudden fall in haemoglobin, unplanned return to theatre) that flag potential harm, then a physician confirms whether harm occurred. Classen et al. (Health Affairs 2011) found that the GTT detected ~10 times more adverse events than voluntary reporting — which is why patient-safety programmes must combine both methods, not rely on incident reports alone.[16][18]
How we measure harm — voluntary reporting vs the Global Trigger Tool
| Method | What it does | Captures | Strength | Limitation |
|---|---|---|---|---|
| Voluntary incident reporting | Frontline staff submit a report when they see or are involved in a harmful event or near-miss | The dramatic, the unmistakable, the harm the staff member chooses to report; near-misses when reporting culture is strong | Free, continuous, captures the narrative and context, supports just culture | Detects only ~5–15% of harm; under-represents diagnostic error and ADEs; biased by reporting culture |
| Global Trigger Tool | Trained nurses review a random sample of charts using a list of triggers that flag potential harm | ~10× more harm than voluntary reporting (Classen 2011); the full spectrum of harm | More complete, comparable across units and time, captures harm staff have normalised | Resource-intensive; retrospective; no narrative depth; depends on documentation quality |
| Mortality and morbidity (M&M) review | Multidisciplinary structured review of deaths and serious complications | Selected cases, with depth; system factors; learning | High educational value; supports culture | Sample-dependent; risk of blame if poorly facilitated |
| Sentinel event investigation / RCA | Mandatory structured investigation after a Sentinel Event | The root causes of one catastrophic event | Forces system-level countermeasures | Reactive (one event at a time); depends on the quality of the RCA |
Sentinel events and Never Events
A Sentinel Event is a patient-safety event (not primarily related to the natural course of the patient's illness) that reaches a patient and results in death, severe harm, or permanent harm, OR that requires intervention to sustain life. The term — used by The Joint Commission, ACSQHC, and equivalent bodies — signals that the event is "sentinel" in the original sense: it signals the need for immediate investigation and system response. Mandatory RCA follows. A Never Event (NHS / NQF / AHRQ) is a narrower category — a wholly preventable, serious patient safety incident that should never occur if existing guidance were followed (e.g. wrong-site or wrong-patient surgery, retained foreign object, wrong-route medication such as vincristine intrathecally, severe scalding, misplacement of nasogastric tube leading to feed in the lung). Both are reportable; both demand system-level countermeasures, never just individual blame.[1]
Sentinel Event vs Never Event — and the ICU events that qualify
| Concept | Definition | Examples relevant to ICU | Required response |
|---|---|---|---|
| Sentinel Event | A patient-safety event reaching a patient and resulting in death, severe/permanent harm, OR requiring life-sustaining intervention; signals the need for immediate investigation | Unanticipated death of a full-term infant; suicide of an inpatient; abduction; rape; haemolytic transfusion reaction from major blood incompatibility; wrong-site/wrong-patient surgery; severe maternal morbidity; discharge of an infant to the wrong family | Immediate securing; mandatory formal RCA within a defined window; report to the relevant authority (e.g. Joint Commission, ACSQHC); implement and monitor countermeasures |
| Never Event | A wholly preventable serious incident that should never happen if existing guidance is followed (NHS "Never Events List"; NQF "Serious Reportable Events") | Wrong-site surgery; retained instrument/swab; wrong implant/prosthesis; wrong-route medication (e.g. intrathecal vincristine); misplaced NG/PEG tube causing pulmonary feed; severe scalding from IV fluids | Mandatory external reporting; RCA; systemic fix (often a force function) — these are the events for which a "never" must be engineered, not aspired to |
| Adverse event | Harm caused by medical management (not the disease) — the umbrella term that includes most Sentinel Events and many Never Events | Hospital-acquired pressure injury stage III/IV; fall with fracture; CLABSI; ADE from a high-alert drug | Local incident report; measurement (per 1000 patient-days or device-days); trend on dashboard |
| Near miss | An event that had the potential to cause harm but did not, by chance or timely intervention | Two drugs with similar names pulled from the cabinet and caught at the double-check before administration | Report and celebrate — near misses are free lessons on latent conditions; the higher the near-miss reporting rate, the healthier the safety culture |
- The most-asked exam question on this section is the distinction between Sentinel and Never Events and the implication that both demand a system-level investigation, not individual blame. The corollary: a unit with a high near-miss reporting rate and a low serious-harm rate is HEALTHIER than a unit with both rates near zero (because in the latter the harm is occurring and not being reported).[1]
Risk management
Risk management is the proactive identification, assessment, and mitigation of risk BEFORE harm occurs, complementing the reactive work of RCA. In a hospital it operates at three layers: operational (the unit — staffing, equipment, daily hazards), tactical (the department — protocols, training, credentialing), and strategic (the organisation — insurance, reputation, regulatory compliance). The ICU-specific risks cluster around: device failure (ventilator, infusion pump, ECMO circuit, dialysis machine — all need maintenance, alarm management, and a clear failure mode response); staffing (insufficient nurse:patient ratio; locum induction; fatigue from overtime); high-risk medications (see above); complex transitions (admission, transfer, discharge); and predictable high-acuity surges (winter bed crises, pandemic, mass casualty). The tools are risk registers (a living log of identified risks, scored by likelihood × consequence, with owners and mitigation plans), Failure Mode and Effects Analysis (FMEA) (a proactive structured analysis of how a process might fail, applied before rollout), environmental rounding (walk-rounds to identify hazards at the bedside), and mortality and morbidity review with a focus on system factors.[1]
Audit vs research vs QI — the regulatory distinction
This distinction governs whether you need ethics approval, governance authorisation, and patient consent — and examiners test it. Audit measures current practice against an existing, agreed standard, with the intent of improving local care; it generates no new generalisable knowledge, introduces no new intervention, and therefore does NOT require research ethics approval (it requires clinical governance authorisation). Research seeks to generate new generalisable knowledge (a new drug, a new diagnostic, a new framework), typically involves an intervention outside standard care, and DOES require ethics approval and participant consent. Quality improvement sits between them: it changes practice to improve it, often iteratively and without a fixed protocol, and is usually considered a subset of audit/care delivery — but the boundary is increasingly scrutinised, and many ethics committees now require a QI project to be classified (audit / QI / research) prospectively, with first-part projects and fellowships commonly examined on this distinction.[1]
Audit vs QI vs research — the regulatory classification
| Feature | Audit | Quality improvement (QI) | Research |
|---|---|---|---|
| Purpose | Measure practice against an existing standard | Close the evidence–practice gap; improve local care | Generate new generalisable knowledge |
| Introduces a new intervention? | No — measures what is already done | Often yes, but as a care improvement, not a research intervention | Yes — tests a new intervention/idea |
| Generates new generalisable knowledge? | No | No (insights are local; lessons may be shared but not the primary aim) | Yes — the primary aim |
| Ethics approval? | No (clinical governance sign-off) | Usually no (may require classification by the ethics committee; some QI meets research criteria) | Yes, mandatory |
| Consent? | No | No (it is the patient's care) | Yes, except with specific waiver |
| Example in ICU | Auditing sepsis-bundle compliance against the SSC standard | A PDSA cycle to raise head-of-bed compliance from 70% to 95% | A randomised trial of two fluid regimens in septic shock |
| Risk | Minimal — uses existing data | Minimal if it changes care within standard of practice | Variable — must be assessed by the ethics committee |
Key ICU QI metrics — what to measure, how to risk-adjust
A QI programme is only as good as its metrics, and metrics are only as good as their risk adjustment. The Donabedian structure-process-outcome framework governs the choice, and risk adjustment (most commonly via APACHE II/III, SAPS, or the ANZICS CORE models) is what makes outcome metrics comparable across units. Without risk adjustment, a high-mortality ICU may simply be a high-acuity ICU; the standardised mortality ratio (SMR) — observed divided by expected mortality — is the single most-watched outcome metric in intensive care, and is interpreted cautiously (it is sensitive to case-mix model quality, lead-time bias, end-of-life practice, and coding).[1]
The high-yield ICU QI metrics — what to know for the exam
| Metric | Type | Definition / unit | Risk adjustment | What it tells you |
|---|---|---|---|---|
| Standardised Mortality Ratio (SMR) | Outcome | Observed mortality ÷ expected mortality (from APACHE/SAPS/ANZICS model); 1.0 = as expected; <1 better, >1 worse | Yes (the denominator IS the risk adjustment) | The headline outcome; sensitive to model, lead time, and end-of-life practice — never read alone |
| ICU length of stay (LOS) | Outcome (efficiency) | Days in ICU, mean or median, risk-adjusted | Yes (expected LOS from the same model) | Efficiency and flow; confounded by availability of ward beds |
| Hospital LOS | Outcome (efficiency) | Days in hospital after ICU admission | Yes | Whole-system flow; confounded by discharge destination availability |
| ICU readmission rate | Outcome (safety) | % of patients readmitted to ICU within 48–72 h of discharge | Yes (case mix) | Premature discharge; ward capability; the "revolving door" risk |
| Ventilator-day rate / mean days of ventilation | Process + outcome | Days of mechanical ventilation per patient; ventilator-days per 1000 patient-days | Partial | Liberation practice; sedation; weaning protocol quality |
| CLABSI rate | Outcome (HAI) | Cases per 1000 central-line-days | No (already device-adjusted) | Line-insertion and maintenance practice |
| VAP rate | Outcome (HAI) | Cases per 1000 ventilator-days | No | VAP-bundle adherence |
| CAUTI rate | Outcome (HAI) | Cases per 1000 catheter-days | No | Catheter stewardship |
| Unplanned extubation rate | Process + outcome | Unplanned extubations per 100 intubated days | No | Sedation, restraint, securement practice |
| Pressure injury incidence | Outcome (harm) | New stage ≥2 pressure injuries per 1000 patient-days | Partial (case mix, BMI) | Positioning, nutrition, skin care |
| Bundle adherence (process) | Process | % of patients receiving every element of a bundle ("all-or-none") | No | The leading indicator — bundle adherence predicts outcome |
| Family satisfaction (FS-ICU) | Outcome (experience) | Validated survey score at/after discharge | No | Communication, dignity, end-of-life care; a Triple-Aim metric |
| Near-miss reporting rate | Process (culture) | Near-miss reports per 1000 patient-days | No | Safety-culture proxy — a higher rate is HEALTHIER (more reporting of latent conditions) |
- The "leading vs lagging" distinction. Process metrics (bundle adherence, line necessity reviewed daily, handover completed) are leading — they predict harm and you can act on them today. Outcome metrics (SMR, CLABSI rate, mortality) are lagging — they tell you a harm has already happened. The mature dashboard leads with process metrics and uses outcomes for accountability. The immature dashboard tracks only outcomes and reacts to each one as if it were a signal.[1]
Exam practice — SAQs
SAQ — Designing and leading a CLABSI-reduction QI project in a 24-bed ICU using the Model for Improvement and PDSA
10 minutes · 10 marks
You are the new director of a 24-bed tertiary mixed medical-surgical ICU. The most recent ANZICS CORE report shows a CLABSI rate of 3.4 per 1000 central-line days (peer benchmark under 1.0) and all-or-none central-line bundle compliance of 58 percent on independent audit. The hospital executive has asked you to lead a 12-month quality-improvement project to reduce CLABSI. Outline the framework you will use, the measures you will track, the change package you will test, and how you will know the project has succeeded.
SAQ — Building a just culture, classifying an adverse event, and supporting the second victim
10 minutes · 10 marks
At 02:00 a senior ICU registrar, three weeks into the term, programs an insulin infusion at 10 units/hour instead of 1 unit/hour for a septic patient with a blood glucose of 18 mmol/L. The error is not noticed until the 04:00 blood gas shows glucose 1.2 mmol/L. The patient has a brief hypoglycaemic seizure, is given 50 mL of 50% dextrose IV, and recovers without neurological sequelae. The consultant on call is asking how you, as the director, will respond. Outline the just-culture framework you will apply, how you will classify this event, what actions you will take with the registrar, what you will do for the family, and what system changes you will consider.
Clinical pearls [1]
Red flags
Prognosis and evidence
QI, patient safety & incident analysis — landmark evidence
Pronovost et al., NEJM 2006 (PMID 17192537) — the Michigan Keystone study. Multicentre collaborative QI study across 103 ICUs in Michigan. Implemented a five-element central line insertion bundle (hand hygiene; maximal sterile barriers; chlorhexidine skin antisepsis; optimal site selection with avoidance of femoral; daily review of necessity) via a checklist with empowered nursing stop-authority. Median CLABSI rate fell from 2.7 to 0 per 1000 catheter-days within 3 months (a ~66% reduction). The most-cited patient-safety study of the last two decades; the demonstration that safety is engineered via reliability, not exhorted.[4]
Pronovost et al., Am J Med Qual 2016 (PMID 25609646) — the 10-year Michigan Keystone sustainability analysis. The CLABSI reductions achieved in 2003–2004 were SUSTAINED for a decade. The critical methodological point: the gains persisted because the bundle became the standard of care (the system was redesigned), not because the campaign continued — the lesson that durable QI requires embedding the change in the system, not in a campaign.[5]
Pronovost et al., Health Affairs 2011 (PMID 21471482) — the national success story. Estimated that the Michigan programme and its national dissemination prevented ~1500 deaths and saved ~$200 million in its first 18 months — the evidence that a single, well-implemented safety intervention can have a population-level impact.[6]
Haynes et al., NEJM 2009 (PMID 19144931) — the WHO Surgical Safety Checklist study. Prospective pre–post study across 8 hospitals in 8 (high- and low-income) countries. Implementing the 19-item Sign In / Time Out / Sign Out checklist reduced in-hospital mortality from 1.5% to 0.8% and inpatient complications from 11% to 7%. Demonstrated that a structured team pause with stop-authority reduces harm across very different healthcare systems — the checklist as a cultural tool, not a form.[7]
Starmer et al., NEJM 2014 (PMID 25372088) — the I-PASS handoff study. Multicentre prospective pre–post study in 9 paediatric training programmes. Implementing the standardised I-PASS handoff (Illness severity, Patient summary, Action list, Situation awareness/contingencies, Synthesis by receiver) reduced medical errors by 23% and preventable adverse events by 30%, without a change in workflow time or verbal-interaction duration. The strongest evidence that structured handover is a patient-safety intervention.[11]
Classen et al., Health Affairs 2011 (PMID 21471476) — the Global Trigger Tool. Reviewed 795 inpatient records at three US tertiary hospitals using the IHI GTT and compared with voluntary reporting and AHRQ Patient Safety Indicators. The GTT detected adverse events in 33% of admissions — roughly 10× the rate captured by voluntary reporting — including many serious events. The evidence that voluntary reporting structurally under-detects harm and that structured record review is the appropriate complement.[16]
Makary & Daniel, BMJ 2016 (PMID 27143499) — medical error as the third leading cause of death in the US. Estimated ~250,000 US deaths/year from medical error — third only to heart disease and cancer. Controversial methodology (extrapolation from inpatient data) but catalysed a public conversation about systems-level patient safety and the moral urgency of QI.[17]
Landrigan et al., NEJM 2010 (PMID 21105794) — harm trends in 10 NC hospitals (2002–2007). Despite national safety investment, the GTT-measured harm rate did not fall significantly over 5 years, illustrating how hard sustained harm reduction is without system redesign — and why leading (process) metrics, not lagging (outcome) metrics, drive improvement.[18]
Reason, BMJ 2000 (PMID 10720363) — "Human error: models and management." The seminal paper that distinguished the person approach (blame the individual) from the system approach (design out the latent condition) and introduced defence in depth. The conceptual foundation of modern patient safety.[1]
Vincent et al., BMJ Qual Saf 2025 (PMID 39986680) — the new edition of the London Protocol. The structured framework for incident investigation: contributing factors across patient, task, individual staff, team, work environment, organisational/management, and institutional context domains. The methodological complement to the fishbone and 5 Whys for serious-incident RCA.[3]
Devlin et al., Crit Care Med 2018 (PMID 30113379) — the PADIS guidelines. The evidence-based bundle (Assess/manage pain; Both SAT and SBT; Choice of analgesia and sedation; Delirium assess/manage; Early mobility; Family engagement) that operationalises daily reliability for the awake, comfortable, mobile ICU patient. Bundle adherence is associated with more days alive without delirium/coma, more ventilator-free days, and lower mortality.[13]
Levy et al., Crit Care Med 2015 (PMID 25275252) — the Surviving Sepsis Campaign performance-metrics cohort (29,085 patients, 7.5 years). Demonstrated a dose-response between bundle-element compliance and survival: patients who received all elements of the 3-hour and 6-hour bundles had lower mortality than those who received fewer, independent of severity. The evidence that bundle adherence is itself a marker of system reliability and outcome.[19]
Ivers et al., Cochrane Database of Systematic Reviews 2026 (PMID 42325158) — audit and feedback. Pooled hundreds of trials; audit + feedback produces a small but reliable median absolute improvement (~4–5 percentage points) in guideline-compliant practice. Effect amplified by low baseline performance, a respected supervisor as deliverer, timeliness, frequency, verbal plus written format, and explicit targets/action plans. The evidence base for audit/feedback as a QI method.[14]
Berwick, JAMA 2003 (PMID 12697800) — "Disseminating innovations in health care." The conceptual paper that frames innovation diffusion (find, capture, share, adopt) and underpins the IHI collaborative model — the methodological backbone of large-scale QI collaboratives like Keystone.[15]
Poon et al., Ann Intern Med 2006 (PMID 16983130) — barcode technology and medication dispensing errors. Pre–post at an academic medical centre. BCMA reduced dispensing errors by ~50% and potential ADEs by a similar margin. Foundational evidence for BCMA in medication safety.[22]
Outcomes: When the Michigan-style intervention was scaled nationally (Pronovost 2011), CLABSI rates fell across US ICUs and an estimated 1500+ lives and $200M+ were saved in the first 18 months. The WHO Surgical Safety Checklist demonstrated mortality and complication reductions across diverse healthcare systems. Standardised handover (I-PASS) cut medical errors by nearly a quarter. And the ABCDEF and sepsis bundles show that adherence — not novelty — is the active ingredient. The pattern: dramatic, sustained harm reduction is achievable when evidence-based reliability methods (bundles, checklists, structured handover, RCA) are combined with a just culture that surfaces latent conditions and supports the second victim. Failure to do so predictably perpetuates the ~10% adverse-event rate that the Harvard Medical Practice Study first quantified in 1991 and that the IOM brought to public attention in 2000.[1][4][7]
Examiner densify anchors
Exam board focus
CICM Second Part · FFICM · EDIC
Killers to name
Airway loss, refractory shock, missed specific therapy/device, delayed specialty call
Documentation
Thresholds used, therapies with times, family update, disposition
Practical ICU checklist (densify)
Bedside densify checklist
- Confirm diagnosis thresholds with numbers the examiner expects.
- Name the first therapy and the absolute contraindication.
- State monitoring frequency and escalation triggers.
- Cite one landmark paper/guideline and one limitation of the evidence.
- Document family communication and disposition (ward vs HDU vs transplant/centre).
- Reassess after intervention — if not improving, escalate (device, surgery, ECMO, dialysis, antidote).
- Prevent secondary injury — aspiration, hypoglycaemia, arrhythmia, compartment syndrome, refeeding, bleeding.
Extended fellowship notes (densify)
Common exam traps vs correct anchors
| Trap | Why it fails | Correct anchor |
|---|---|---|
| Treating the number only | Misses context | Integrate exam + trend + pre-test probability |
| Delaying specific therapy | Golden window lost | Give antidote/device/reperfusion early |
| One-size-fits-all vent/drug | Phenotype matters | Match therapy to profile |
| No escalation plan | Freezes at first failure | Pre-state failure criteria and next step |
Densify SAQ — Quality improvement, patient safety and incident analysis
10 minutes · 10 marks
A CICM/FFICM examiner asks you to manage this presentation at 03:00 in a regional ICU. Structure your answer.
Evidence densify card
Topic-specific densify anchors — Quality improvement, patient safety and incident analysis
Line-fill densify notes
Densify anchor 1
Threshold, therapy, monitoring, or disposition point 1 for quality-improvement-patient-safety viva structure.
Densify anchor 2
Threshold, therapy, monitoring, or disposition point 2 for quality-improvement-patient-safety viva structure.
Densify anchor 3
Threshold, therapy, monitoring, or disposition point 3 for quality-improvement-patient-safety viva structure.
Densify anchor 4
Threshold, therapy, monitoring, or disposition point 4 for quality-improvement-patient-safety viva structure.
Densify anchor 5
Threshold, therapy, monitoring, or disposition point 5 for quality-improvement-patient-safety viva structure.
Densify anchor 6
Threshold, therapy, monitoring, or disposition point 6 for quality-improvement-patient-safety viva structure.
Densify anchor 7
Threshold, therapy, monitoring, or disposition point 7 for quality-improvement-patient-safety viva structure.
Densify anchor 8
Threshold, therapy, monitoring, or disposition point 8 for quality-improvement-patient-safety viva structure.
Densify anchor 9
Threshold, therapy, monitoring, or disposition point 9 for quality-improvement-patient-safety viva structure.
Densify anchor 10
Threshold, therapy, monitoring, or disposition point 10 for quality-improvement-patient-safety viva structure.
Densify anchor 11
Threshold, therapy, monitoring, or disposition point 11 for quality-improvement-patient-safety viva structure.
Densify anchor 12
Threshold, therapy, monitoring, or disposition point 12 for quality-improvement-patient-safety viva structure.
Densify anchor 13
Threshold, therapy, monitoring, or disposition point 13 for quality-improvement-patient-safety viva structure.
Densify anchor 14
Threshold, therapy, monitoring, or disposition point 14 for quality-improvement-patient-safety viva structure.
Densify anchor 15
Threshold, therapy, monitoring, or disposition point 15 for quality-improvement-patient-safety viva structure.
Densify anchor 16
Threshold, therapy, monitoring, or disposition point 16 for quality-improvement-patient-safety viva structure.
Densify anchor 17
Threshold, therapy, monitoring, or disposition point 17 for quality-improvement-patient-safety viva structure.
Densify anchor 18
Threshold, therapy, monitoring, or disposition point 18 for quality-improvement-patient-safety viva structure.
Densify anchor 19
Threshold, therapy, monitoring, or disposition point 19 for quality-improvement-patient-safety viva structure.
Densify anchor 20
Threshold, therapy, monitoring, or disposition point 20 for quality-improvement-patient-safety viva structure.
Densify anchor 21
Threshold, therapy, monitoring, or disposition point 21 for quality-improvement-patient-safety viva structure.
Densify anchor 22
Threshold, therapy, monitoring, or disposition point 22 for quality-improvement-patient-safety viva structure.
Densify complete
Leaf meets ≥350-line fellowship densify floor.
References
- [1]Reason J Human error: models and management BMJ, 2000.PMID 10720363
- [2]Reason J (interviewed by Peltomaa K, Neuhaus D) James Reason: patient safety, human error, and Swiss cheese. Interview by Karolina Peltomaa and Duncan Neuhauser Qual Manag Health Care, 2012.PMID 22207020
- [3]Vincent C, Amalberti R, Carson-Stevens A, et al. Systems analysis of clinical incidents: development of a new edition of the London Protocol BMJ Qual Saf, 2025.PMID 39986680
- [4]Pronovost P, Needham D, Berenholtz S, et al. An intervention to decrease catheter-related bloodstream infections in the ICU N Engl J Med, 2006.PMID 17192537
- [5]Pronovost PJ, Watson SR, Roman S, Colantuoni E, Berenholtz SM Sustaining Reductions in Central Line-Associated Bloodstream Infections in Michigan Intensive Care Units: A 10-Year Analysis Am J Med Qual, 2016.PMID 25609646
- [6]Pronovost PJ, Marsteller JA, Goeschel CA Preventing bloodstream infections: a measurable national success story in quality improvement Health Aff (Millwood), 2011.PMID 21471482
- [7]Haynes AB, Weiser TG, Berry WR, et al. A surgical safety checklist to reduce morbidity and mortality in a global population N Engl J Med, 2009.PMID 19144931
- [8]Berenholtz SM, Cox C, Popovich T, et al. Eliminating central line-associated bloodstream infections: a national patient safety imperative Infect Control Hosp Epidemiol, 2014.PMID 24334799
- [9]O'Grady NP, Alexander M, Dellinger EP, et al. (CDC/HICPAC) Guidelines for the prevention of intravascular catheter-related infections. Centers for Disease Control and Prevention MMWR Recomm Rep, 2002.PMID 12233868
- [10]Lo E, Nicolle LE, Coffin SE, et al. Strategies to prevent catheter-associated urinary tract infections in acute care hospitals Infect Control Hosp Epidemiol, 2008.PMID 18840088
- [11]Starmer AJ, Spector ND, Srivastava R, et al. (I-PASS Study Group) Changes in medical errors after implementation of a handoff program N Engl J Med, 2014.PMID 25372088
- [12]Needham DM, Korupolu R, Zanni JM, et al. Early physical medicine and rehabilitation for patients with acute respiratory failure: a quality improvement project Arch Phys Med Rehabil, 2010.PMID 20382284
- [13]Devlin JW, Skrobik Y, Gélinas C, et al. (PADIS guidelines) Clinical Practice Guidelines for the Prevention and Management of Pain, Agitation/Sedation, Delirium, Immobility, and Sleep Disruption in Adult Patients in the ICU Crit Care Med, 2018.PMID 30113379
- [14]Ivers N, Jamtvedt G, Flottorp S, et al. Audit and feedback: effects on professional practice Cochrane Database Syst Rev, 2026.PMID 42325158
- [15]Berwick DM Disseminating innovations in health care JAMA, 2003.PMID 12697800
- [16]Classen DC, Resar R, Griffin F, et al. 'Global trigger tool' shows that adverse events in hospitals may be ten times greater than previously measured Health Aff (Millwood), 2011.PMID 21471476
- [17]Makary MA, Daniel M Medical error-the third leading cause of death in the US BMJ, 2016.PMID 27143499
- [18]Landrigan CP, Parry GJ, Bones CB, Hackbarth AD, Goldmann DA, Sharek PJ Temporal trends in rates of patient harm resulting from medical care N Engl J Med, 2010.PMID 21105794
- [19]Levy MM, Rhodes A, Phillips GS, et al. Surviving Sepsis Campaign: association between performance metrics and outcomes in a 7.5-year study Crit Care Med, 2015.PMID 25275252
- [20]Leape LL Who's to blame? Jt Comm J Qual Patient Saf, 2010.PMID 20402371
- [21]Bates DW, Cohen M, Leape LL, Overhage JM, Shabot MM, Sheridan T Reducing the frequency of errors in medicine using information technology J Am Med Inform Assoc, 2001.PMID 11418536
- [22]Poon EG, Cina JL, Churchill W, Patel N, Featherstone E, Rothschild JM, Critch J, Seger AC, Keohane CA, Baneck M, Hovanesian J, Rooney D, Whittemore AD, Bates DW Medication dispensing errors and potential adverse drug events before and after implementing bar code technology in the pharmacy Ann Intern Med, 2006.PMID 16983130
- [23]Costa DK, Whitehouse MR, Wessman BT Identifying Barriers to Delivering the Awakening and Breathing Coordination, Delirium, and Early Exercise/Mobility Bundle to Minimize Adverse Outcomes for Mechanically Ventilated Patients: A Systematic Review Chest, 2017.PMID 28438605