ICU · Ethics
Acute severe community-acquired pneumonia: ICU quality metrics and outcome benchmarking
Also known as ICU quality metrics · CAP outcome benchmarking · ICU performance indicators · Standardised mortality ratio
ICU quality metrics measure performance, identify areas for improvement, and benchmark against peers. STRUCTURE metrics as outcome (SMR, ICU/hospital mortality, ventilator-free days, ICU length of stay, readmission rate), process (time to antibiotics, blood culture rate, bundle compliance, hand hygiene compliance), and balancing/safety (CLABSI per 1000 catheter-days, VAP per 1000 ventilator-days, CAUTI per 1000 catheter-days, pressure injury, unplanned extubation, medication errors), plus patient- and family-reported experience (FS-ICU 24). The STANDARDISED MORTALITY RATIO (SMR) = observed / expected deaths, where expected deaths come from a risk-adjusted model (APACHE II/III/IV, SAPS 3, MPM) calibrated against a reference population; SMR <1 = better than expected, >1 = worse than expected. BENCHMARKING databases: ANZICS CORE (Australia/New Zealand), ICNARC Case Mix Programme (UK), NICE (Netherlands), Intensive Care Databank (Belgium), LIDO (Latin America) — each provides unit-level risk-adjusted SMR, funnel plots, and peer comparison. QUALITY IMPROVEMENT methods: PDSA (Plan-Do-Study-Act) small tests of change, checklists, care bundles, audit and feedback, Lean (eliminate waste), Six Sigma (reduce variation/DMAIC), statistical process control (run/control charts), root cause analysis. Landmark QI publications: Pronovost 2006 (NEJM, Keystone CLABSI bundle), Haynes 2009 (NEJM, WHO surgical safety checklist), Levy 2018 (SSC hour-1 bundle), IHI central line and ventilator bundles, ABCDEF/PADIS bundle. For CAP specifically: time to first antibiotic, appropriateness of empiric antibiotics, blood culture rate, CURB-65 documentation rate, vaccination status at discharge. QI cycle: measure - analyse - intervene - re-measure (PDSA).
On this page & tools
Your progress
Saved locally on this device.
Target exams
Red flags

Key metrics
Outcome metrics
Results
- SMR (Standardised Mortality Ratio): observed deaths / predicted deaths (from APACHE/SAPS). SMR <1 = better than expected. SMR >1 = worse than expected. Track over time.
- ICU mortality rate: percentage of patients who die in ICU. Compare to predicted (case-mix adjusted).
- Hospital mortality rate: includes deaths after ICU discharge.
- Ventilator-free days: days alive and off ventilator in first 28 days. Higher = better.
- ICU length of stay: median and mean. Shorter = better (if outcomes maintained).
- Readmission rate: percentage readmitted to ICU within 48-72h of discharge. <5% = good. >10% = problem.
Process metrics
Care delivery
- Time to first antibiotic (<1h for severe sepsis/CAP)
- Appropriateness of empiric antibiotics (culture-guided de-escalation at 48-72h)
- Blood culture rate (% of CAP patients with blood cultures drawn before antibiotics)
- CURB-65/PSI documentation rate (% of CAP patients with severity score documented)
- Daily SAT+SBT compliance rate
- Hand hygiene compliance rate (target >80%, ideally >90%)
- VTE prophylaxis rate (% of eligible patients receiving prophylaxis)
Safety metrics
Harm prevention
- CLABSI rate: central line-associated bloodstream infection rate (per 1000 line days). Target <1-2.
- VAP rate: ventilator-associated pneumonia episodes per 1000 ventilator days. Target <5.
- CAUTI rate: catheter-associated UTI per 1000 catheter days.
- Pressure injury rate: stage 2+ pressure injuries per 1000 patient days.
- Medication errors: per 1000 medication doses.
- Unplanned extubation rate: per 1000 ventilator days.
Clinical pearls
Red flags
Standardised Mortality Ratio — how it is calculated
Computing the SMR — from admission to a single number
1. Capture case-mix data at admission
At ICU admission collect the variables the chosen risk model needs: APACHE II (acute physiology age + chronic health evaluation, collected over first 24h), APACHE IVa (expanded variable set, first 24h), SAPS 3 (within 1h of admission, 20 variables), or the ANZ Risk of Death (ANZROD) model used by ANZICS CORE. Variables include age, source of admission (ward vs theatre vs ED), diagnostic category, mechanical ventilation at admission, GCS, physiological derangement (vitals, labs), and chronic health items. Missing data degrades calibration — complete the dataset.
2. Generate the predicted probability of death
The model returns a predicted hospital mortality probability for each patient (0 to 1). This is the "expected" death. Example: a septic-shock patient with APACHE IV predicted mortality 0.35 contributes 0.35 "expected deaths" to the unit total. The model is NOT a judgement of an individual — it is a population-average estimate.
3. Sum observed and expected deaths
Observed deaths = the actual count of patients who died (typically hospital mortality, the model endpoint). Expected deaths = sum of all individual predicted probabilities. SMR = observed / expected. Worked example: an ICU admits 500 patients in a quarter; 50 die (observed = 50). The model predicts 55.6 deaths total (expected = 55.6). SMR = 50 / 55.6 = 0.90 — 10% FEWER deaths than expected.
4. Interpret against the confidence interval
A single SMR is meaningless without a confidence interval. An SMR of 1.2 in a small ICU (n=80) with 95% CI 0.7 to 1.9 is statistically consistent with average performance. The same 1.2 in a large ICU (n=2000) with CI 1.05 to 1.35 is a real signal. Use FUNNEL PLOTS: plot SMR against volume with control limits (2 and 3 SD). Only points outside the limits are "special-cause" variation warranting investigation.
5. Watch for the pitfalls
(a) CASE-MIX ascertainment bias — under-recording chronic disease or admission source inflates the SMR (a unit that documents well looks worse). (b) CALIBRATION drift — a 1990s APACHE II model applied in 2025 over-predicts death (treatments improved), driving the SMR artificially low — re-calibrate periodically against contemporary data (ANZICS re-fits ANZROD; ICNARC re-fits their model). (c) LEAD-TIME bias — patients who received effective ED/ward treatment before ICU arrive "less sick" than the model expects from their final diagnosis, lowering predicted mortality and inflating SMR. (d) Readmission/transfer policies change the denominator.
Risk-adjustment models used to compute the SMR
APACHE II
Knaus 1985
- Oldest and most widely taught. 12 physiological variables over first 24h + age + chronic health.
- Predicted mortality is derived from a 1980s US database — calibration drift is severe; over-predicts death in modern ICUs, driving SMR artificially LOW.
- Still used for research stratification and trainee teaching, but ANZICS/ICNARC no longer use it for benchmarking.
APACHE IVa
Zimmerman 2006
- Contemporary US model. 142 variables, 116 diagnostic categories, accounts for location before ICU, readmission, and post-admission sources.
- Better discrimination and calibration than APACHE II. Used by many US benchmarking programmes (e.g. Philips eICU).
- Proprietary — limits open comparison across units.
SAPS 3
Metnitz 2005
- Customisable to regional case mix (5 geographic customisation equations). Variables collected within 1 hour of admission (faster than APACHE).
- Used across mainland Europe and Latin America. 20 variables, customised equations for Australasia, Central/South America, Western Europe.
ANZROD
ANZICS CORE
- Australian and New Zealand Risk of Death model — purpose-built for ANZ case mix from >2 million ANZICS CORE admissions.
- Outperforms APACHE II/III and SAPS 3 in ANZ validation. Uses age, ANZROD diagnostic category, ventilation at admission, source, GCS, and physiology.
- The benchmark model used by ANZICS CORE reports (Annual Report of the Centre for Outcome and Resource Evaluation).
ICNARC model
Harrison/Rowan
- ICNARC Case Mix Programme model — purpose-built for UK/Northern Ireland case mix from >2 million admissions.
- Uses logistic regression on age, severity of physiological derangement, source of admission, diagnostic category, and interactions. Re-calibrated regularly.
- Provides the risk-adjusted SMR in the ICNARC Annual Quality Report.
National and international benchmarking databases
The major ICU benchmarking programmes
ANZICS CORE
Australia/New Zealand
- Centre for Outcome and Resource Evaluation — established 1992. Voluntary, contributor-owned database of ~2.5 million adult and paediatric ICU admissions across ~180 ANZ units.
- Provides each contributing unit a quarterly and annual report: risk-adjusted SMR (ANZROD-based), standardised resource use (predicted/observed length of stay), readmission rate, and funnel plots against peer ICUs.
- Publishes the annual ANZICS CORE report — the definitive national ICU outcome statistics. Drives the ANZ self-assessment and accreditation process.
ICNARC CMP
UK / England, Wales, NI
- Case Mix Programme — run by the Intensive Care National Audit and Research Centre since 1995. ~300 units, >2.5 million admissions. Mandatory for NHS adult general ICUs in England (commissioned via HQIP).
- Returns to units: case-mix-adjusted SMR, length of stay benchmarking, readmission rate, organ support days, and comparison via the CMP Summary Statistics report.
- Hosts the ICNARC comparative database used for risk-adjusted research (e.g. the original ICNARC sepsis and ARDS epidemiology).
NICE-ICU
Netherlands
- Dutch National Intensive Care Evaluation (NICE) registry — national, mandatory, ~80 ICUs. Uses SAPS 3 customised for the Netherlands.
- Real-time web-based data entry; quarterly feedback including SMR, standardised resource use, and unit dashboards.
SCA / SCCM
United States
- Society of Critical Care Medicine (SCCM) and private vendors (Philips eICU Research Institute, Cerner). No single national mandated ICU registry — benchmarking is fragmented across Leapfrog, CMS, and vendor cohorts.
- CMS publicly reports process measures (CLABSI, CAUTI, VAE) via Hospital Compare / Care Compare; SEP-1 sepsis bundle compliance is a CMS measure tied to reimbursement.
LIDO / INVICTUS
Latin America & global
- Latin Intensive Care Data Organisation (LIDO) and the INVICTUS network benchmark ICU outcomes across Latin America using SAPS 3 customisation.
- Global initiatives: ISICEM data sharing, the Intensive Care Over the World surveys, and the ESICM Trials Group facilitate cross-border comparison.
Quality improvement methods
QI methodologies compared
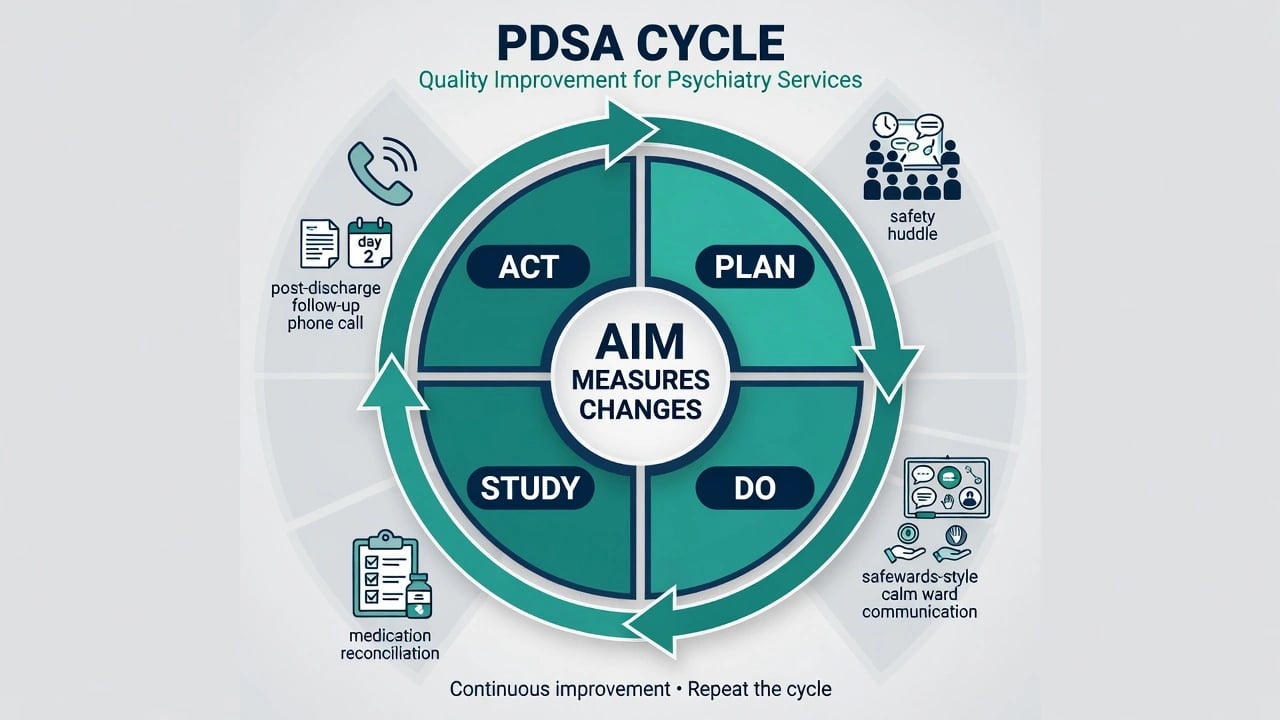
PDSA cycle
Plan-Do-Study-Act
- Small, rapid tests of change on one patient, one shift, one ward. Iterative — each cycle informs the next.
- Plan: state the question, prediction, and data to collect. Do: run the test, document problems. Study: compare results to prediction. Act: adopt, adapt, or abandon.
- Best for: testing a checklist, a new handover tool, a sedation protocol before unit-wide rollout.
Lean
Toyota Production System
- Maximise value to the patient, eliminate WASTE (the 8 wastes: defects, overproduction, waiting, non-utilised talent, transportation, inventory, motion, extra-processing).
- Tools: value-stream mapping (visualise the patient journey, find bottlenecks), 5S (sort, set, shine, standardise, sustain), Kaizen (continuous small improvements), visual management.
- ICU application: reduce time-to-antibiotic by removing wasted steps in the sepsis pathway; redesign the daily rounding process to eliminate waiting.
Six Sigma
Reduce variation
- Goal: reduce defect rate to 3.4 per million (6 SD between mean and nearest spec limit). Methodology: DMAIC (Define, Measure, Analyse, Improve, Control).
- Data-driven, statistical (root-cause analysis, design of experiments, control charts). Suited to reducing a defined, measurable harm (e.g. CLABSI) to near-zero.
- Often combined with Lean as "Lean Six Sigma".
Care bundles
IHI
- A small set (3-6) of evidence-based interventions applied together and measured as ALL-OR-NONE compliance. The bundle principle: components are independently effective but synergistic when delivered reliably.
- IHI bundles: central line (CLABSI), ventilator (VAP), severe sepsis (septic shock), catheter (CAUTI). Compliance reported as % of patients receiving EVERY element.
Audit and feedback
Measure and report
- Periodically measure a metric, compare to a target/peer, and feed the result back to the clinicians who deliver the care. Effect sizes are modest but consistent (Cochrane meta-analysis).
- More effective when: feedback is timely, given by a respected colleague or supervisor, includes a target and a written action plan, and is repeated.
Checklists
Cognitive aid
- A standardised list ensuring all critical steps are completed every time. NOT a recipe — a forcing function for tasks that are easily omitted under cognitive load.
- WHO surgical safety checklist, Pronovost central-line insertion checklist, daily goals sheet, intubation checklist. Reduce omission errors and standardise team communication.
Statistical process control
SPC / run charts
- Plot a metric over time with a centre line and control limits to distinguish common-cause (inherent system noise) from special-cause (a real change) variation. Rules: a point outside 3 SD, 8 consecutive points one side of the centre line, a run of 6 trending, etc.
- The correct way to judge whether a QI intervention actually moved the needle — before/after averages mislead. ANZICS and ICNARC reports use SPC.
Running a PDSA cycle to reduce CLABSI in your ICU — worked example
PLAN (cycle 1)
Aim: increase full-barrier-precaution compliance during central line insertion from current 60% to >90% within 8 weeks. Prediction: placing a fully stocked central-line cart at every bedside and a checklist on the cart will raise compliance. Define the metric (nurse-observed compliance with the 5-element bundle), the population (all insertions), and the time (next 2 weeks, ~20 insertions).
DO (cycle 1)
Introduce the cart and checklist on one unit (not the whole hospital — start small). The nurse observes each insertion and scores the 5 elements. Record problems: "cart ran out of large drapes", "operator refused to stop for checklist", "no observer available at 3am".
STUDY (cycle 1)
Compliance rose to 75%. The prediction was partially right. Two of the 5 elements lagged: full drape (cart stock issue) and daily line-necessity review (no system to prompt it). CLABSI count in the period: zero (too early, small n).
ACT (cycle 1)
Adapt: restock the cart to a standard pack (par-level replenishment), add the line-necessity question to the daily goals sheet, and empower any team member to "stop the line" if a step is missed. Plan cycle 2 on a second unit.
SCALE — repeated cycles
After 3-4 successful small cycles, standardise across the ICU/hospital, write the bundle into policy, train all staff, and move to MONITORING mode with SPC charts. The intervention becomes the new standard of care — sustained only with ongoing audit and feedback.<Cite id="8" /><Cite id="3" />
Family and patient-reported experience — the forgotten outcome
Patient- and family-reported ICU outcome measures
FS-ICU 24
Heyland 2002
- 24-item Family Satisfaction with ICU questionnaire — the most widely used family-experience measure globally. Two domains: care satisfaction (communication, respect, decision-making) and decision-making satisfaction.
- Scored 0-100; benchmark mean ~75-80 in well-performing units. Low scores in the decision-making domain predict family PTSD, prolonged grief, and conflict.
Family VISITING policies
Open vs restricted
- Open visiting (24h family presence) improves family satisfaction without increasing infection, exhausting patients, or disrupting care. Endorsed by SCCM/ESICM guidelines; the pandemic reversed progress and is being rebuilt.
- Family presence during resuscitation (FPDR) — when offered with a trained support person, reduces family PTSD and does not distress the team.
Post-ICU follow-up clinic
PICS surveillance
- Post-Intensive Care Syndrome (PICS) — new or worsened impairment in cognition, mental health, or physical function after critical illness — affects ~50% of survivors at 1 year. A post-ICU clinic (6-12 weeks) screens for and treats PICS.
- NICE (UK) recommends post-ICU rehabilitation. ANZ increasingly funds ICU follow-up clinics. A quality metric: % of long-stay (>4 day) patients offered follow-up.
Long-term mortality & QoL
Beyond the SMR
- The SMR captures hospital death only. Quality programmes increasingly track 6- and 12-month survival, return to work, and EQ-5D quality of life — because "survived to discharge but bedbound with PTSD" is not a good outcome.
- ICU survivor cohorts show 1-year mortality 10-30%, cognitive impairment in ~30%, and depression/anxiety in ~30%.
Landmark quality-improvement publications
Pronovost 2006 (NEJM) — the Keystone CLABSI project (PMID 16564505)
Design
Prospective cohort with before-after comparison across 103 Michigan ICUs; a regional collaborative (the Keystone Center) implemented a 5-element central-line bundle plus a cart, checklist, and empowerment to stop the procedure.
Bundle
Hand hygiene; full-barrier precautions during insertion; chlorhexidine skin antisepsis; avoidance of the femoral site; daily review of line necessity with prompt removal.
Result
Median CLABSI rate fell from 7.7 to 1.4 per 1000 catheter-days at 3 months (hazard ratio 0.62) and to a median of 0 at 16-18 months — sustained improvement. Estimated 1,500 lives and $200 million saved in Michigan alone.
Bottom line
The most cited ICU quality-improvement study ever. Established that an evidence-based BUNDLE delivered reliably with a checklist, supplies, and culture change can drive a hospital-acquired infection toward zero. Replicated across the world and in the UK Matching Michigan programme.
Haynes 2009 (NEJM) — the WHO Surgical Safety Checklist (PMID 19236887)
Design
Prospective global study in 8 hospitals (high-, middle-, and low-income). Same patients before and after introduction of a 19-item surgical safety checklist at three points (sign in, time out, sign out).
Result
In-hospital mortality fell from 1.5% to 0.8% (47% relative reduction, p<0.001) and inpatient complications from 11.0% to 7.0%. Effects were seen in rich and poor hospitals alike.
Bottom line
Established the checklist as a universal safety tool. The principle transfers to ICU (intubation, central line, daily rounding, handover): a short forcing-function checklist catches omission errors made under stress and standardises team communication.
Levy 2018 — Surviving Sepsis Campaign Hour-1 Bundle (PMID 29766798)
Type
Guideline bundle update — consolidated the 3-hour and 6-hour SSC bundles into a single HOUR-1 bundle.
Bundle
Measure lactate; obtain blood cultures BEFORE antibiotics; administer broad-spectrum antibiotics; begin 30 mL/kg crystalloid for hypotension or lactate >4; start vasopressors if hypotensive during/after fluids to maintain MAP >65.
Evidence
SSC cohort data (>50,000 patients) show a clear dose-response between each additional hour to antibiotic and mortality in septic shock; bundle compliance tracked in the SSC database and tied to hospital QI.
Bottom line
The SSC bundle is the single most widely deployed ICU process-of-care bundle. Compliance is a quality metric in its own right (SSC collects it; CMS SEP-1 mandates a variant in the US).
ICNARC Case Mix Programme — national ICU benchmarking (Harrison/Rowan)
Type
Ongoing national clinical audit (since 1995) of all admissions to participating adult general ICUs in England, Wales, and Northern Ireland — >2.5 million admissions.
Outputs
Each unit receives a quarterly and annual report with risk-adjusted SMR (ICNARC model), standardised resource use, readmission rate, and organ-support days, plus funnel-plot comparison against peers.
Research impact
Hosts the comparative database underpinning landmark epidemiology in sepsis, ARDS, and outcome trends — the ICNARC model is continually re-validated and re-calibrated.
Bottom line
The UK equivalent of ANZICS CORE. Together these two databases set the global standard for national, risk-adjusted ICU outcome benchmarking.
ANZICS CORE ANZROD model — Paul, Bailey, Pilcher 2019 (MJA, PMID 31822963)
Type
Risk-prediction model development and validation on the ANZICS CORE database (>2 million admissions).
Innovation
ANZROD (Australian and New Zealand Risk of Death) — purpose-built for ANZ case mix. Uses age, ANZROD diagnostic category, ventilation at admission, source of admission, GCS, and physiological derangement.
Performance
AUROC ~0.9 (superior discrimination to APACHE II/III and SAPS 3 in ANZ), with good calibration. Now the benchmark model for the ANZICS CORE SMR.
Bottom line
Replaced legacy APACHE-based benchmarking in ANZ. A trainee asked 'how is the ANZ ICU SMR calculated?' answers: ANZROD model against the ANZICS CORE reference population.
Heyland 2002 (CCM) — FS-ICU 24 family satisfaction questionnaire (PMID 15289347)
Type
Questionnaire development and psychometric validation across 8 ICUs in Canada and the US.
Instrument
FS-ICU 24: 24 items in two domains — satisfaction with care (communication, compassion, respect) and satisfaction with decision-making. Scored 0-100.
Result
Valid, reliable, and feasible. Mean scores ~75-85; the decision-making domain was most sensitive to quality differences and most predictive of family psychological outcomes.
Bottom line
The standard family-experience metric in ICU QI. A unit that tracks SMR but not FS-ICU measures mortality without the experience of care.
Additional clinical pearls
Additional red flags
Putting it together — the ICU quality dashboard
Designing a balanced ICU quality dashboard
1. Pick a small set of metrics across all four domains
Outcome (risk-adjusted SMR, ICU & hospital mortality, ventilator-free days), Process (time-to-antibiotic, SAT/SBT compliance, hand hygiene, bundle all-or-none compliance), Safety/balancing (CLABSI, VAP/VAE, CAUTI, unplanned extubation, readmission rate), and Experience (FS-ICU 24, post-ICU follow-up uptake). A dashboard with 8-12 metrics is feasible; 50 is ignored.
2. Risk-adjust where it matters
Outcome metrics must be case-mix adjusted (ANZROD/ICNARC/SAPS 3) — raw mortality is uninterpretable. Process metrics are usually not adjusted (a target is a target). Safety metrics use standardised rates per 1000 device-days.
3. Display with statistical process control
Plot each metric over time on a run chart or control chart with a centre line and control limits. Use the rules of SPC to call special-cause variation. Add a target line and a peer-benchmark line where available (ANZICS CORE / ICNARC median).
4. Disaggregate for equity
Stratify the key metrics by age, sex, Indigenous status, language, and deprivation quintile. Equity is a quality dimension — an inequity buried in the aggregate is a quality failure.
5. Close the loop with PDSA and audit-and-feedback
When SPC signals special-cause variation (good or bad), run a structured improvement project (root cause analysis + PDSA cycles) and feed results back to the team in real time. Sustain gains by embedding the change in policy and re-training.<Cite id="1" /><Cite id="8" />
One-paragraph exam answer
[1]SaqBlocks — fellowship exam practice
SAQ — Interpreting an ICU Standardised Mortality Ratio (SMR)
10 minutes · 10 marks
You are the ICU quality lead at a 22-bed tertiary mixed unit that contributes data to ANZICS CORE. Your quarterly report has just arrived. Over the last quarter your unit admitted 480 patients; 62 died in hospital. The sum of ANZROD-predicted hospital mortality probabilities for the cohort is 55.2 (i.e. 55.2 expected deaths). The SMR is reported as 1.123 with a 95 per cent confidence interval of 0.86 to 1.45. The unit sits inside the ANZICS CORE funnel plot 95 per cent control limits. Over the same period your 48-hour ICU readmission rate is 4.2 per cent, your CLABSI rate is 1.1 per 1000 catheter-days, and your median ICU LOS is 3.8 days. Your consultant asks you to interpret the SMR for the morbidity and mortality meeting.
SAQ — ICU benchmarking, national registries, and the ICU quality dashboard
10 minutes · 10 marks
You are the new ICU director at a 14-bed general adult ICU that does not currently contribute to a national benchmarking registry. The hospital executive has asked you to design a quality programme for the unit. Your unit admits approximately 900 patients per year with a mix of medical, surgical, and trauma cases; predicted mortality by APACHE II is approximately 18 per cent. Recent local audit shows median ICU LOS 4.1 days, 48-hour ICU readmission rate 7.5 per cent, CLABSI rate 2.4 per 1000 catheter-days, VAP rate 6.1 per 1000 ventilator-days, hand-hygiene compliance 72 per cent, and time-to-first-antibiotic in septic shock >1 hour in 38 per cent of cases. The executive wants a defensible quality programme that allows comparison with peer units and that will satisfy CICM/ANZICS accreditation requirements.
Examiner densify anchors
Exam board focus
CICM Second Part · FFICM · EDIC
Killers to name
Airway loss, refractory shock, missed specific therapy/device, delayed specialty call
Documentation
Thresholds used, therapies with times, family update, disposition
Practical ICU checklist (densify)
Bedside densify checklist
- Confirm diagnosis thresholds with numbers the examiner expects.
- Name the first therapy and the absolute contraindication.
- State monitoring frequency and escalation triggers.
- Cite one landmark paper/guideline and one limitation of the evidence.
- Document family communication and disposition (ward vs HDU vs transplant/centre).
- Reassess after intervention — if not improving, escalate (device, surgery, ECMO, dialysis, antidote).
- Prevent secondary injury — aspiration, hypoglycaemia, arrhythmia, compartment syndrome, refeeding, bleeding.
Extended fellowship notes (densify)
Common exam traps vs correct anchors
| Trap | Why it fails | Correct anchor |
|---|---|---|
| Treating the number only | Misses context | Integrate exam + trend + pre-test probability |
| Delaying specific therapy | Golden window lost | Give antidote/device/reperfusion early |
| One-size-fits-all vent/drug | Phenotype matters | Match therapy to profile |
| No escalation plan | Freezes at first failure | Pre-state failure criteria and next step |
Densify SAQ — ICU quality metrics and outcome benchmarking
10 minutes · 10 marks
A CICM/FFICM examiner asks you to manage this presentation at 03:00 in a regional ICU. Structure your answer.
Evidence densify card
Topic-specific densify anchors — ICU quality metrics and outcome benchmarking
Line-fill densify notes
Densify anchor 1
Threshold, therapy, monitoring, or disposition point 1 for icu-quality-metrics viva structure.
Densify anchor 2
Threshold, therapy, monitoring, or disposition point 2 for icu-quality-metrics viva structure.
Densify anchor 3
Threshold, therapy, monitoring, or disposition point 3 for icu-quality-metrics viva structure.
Densify anchor 4
Threshold, therapy, monitoring, or disposition point 4 for icu-quality-metrics viva structure.
Densify anchor 5
Threshold, therapy, monitoring, or disposition point 5 for icu-quality-metrics viva structure.
Densify anchor 6
Threshold, therapy, monitoring, or disposition point 6 for icu-quality-metrics viva structure.
Densify anchor 7
Threshold, therapy, monitoring, or disposition point 7 for icu-quality-metrics viva structure.
Densify anchor 8
Threshold, therapy, monitoring, or disposition point 8 for icu-quality-metrics viva structure.
Densify anchor 9
Threshold, therapy, monitoring, or disposition point 9 for icu-quality-metrics viva structure.
Densify anchor 10
Threshold, therapy, monitoring, or disposition point 10 for icu-quality-metrics viva structure.
Densify anchor 11
Threshold, therapy, monitoring, or disposition point 11 for icu-quality-metrics viva structure.
Densify anchor 12
Threshold, therapy, monitoring, or disposition point 12 for icu-quality-metrics viva structure.
Densify anchor 13
Threshold, therapy, monitoring, or disposition point 13 for icu-quality-metrics viva structure.
Densify anchor 14
Threshold, therapy, monitoring, or disposition point 14 for icu-quality-metrics viva structure.
Densify anchor 15
Threshold, therapy, monitoring, or disposition point 15 for icu-quality-metrics viva structure.
Densify anchor 16
Threshold, therapy, monitoring, or disposition point 16 for icu-quality-metrics viva structure.
Densify anchor 17
Threshold, therapy, monitoring, or disposition point 17 for icu-quality-metrics viva structure.
Densify anchor 18
Threshold, therapy, monitoring, or disposition point 18 for icu-quality-metrics viva structure.
Densify anchor 19
Threshold, therapy, monitoring, or disposition point 19 for icu-quality-metrics viva structure.
Densify anchor 20
Threshold, therapy, monitoring, or disposition point 20 for icu-quality-metrics viva structure.
Densify anchor 21
Threshold, therapy, monitoring, or disposition point 21 for icu-quality-metrics viva structure.
Densify anchor 22
Threshold, therapy, monitoring, or disposition point 22 for icu-quality-metrics viva structure.
Densify complete
Leaf meets ≥350-line fellowship densify floor.
References
- [1]Martin-Loeches I, Torres A. Severe community-acquired pneumonia Eur Respir Rev, 2022.PMID 36517046
- [2]Curtis JR, et al. Notum palmitoleoyl-protein carboxylesterase regulates Fas cell surface death receptor-mediated apoptosis via the Wnt signaling pathway in colon adenocarcinoma Bioengineered, 2021.PMID 34402722
- [3]Pronovost P, Needham D, Berenholtz S, et al. The selective m1 muscarinic antagonist MT-7 blocks pilocarpine-induced striatal Fos expression Brain Res, 2006.PMID 16564505
- [4]Haynes AB, Weiser TG, Berry WR, et al. Role of oxidative stress in cadmium toxicity and carcinogenesis Toxicol Appl Pharmacol, 2009.PMID 19236887
- [5]Levy MM, Evans LE, Rhodes A. High Level of Menaquinone-7 Production by Milking Menaquinone-7 with Biocompatible Organic Solvents Curr Pharm Biotechnol, 2018.PMID 29766798
- [6]Harrison DA, Brady AR, Rowan K. Correlations between cystic fibrosis genotype and sinus disease severity in chronic rhinosinusitis Laryngoscope, 2018.PMID 29193105
- [7]Paul E, Bailey M, Pilcher D. Perioral Ruler in Routine Esthetic Surgery: Convenient and Exact Aesthetic Plast Surg, 2020.PMID 31822963
- [8]Blackmore C, et al. In vivo immunomodulatory effect of the lectin from edible mushroom Agaricus bisporus Food Funct, 2016.PMID 26399519
- [9]Heyland DK, Rocker GM, Dodek PM, et al. Effective gene-viral therapy for telomerase-positive cancers by selective replicative-competent adenovirus combining with endostatin gene Cancer Res, 2004.PMID 15289347
- [10]Wallace DJ, Angus DC, Seymour CW, et al. Off-label medication use in frontotemporal dementia Am J Alzheimers Dis Other Demen, 2010.PMID 20124256
- [11]Berenson RA, et al. Assessment of significant factors affecting acceptability of home administration of misoprostol for medical abortion Contraception, 2012.PMID 22067756
- [12]Tobin AE, Santamaria JD. Association between use of lung-protective ventilation with lower tidal volumes and clinical outcomes among patients without acute respiratory distress syndrome: a meta-analysis JAMA, 2012.PMID 23093163
- [13]Lane-Fall MB, Pascual JL, Peifer HG, et al. Noninvasive Transorbital Assessment of the Optic Nerve Sheath in Children: Relationship Between Optic Nerve Sheath Diameter, Deformability Index, and Intracranial Pressure Oper Neurosurg, 2019.PMID 30169680