ICU · Ethics
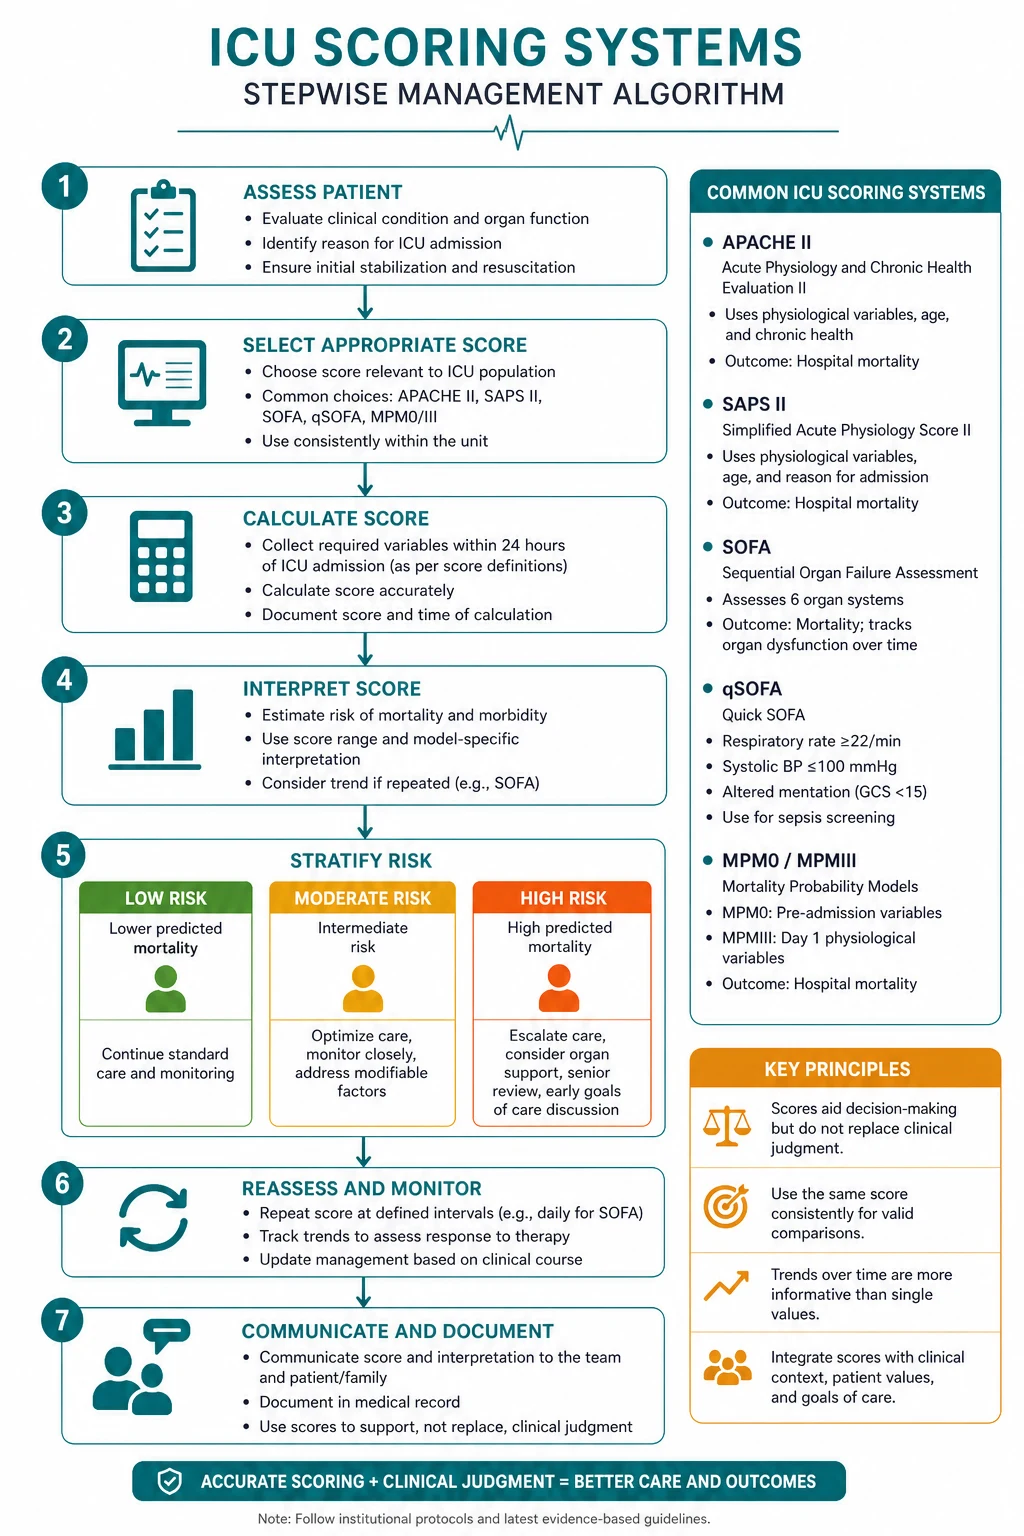
ICU severity scoring systems
Also known as APACHE II · SOFA score · SAPS II · qSOFA · Mortality prediction
ICU scoring systems predict mortality, compare quality between units, and stratify patients for research. APACHE II (Acute Physiology And Chronic Health Evaluation): 12 physiological variables + age + chronic health — most widely used. Score 0-71 (higher = worse). Mortality prediction: 0-4 (~4%), 5-9 (~6%), 20-24 (~40%), 30-34 (~73%). SOFA (Sequential Organ Failure Assessment): 6 organ systems (respiratory, coagulation, liver, cardiovascular, CNS, renal) — daily tracking. SOFA =2 defines organ dysfunction (Sepsis-3). qSOFA: 3 items (RR 22, altered mentation, SBP <100) — for screening outside ICU. SAPS II/3: alternative to APACHE. Scores are for POPULATIONS not individuals — do NOT use alone for treatment limitation decisions.
On this page & tools
Your progress
Saved locally on this device.
Target exams
Red flags
SOFA score
qSOFA
[2]APACHE II
Components
12 physiological + age + chronic health
- Physiological (worst value in first 24h): temperature, MAP, HR, RR, PaO2, arterial pH, Na, K, creatinine, haematocrit, WBC, GCS
- Age (0-71 points): 0-44 (0), 45-54 (2), 55-64 (3), 65-74 (5), >75 (6)
- Chronic health: severe organ insufficiency or immunocompromise (+5 if non-operative, +2 if post-operative)
- Maximum score: 71. Higher = worse prognosis.
Mortality prediction
Calibrated from large databases
- Score 0-4: ~4% predicted mortality
- Score 10-14: ~15%
- Score 20-24: ~40%
- Score 30-34: ~73%
- Score >35: ~85%
- CAUTION: population prediction — NOT individual prognosis. Many patients with high scores survive.
APACHE II — the 12 physiological variables in detail
APACHE II mortality strata
APACHE II score to predicted hospital mortality (Knaus 1985 derivation cohort)
Low range
Score 0-9
- 0-4 → ~4% predicted mortality
- 5-9 → ~6-8% predicted mortality
- 10-14 → ~15%
Intermediate range
Score 15-24
- 15-19 → ~25%
- 20-24 → ~40%
- This band spans the median ICU admission score in many series.
High range
Score 25-34
- 25-29 → ~55%
- 30-34 → ~73%
Very high range
Score ≥35
- 35-39 → ~85%
- ≥40 → >90%
- CAUTION: these are POPULATION averages from a 1980s US cohort — calibration has drifted; a modern patient with the same score has substantially better observed survival. Do NOT cite a percentage to a family as an individual prognosis.
The APACHE family — II vs III vs IV
Evolution of the APACHE models
APACHE II
Knaus 1985
- The original, most widely taught and published. 12 physiological variables + age + chronic health, collected over first 24 h. Score 0-71.
- Strengths: simple, universally recognised, ubiquitous in trial eligibility criteria and trainee examinations.
- Weaknesses: derived from a 1980s US database — severe calibration drift, over-predicts death in modern ICUs, drives SMR artificially low. No longer recommended for contemporary benchmarking.
APACHE III
Knaus 1991
- Expanded to 17 physiological variables plus age, chronic health, and **treatment location before ICU**. Proprietary equations with diagnosis-specific coefficients.
- Better discrimination than APACHE II but proprietary — limited uptake and now largely superseded.
APACHE IV/IVa
Zimmerman 2006
- Contemporary US model: 142 variables, 116 diagnostic categories, accounts for admission source, readmission, ventilation, and pre-ICU length of stay.
- Best discrimination and calibration of the APACHE family; used by many US benchmarking programmes (e.g. Philips eICU Research Institute).
- Proprietary — limits transparent cross-unit comparison.
SAPS 3 (Simplified Acute Physiology Score, 3rd generation)
SAPS 3 — the modern European/Latin-American alternative to APACHE
What it is
Metnitz/Moreno 2005
- SAPS 3 was derived from a **worldwide cohort of 16,784 patients in 137 ICUs** (2002-2004) and intended to replace the older SAPS II (Le Gall 1993).
- 20 variables collected **within the first hour of ICU admission** (faster than APACHE II, which waits 24 h for worst values).
- Variable groups: **patient characteristics** (age, comorbidities, admission source, length of pre-ICU hospital stay), **admission diagnosis**, and **acute physiological derangement** in the first hour.
Why it matters
Customisable + early
- Provides **5 geographic customisation equations** (Australasia, Central/South America, Western Europe, Central Europe, North America) so each region can recalibrate to local case mix — this directly addresses APACHE II's calibration drift problem.
- Because it uses first-hour data, SAPS 3 supports an earlier, real-time predicted mortality — useful for triage and for enrolling early-goal-directed-therapy trials.
- Widely used across mainland Europe, Latin America (LIDO), and the Dutch national NICE registry.
Limitations
Caveats
- Customisation equations still drift and need periodic re-fitting.
- Less universally taught than APACHE II in English-language exams — quote the version you mean.
- SAPS 3 (like all generalist models) can be outperformed by locally-calibrated models such as ANZROD (ANZ) and the ICNARC model (UK).
Comparison of the major scoring systems
APACHE II vs SOFA vs qSOFA vs SAPS 3 vs MPM — purpose, timing, variables, advantages, limitations
APACHE II
Mortality prediction at 24h
- **Purpose**: predict hospital mortality for benchmarking and research stratification.
- **Timing**: worst values in first 24 h (retrospective for the admission).
- **Variables**: 12 physiological + age + chronic health. Score 0-71.
- **Advantages**: ubiquitous, simple, exam-standard, used in trial eligibility.
- **Limitations**: calibration drift (1980s cohort); population-only; not for individual prognostication.
SOFA
Daily organ dysfunction tracking
- **Purpose**: track organ dysfunction over time; SOFA ≥2 defines sepsis (Sepsis-3).
- **Timing**: daily; compare to baseline (delta SOFA most predictive).
- **Variables**: 6 organ systems × 0-4 = 0-24.
- **Advantages**: trend-able, simple, well-validated, intrinsically clinical.
- **Limitations**: not a primary mortality model; cardiovascular score biased by local vasoactive conventions.
qSOFA
Bedside sepsis screening
- **Purpose**: rapid bedside screen for poor outcome outside the ICU.
- **Timing**: any time, repeatable.
- **Variables**: RR ≥22, altered mentation (GCS <15), SBP ≤100. Score 0-3.
- **Advantages**: zero equipment, fast, identifies patients warranting escalation.
- **Limitations**: low sensitivity in ICU patients — NOT for diagnosis inside ICU; poor sensitivity in non-ICU settings led Sepsis-3 to de-emphasise it as a screening trigger.
SAPS 3
Early mortality prediction
- **Purpose**: predict hospital mortality, customisable to local case mix.
- **Timing**: first hour of admission.
- **Variables**: 20 (patient, diagnosis, first-hour physiology).
- **Advantages**: early, region-customisable, contemporary cohort.
- **Limitations**: less familiar in some curricula; still drifts.
MPM₀/MPM₂₄
Mortality Probability Model
- **Purpose**: probability of hospital mortality at admission (MPM₀) and at 24 h (MPM₂₄).
- **Timing**: at admission, then at 24 h.
- **Variables**: ~7 (MPM₀) / ~13 (MPM₂₄) dichotomous (yes/no) physiological and chronic-health items.
- **Advantages**: simple yes/no items, easy to collect, transparent.
- **Limitations**: less granular; less commonly used than APACHE/SAPS for benchmarking.
How to calculate APACHE II
Computing an APACHE II score — from admission to a single number
1. Decide the 24-h collection window
APACHE II uses the WORST physiological value recorded from the moment of ICU admission through the first 24 h. Define the window clearly — for a patient intubated and resuscitated in the first hour, the worst pre-intubation values count. Capture all 12 variables: temperature, MAP, heart rate, respiratory rate, PaO₂ (or A-a gradient), arterial pH (or bicarbonate if no ABG), sodium, potassium, creatinine, haematocrit, WBC, and GCS.
2. Read the APS for each variable
For each variable, find the score (0-4) corresponding to the worst value using the APACHE II table. Example: a septic patient with worst MAP 55 mmHg scores 2; worst respiratory rate 36 scores 1; worst GCS 9 scores 3. Sum the 12 individual scores to give the Acute Physiology Score (APS), range 0-60.
3. Add the age component
Assign the age points: <45 → 0; 45-54 → 2; 55-64 → 3; 65-74 → 5; ≥75 → 6. A 70-year-old scores 5.
4. Add the chronic health component
If the patient has severe organ insufficiency (New York Heart Association class IV heart failure, chronic hypoxaemic/hypercapnic respiratory failure, dialysis-dependent renal failure, biopsy-proven cirrhosis with portal hypertension) or significant immunocompromise, add +5 if the admission is non-operative or emergency post-operative, or +2 if elective post-operative. A non-operative cirrhotic adds 5; an elective post-op transplant patient adds 2.
5. Sum and interpret with a calibration warning
APACHE II = APS + age + chronic health. A worked example: APS 38 + age 5 (70 y) + chronic health 5 (non-op cirrhosis) = 48. The original Knaus table maps 48 to >90% predicted mortality — BUT this is a 1985-cohort population average. Modern observed survival is far better. Use the number for case-mix comparison and research, never as an individual "this patient will die" statement.<Cite id="3" />
NICE-SUGAR — glucose control is not a "score" but is constantly confused with one
[1]NICE-SUGAR — Normoglycaemia in Intensive Care Evaluation and Survival Using Glucose Algorithm Regulation (Finfer 2009, NEJM)
Design
Multicentre RCT, 6,104 mechanically ventilated ICU patients across 42 hospitals (ANZ/US/Canada)
Intervention
Intensive glucose control (target 4.5-6.0 mmol/L) vs conventional (target ≤10.0 mmol/L)
Primary outcome
90-day all-cause mortality: 27.5% intensive vs 24.9% conventional (OR 1.14, 95% CI 1.02-1.28; p=0.02) — intensive control was WORSE
Severe hypoglycaemia (BG <2.2 mmol/L)
6.8% intensive vs 0.5% conventional (p<0.001)
Bottom line
Tight glycaemic control increases mortality and severe hypoglycaemia. Current recommendation: target blood glucose 6-10 mmol/L using a protocolised insulin infusion. This is the source of the '6-10' band quoted in ICU guidelines worldwide.
How NICE-SUGAR overturned the Leuven era
Leuven surgical ICU — Intensive insulin therapy (van den Berghe 2001, NEJM)
Design
Single-centre RCT, 1,548 surgical ICU patients
Intervention
Intensive insulin (target BG 4.4-6.1 mmol/L) vs conventional (target 10.0-11.1 mmol/L, insulin only if BG >11.9)
Primary outcome
ICU mortality 4.6% intensive vs 8.0% conventional (p<0.04); reduced bloodstream infections and critical-illness polyneuropathy
Caveats
Single centre, predominantly cardiac-surgical, enteral-feeding regimen unlike most ICUs; hypoglycaemia 5.1% intensive vs 0.8% conventional. The mortality benefit was concentrated in patients staying >3-5 days in ICU.
Legacy
Launched the worldwide 'tight glycaemic control' era — which NICE-SUGAR later overturned when the benefit failed to replicate outside Leuven.
VISEP — Volume substitution and Insulin Therapy in severe sepsis (Brunkhorst 2008, NEJM)
Design
Multicentre 2×2 factorial RCT, 537 patients with severe sepsis (Germany); insulin arm stopped early for harm
Intervention
Intensive insulin (target 4.4-6.1 mmol/L) vs conventional (target 8.3-10.0 mmol/L)
Outcome
No mortality benefit; significantly more severe hypoglycaemia (17.0% intensive vs 4.1% conventional, p<0.001) and serious adverse events
Bottom line
Early warning that intensive insulin in medical/septic ICU patients was harmful — prefigured and was confirmed by NICE-SUGAR.
Clinical synthesis: the Leuven single-centre surgical benefit did not generalise. The combined evidence (Leuven medical ICU 2006, VISEP 2008, NICE-SUGAR 2009) established that the harm of hypoglycaemia outweighs any benefit of normoglycaemia in heterogeneous ICU populations. Target 6-10 mmol/L; avoid both hyperglycaemia (>10-12 mmol/L) and hypoglycaemia (<4 mmol/L); use a validated insulin-infusion protocol with hourly glucose checks. [1]
Other commonly encountered ICU scoring tools
Beyond mortality prediction — the scoring tools you will be asked about
TISS
Therapeutic Intervention Scoring System
- Quantifies **nursing workload and resource use**, not prognosis. ~76 points across interventions (ventilation, pulmonary artery catheter, dialysis, multiple vasoactive infusions).
- Modern equivalents: **NEMS** (Nine Equivalents of Nursing Manpower Use Score) — a simplified 9-item TISS derivative; **TOI** (Therapeutic Scoring Index). Used for staffing ratios (≈1 TISS point ≈ 10.6 min nursing time).
MPM
Mortality Probability Model
- Probability of death at admission (MPM₀, ~7 variables) and at 24 h (MPM₂₄, ~13 variables). Dichotomous yes/no items make it quick to collect.
- Less granular than APACHE/SAPS; useful as a transparent, simple comparator.
RASS
Richmond Agitation-Sedation Scale
- Sedation depth: +4 (combative) to -5 (unrousable), 0 = alert and calm. The recommended daily sedation target. Paired with CAM-ICU for delirium.
- NOT a severity score — a **process/titration** score that is part of the PADIS (Pain, Agitation, Delirium, Immobility, Sleep) bundle.
CAM-ICU
Confusion Assessment Method for the ICU
- Delirium screen in non-verbal/ventilated patients: feature 1 acute change/ fluctuating course + feature 2 inattention + either feature 3 altered level of consciousness or feature 4 disorganised thinking.
- High specificity, moderate sensitivity; paired with RASS. Delirium predicts longer LOS and higher mortality.
GCS
Glasgow Coma Scale
- Eye (1-4) + verbal (1-5) + motor (1-6) = 3-15. Embedded inside APACHE II and SOFA as the neurological component. In intubated patients report as "E_Vt M_" (e.g. E1 V1t M5 = 7T).
- Limitation: affected by sedation/paralysis — FOUR score is an alternative (eye, motor, brainstem, respiration).
NUTRIC / mNUTRIC
Nutrition Risk in ICU
- Scores nutrition risk (age, APACHE II, comorbidities, LOS, organ failure). Modified NUTRIC excludes IL-6. mNUTRIC ≥5 identifies patients most likely to benefit from aggressive enteral nutrition.
Standardised Mortality Ratio (SMR) — the benchmarking number built on these scores
Landmark trials in ICU severity scoring
Knaus 1985 — the original APACHE II derivation (Crit Care Med)
Design
Prospective cohort of 5,815 ICU admissions across 13 US hospitals
Contribution
Derived and validated the 12-variable + age + chronic health model (score 0-71) and the score-to-mortality conversion table still quoted in every textbook
Legacy
The most-cited severity score in critical care; embedded in research eligibility criteria globally. Calibration has drifted badly — modern use is for stratification and teaching, not benchmarking.
Vincent 1996 — the original SOFA score (Intensive Care Med)
Design
Consensus working party of the ESICM; derived from expert opinion and validated on existing datasets
Contribution
Created the 6-organ, 0-4 daily score (originally 'Sepsis-related Organ Failure Assessment') to describe — not predict — organ dysfunction over time
Legacy
Adopted as the organ-dysfunction definition in Sepsis-3 (SOFA ≥2). Delta-SOFA (change from baseline) outperforms admission SOFA for mortality prediction.
Seymour 2016 + Singer 2016 — the Sepsis-3 definitions and qSOFA (JAMA, paired papers)
Design
International consensus task force (Society of Critical Care Medicine + ESICM), validated against ~1.3 million electronic-health-record encounters
Contribution
Redefinition of sepsis as life-threatening organ dysfunction (SOFA ≥2) and septic shock as hypotension requiring vasopressors + lactate >2 mmol/L despite adequate fluid. Introduced qSOFA (RR ≥22, altered mentation, SBP ≤100) as a rapid bedside screen.
Controversy
qSOFA was de-emphasised after the Raith 2017 ANZICS reanalysis showed low sensitivity for ICU patients with suspected infection. The Sepsis-3 definition itself (SOFA ≥2) remains the standard.
Raith 2017 — ANZICS reanalysis of SOFA/SIRS/qSOFA (JAMA)
Design
Retrospective analysis of 116,595 ANZICS CORE admissions with suspected infection
Finding
In ICU patients, SOFA had superior discrimination (AUROC for in-hospital mortality ~0.75) versus qSOFA (~0.60) and SIRS (~0.58). qSOFA's sensitivity was poor — it would miss many ICU patients who died.
Bottom line
qSOFA is a SCREENING tool for outside the ICU; inside the ICU use SOFA. qSOFA <2 does not reassure.
Le Gall 1993 — the original SAPS II (JAMA)
Design
Multicentre European/North American cohort of 13,152 ICU admissions in 137 ICUs
Contribution
Derived a simplified 17-variable score (12 physiological + age + type of admission + 3 chronic diseases) as a faster alternative to APACHE II
Legacy
Superseded by SAPS 3 (Metnitz 2005), but SAPS II remains the backbone of many national registries and older trial reports.
Exam practice
SAQ — APACHE II versus SAPS 3
10 minutes · 10 marks
A 68-year-old man is admitted to ICU after an emergency laparotomy for a perforated diverticulum and faecal peritonitis. Background includes severe COPD (home oxygen 2 L/min, FEV1 35% predicted) and stage 4 CKD (baseline creatinine 180 umol/L, eGFR 32). On ICU day 1 he is intubated and ventilated (FiO2 0.6, PEEP 8), on noradrenaline 0.15 mcg/kg/min for MAP 65, with PaO2/FiO2 220 and lactate 3.4 mmol/L. Your unit benchmarking dashboard reports both APACHE II and SAPS 3 for every admission.
SAQ — SOFA score in septic shock prognosis
10 minutes · 10 marks
A 55-year-old woman is admitted to ICU with community-acquired pneumonia progressing to septic shock. On admission her SOFA score is 9 (respiratory 2, coagulation 1, liver 1, cardiovascular 3, CNS 1, renal 1). After 72 hours of Surviving Sepsis Campaign-guided care her SOFA is 11. Lactate has cleared from 5.2 to 2.1 mmol/L but she remains on noradrenaline 0.3 mcg/kg/min for MAP 65.
Clinical pearls
Red flags
References
- [1]Vincent JL, et al. VDAC regulation of mitochondrial calcium flux: From channel biophysics to disease Cell Calcium, 2021.PMID 33529977
- [2]Seymour CW, et al. Notum palmitoleoyl-protein carboxylesterase regulates Fas cell surface death receptor-mediated apoptosis via the Wnt signaling pathway in colon adenocarcinoma Bioengineered, 2021.PMID 34402722
- [3]Knaus WA, Draper EA, Wagner DP, Zimmerman JE. APACHE II: a severity of disease classification system Crit Care Med, 1985.PMID 3928249
- [4]Vincent JL, Moreno R, Takala J, Willatts S, et al. The SOFA (Sepsis-related Organ Failure Assessment) score to describe organ dysfunction/failure. On behalf of the Working Group on Sepsis-Related Problems of the European Society of Intensive Care Medicine Intensive Care Med, 1996.PMID 8844239
- [5]Singer M, Deutschman CS, Seymour CW, Shankar-Hari M, et al. The Third International Consensus Definitions for Sepsis and Septic Shock (Sepsis-3) JAMA, 2016.PMID 26903338
- [6]Seymour CW, Liu VX, Iwashyna TJ, et al. Assessment of Clinical Criteria for Sepsis: For the Third International Consensus Definitions for Sepsis and Septic Shock (Sepsis-3) JAMA, 2016.PMID 26903335
- [7]Le Gall JR, Lemeshow S, Saulnier F. A new Simplified Acute Physiology Score (SAPS II) based on a European/North American multicenter study JAMA, 1993.PMID 8254858
- [8]Zimmerman JE, Kramer AA, McNair DS, Malila FM. Sedation during mechanical ventilation: a trial of benzodiazepine and opiate in combination Crit Care Med, 2006.PMID 16540957
- [9]The NICE-SUGAR Study Investigators, Finfer S, Chittock DR, Su SY, et al. Refinement of in vivo surgical procedures for cardiac gene and cell transfer in rats Lab Anim (NY), 2009.PMID 19229226
- [10]van den Berghe G, Wouters P, Weekers F, et al. Intensive insulin therapy in critically ill patients N Engl J Med, 2001.PMID 11794168
- [11]Brunkhorst FM, Engel C, Bloos F, et al. Intensive insulin therapy and pentastarch resuscitation in severe sepsis N Engl J Med, 2008.PMID 18184958