ICU · Ethics
Root cause analysis and quality improvement in the intensive care unit
Also known as Root cause analysis (RCA) · Quality improvement in ICU · PDSA cycle · Critical incident review · Failure mode and effects analysis (FMEA) · Morbidity and mortality (M&M) conference
Root cause analysis (RCA) is a structured, BLAME-FREE method for analysing adverse events and near-misses to identify underlying SYSTEM causes and prevent recurrence. Process: (1) Identify incident and convene a multidisciplinary team. (2) Gather data (timeline, interviews, documentation, equipment review). (3) Identify contributing factors using a recognised framework — Swiss cheese model (Reason: active failures and latent conditions), the London Protocol (Vincent: patient, staff, task, technology, environment, team, organisation), or fishbone/Ishikawa (people, process, equipment, environment, management). (4) Determine root causes (system/process, NOT individual blame) using tools such as 5 Whys. (5) Develop a SMART action plan with strong countermeasures (hierarchy: forcing functions greater than education). (6) Implement, measure, and feedback. Quality improvement (QI) methods: PDSA (Plan-Do-Study-Act), Lean (eliminate TIMWOODS waste), Six Sigma/DMAIC (reduce variation), checklists and care bundles, audit and feedback, statistical process control (run charts, control charts, Pareto, process mapping). Proactive risk tools include FMEA (Failure Mode and Effects Analysis). Just culture (Reason/Dekker): distinguish human error (forgivable — fix the system) from at-risk behaviour (coach) and reckless behaviour (not forgivable — address the individual). ICU QI targets: time to antibiotics, VAP/VAE rate, CLABSI rate, CAUTI, readmission rate, standardised mortality ratio (SMR).
On this page & tools
Your progress
Saved locally on this device.
Target exams
Red flags

Why this matters in intensive care
Critically ill patients are the most vulnerable to harm from the very systems intended to cure them: they receive the most drugs, lines, devices and handovers, cared for by rotating, fatigued teams under time pressure. The Harvard Medical Practice Study established that a substantial proportion of inpatient adverse events are caused by negligence and that the majority are preventable[4]. The ADE Prevention Study showed that most medication errors are systems failures — wrong dose, wrong route, missed allergy — best fixed by redesigning the prescribing and administration system, not by exhorting individuals to "be more careful."[8] The intensive care unit therefore represents the highest-yield environment in the hospital for safety engineering, and the intensivist is expected — in CICM/FFICM/EDIC vivas and in practice — to lead RCA, M&M review, and QI rather than merely attend them.
What root cause analysis is — and is not
RCA is a structured, retrospective, multidisciplinary investigation into an adverse event, sentinel event or near-miss, conducted blame-free, with the aim of identifying the underlying system weaknesses that allowed the event to occur and designing strong, measurable countermeasures so it does not recur. Its essential features are: [1]
- Blame-free and systems-focused. RCA asks "what" and "why," not "who." The first question is never "whose fault was it?" but "what conditions allowed this to happen?"[7]
- Multidisciplinary. The investigation team includes those closest to the event (bedside nurse, junior doctor, pharmacist, technician) plus a facilitator and a senior sponsor. Excluding frontline staff guarantees a sterile, inaccurate report.
- Data-driven. Timeline reconstruction, interview of all involved (using cognitive interview technique), review of charts, monitors, equipment, drug charts and environment — before forming hypotheses.
- Action-oriented. An RCA without implemented, measured actions is a paperwork exercise. The deliverable is not the report; it is the change.[7]
RCA is not: a disciplinary process; a means to allocate liability for litigation; a single-incident "witch-hunt"; or a substitute for proactive risk assessment (FMEA). It is also not research — it does not generate generalisable new knowledge, and it usually does not require ethics committee approval (see audit vs research, below). [1]
The RCA process — step by step
Conducting a root cause analysis in ICU
- TRIGGER AND TRIAGE — The RCA is triggered by an incident report, a sentinel event, an M&M referral, a complaint, or a pattern on the unit's SPC chart. Triage the severity: a no-harm near-miss may warrant a "mini-RCA" (rapid review); a death or major harm event warrants a full, formally convened RCA with executive sponsorship.
- CONVENE THE TEAM — Assemble a multidisciplinary group of four to six people: a trained facilitator (often a safety/quality officer), the staff involved (crucial — they hold the data), a content expert, and a "fresh-eyes" member from outside the area. Nominate a senior sponsor who will own the action plan. Exclude anyone with a conflict of interest or disciplinary role. Reassure participants in writing that the process is blame-free and that interview content will not be used punitively.
- GATHER THE DATA — Within 24–72 hours, while memory and evidence are fresh: secure the physical environment and equipment (sequester the faulty infusion pump or CVC tray), pull the medical record, monitoring trends, drug charts, charts, photos, CCTV, and the device log files. Interview each person individually using open, non-judgemental questions: "Walk me through what happened," "What were you thinking at that point?," "What else was going on?" Reconstruct a detailed chronological timeline, marking each point where a defence failed or a different choice could have prevented harm.
- MAP CONTRIBUTORY FACTORS — Take the timeline and ask, at each critical step, "what made this possible?" Organise the answers using a recognised framework: the London Protocol (Vincent: patient factors; staff factors; task and technology factors; environmental factors; team factors; organisational and management factors)[5] or the fishbone/Ishikawa categories (people, process, equipment, environment, materials, management). Use the Swiss cheese model to show which defences (checklist, double-check, alarm, supervisor) each had a hole, and how the holes aligned on the day.[7]
- DRILL TO ROOT CAUSES — Apply the 5 Whys iteratively: for each contributory factor, ask "why?" up to about five times until you reach a system cause you can act on (a latent condition), not a person. Stop when the answer is no longer actionable. Triangulate: a single root cause is suspicious — most events have several converging latent conditions.
- GENERATE COUNTERMEASURES — RANK BY STRENGTH — For each root cause, brainstorm controls and rank them by the hierarchy of countermeasures: forcing functions and constraints (strongest) > simplification and standardisation > reminders, checklists and double-checks > rules and policies > education and awareness (weakest). Prefer the strongest feasible control. "Re-educate the staff" is almost never an adequate root-cause fix.
- WRITE THE ACTION PLAN — SMART — Each action must be Specific, Measurable, Assignable (named owner), Realistic, and Time-bound, with a target metric and a review date. Map each action to a specific root cause so nothing is orphaned. Secure executive sign-off and a budget.
- IMPLEMENT AND MEASURE — Execute the plan (often via PDSA cycles — see below). Measure the target metric (e.g., CLABSI per 1000 line-days, time-to-antibiotic) before and after using a run chart or control chart. "No measurement, no improvement."
- FEED BACK AND SUSTAIN — Feed results back to the staff who reported the event and to the whole unit (closing the loop encourages future reporting). Embed the change in policy, induction, and the electronic system so it survives staff turnover. Schedule a formal review at 6 and 12 months to confirm the gain has held.
- SHARE WIDELY — De-identify and share the lessons across the hospital, the network, and (where appropriate) national incident databases (e.g., ANZICS Safety Surveillance, NHS National Reporting and Learning System) so others can learn without suffering the same harm.
RCA tools
5 Whys
The simplest root-cause technique: state the problem, then ask "why did this happen?" and answer; then ask "why?" of the answer; repeat (typically about five iterations) until you reach an actionable system cause. The number five is a guide, not a rule — stop when the answer is a latent condition you can change, and stop early if you are heading toward a person rather than a system. [1]
Worked example — wrong insulin dose in ICU[8]
- Why did the patient receive 50 units instead of 5 units of subcutaneous insulin? → The order was written as "50u" and the nurse drew up 50 units.
- Why was the order written as "50u"? → The prescriber used "u" as an abbreviation for units, and the "u" was read as a zero.
- Why is the abbreviation "u" used? → There is no enforced ban on dangerous abbreviations in the electronic order.
- Why is there no enforced ban? → The computerised prescriber order entry (CPOE) system allows free-text doses rather than forcing selection from a dropdown.
- Why does CPOE allow free text? → Insulin was not configured as a constrained-order-set drug at build. [1]
Root cause: a latent condition in the CPOE build. Countermeasure (strong): configure insulin as a constrained order set with unit-dose dropdowns and hard alerts for doses above a threshold — a forcing function, not a memo to "write more clearly." [1]
Fishbone (Ishikawa / cause-and-effect) diagram
A visual brainstorming tool. The "effect" (the adverse event) sits in the head of the fish on the right; contributing causes are grouped along "bones" under standard categories. For healthcare the common categories are: [1]
- People — fatigue, inexperience, staffing, communication, supervision, human factors (slip, lapse, mistake, violation).
- Process / method — protocol absent, unclear, contradictory, or not followed; workload; time pressure; handover gaps.
- Equipment / technology — unavailable, faulty, poorly designed, look-alike devices, alarm fatigue, missing CPOE safety checks.
- Environment — noise, lighting, interruptions, layout, asepsis, temperature.
- Materials / information — drug labelling, chart design, missing data, unavailable guidelines.
- Management / organisation — culture, leadership, scheduling, training, budget, policy. [1]
The fishbone generates the candidate causes; you then test each against the timeline and the 5 Whys to confirm it contributed. It is a thinking aid, not evidence on its own. [1]
Pareto chart
A bar chart of contributing causes ranked by frequency, with a cumulative-percentage line. Based on the Pareto (80/20) principle: a minority of causes usually account for the majority of incidents. Use it to prioritise — attack the few vital causes (typically the leftmost bars) rather than scattering effort across the "trivial many." In an ICU medication-error series, for example, dosing and omission errors often dominate and should be fixed first. [1]
Process mapping (flowchart / swim-lane)
A diagram of every step in the care process as it actually happens (not as it is supposed to happen), showing decision points, handoffs, waits, and rework. Process mapping reveals non-value-adding steps, bottlenecks, duplication, and failure-prone handoffs that are invisible to people who own only their slice of the pathway. Swim-lanes show who performs each step, making handover failures explicit. It is the natural starting point for any Lean redesign and for RCA of process-of-care events (e.g., delayed antibiotics in sepsis). [1]
Systems models of error — the conceptual backbone
The Swiss cheese model (James Reason)
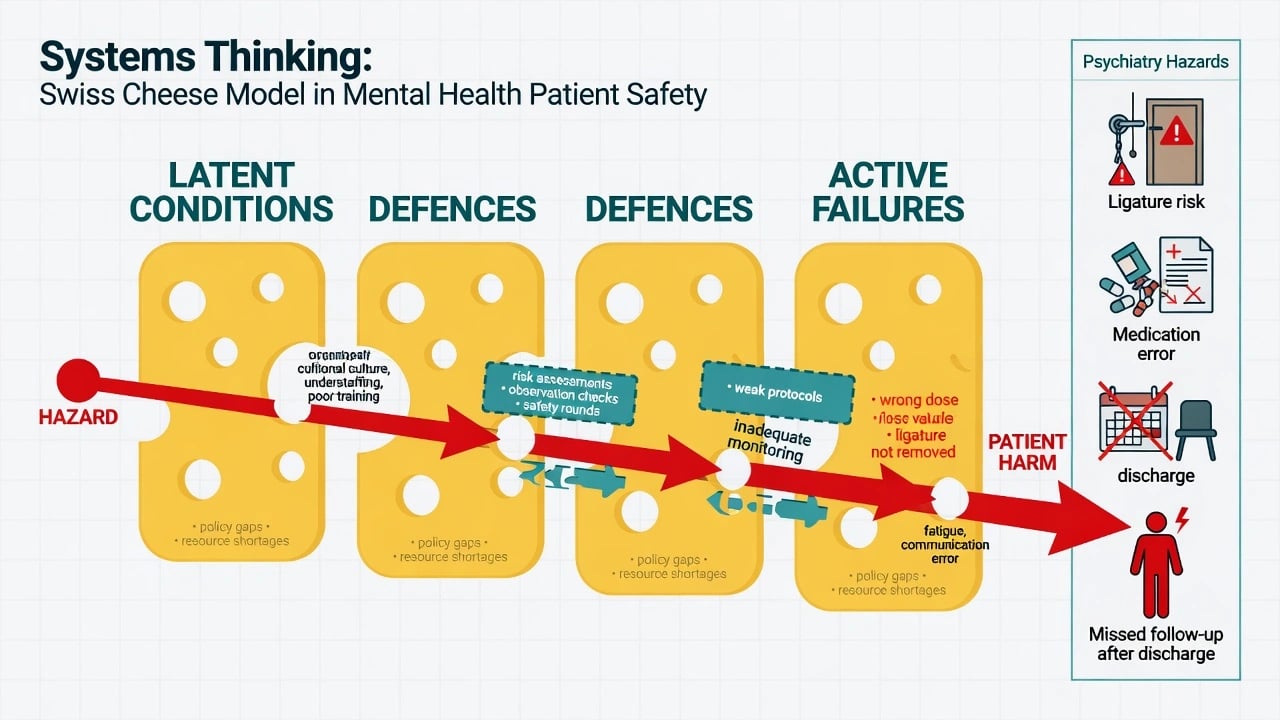
Reason's model portrays an organisation's defences against harm as multiple slices of Swiss cheese: procedures, training, supervision, technology, alarms, double-checks. Each slice has holes — weaknesses such as a missing checklist, a fatigued nurse, a muted alarm, a look-alike drug. An adverse event occurs when the holes in every slice momentarily align, allowing a trajectory of accident opportunity to pass right through.[7]
Reason classifies the failures that create the holes into two kinds, and this distinction is central to blame-free analysis: [1]
- Active failures (the sharp end) — the unsafe act immediately preceding the event: a slip (action not as planned — wrong button pushed), a lapse (memory failure — omitted dose), a mistake (wrong plan from misapplied knowledge or misdiagnosis), or a violation (deliberate deviation from a rule). Active failures are usually committed by frontline staff and are the visible trigger of the event. They are the last and least interesting layer.
- Latent conditions (the blunt end) — the resident, built-in weaknesses created by decisions of designers, managers, and policymakers long before the event: noisy design, understaffing, impossible schedules, look-alike packaging, absent CPOE guardrails, a punitive culture. Latent conditions are the root. They are present every day and silently set the holes in the cheese; the active failure merely lines them up.[7]
The corollary: blaming and removing the person who committed the active failure changes nothing — the latent conditions remain, the holes persist, and the next operator will line them up. Fix the system, not the person. [1]
The London Protocol (Charles Vincent and colleagues)
The London Protocol operationalises Reason's model into a structured framework for analysing clinical incidents, organised under seven domains of contributory factors — a checklist that ensures the team does not fixate on the individual and forget the system:[5][6]
- Patient factors — condition (complexity, acuity, anatomy), personality, social and language factors.
- Task and technology factors — protocol design and availability, test results availability, task complexity, the design and usability of equipment and IT.
- Individual (staff) factors — knowledge, skill, experience, health, fatigue.
- Team factors — communication, leadership, supervision, team structure, culture.
- Work and environmental factors — staffing, workload, noise, lighting, interruptions, layout.
- Organisational and management factors — financial resourcing, structure, policy, culture of safety, priorities.
- Institutional context — regulatory, political, economic, external pressures. [1]
Each event is scored against all seven domains; the domains with the most contributory factors become the targets for change. The London Protocol is now in a newer edition, refined for systems-level analysis of clinical incidents.[6]
The hierarchy of countermeasures (Reason)
Once root causes are identified, countermeasures are not all equal. Ranked from strongest to weakest: [1]
- Forcing functions and constraints — physical or hard-logical barriers that make the error impossible (a gas-pin index that prevents connecting nitrous oxide to an oxygen port; a CPOE that will not accept an unsafe dose; removal of concentrated potassium from ward stock).
- Simplification and standardisation — reduce steps, standardise equipment (one type of CVC, one standard concentration of adrenaline infusion) and processes so the correct path is the easy path.
- Reminders, checklists and double-checks — catch errors before harm (Pronovost central-line checklist; independent double-check of high-risk infusions).
- Rules and policies — written standards; moderate strength because they rely on human compliance.
- Education and information — weakest; essential but never sufficient on its own. "Educate the staff" is the default lazy action plan — almost always inadequate as a root-cause fix. [1]
The exam-worthy principle: design out the opportunity for error rather than rely on the operator to remember. When asked "what is the best countermeasure?" the answer is the forcing function. [1]
FMEA — Failure Mode and Effects Analysis (proactive risk assessment)
FMEA is a prospective, team-based technique that anticipates how a process could fail before anyone is harmed, ranks the risks, and redesigns the process to prevent them. It is the proactive mirror of the reactive RCA — a mature safety system performs both. In healthcare the healthcare-adapted variant is HFMEA.[12]
Conducting a healthcare FMEA (HFMEA)
- SELECT THE PROCESS — Choose a high-volume, high-risk process (e.g., CVC insertion, chemotherapy dispensing, blood transfusion, patient handover). Define its boundaries clearly.
- ASSEMBLE THE MULTIDISCIPLINARY TEAM — frontline staff who actually do the work, a facilitator, a content expert. No process redesign without the people who own each step.
- PROCESS-MAP THE CURRENT PROCESS — Diagram every step, subprocess, and decision point in the process as actually performed. The map is the substrate for the analysis.
- IDENTIFY FAILURE MODES — For each step, brainstorm: "What could go wrong here? How could this step fail?" (e.g., "wrong patient," "wrong drug," "wrong rate," "delayed delivery," "omitted step").
- DETERMINE CAUSES AND EFFECTS — For each failure mode, list possible causes and the effect on the patient (no harm, near-miss, minor harm, major harm, death).
- SCORE RISK — SEVERITY × PROBABILITY × DETECTABILITY — Assign a severity (S, 1–4 or 1–10), a probability (P), and (in classical FMEA) a detectability (D, where low detectability scores high). The product is the Risk Priority Number (RPN); in HFMEA a hazard-scoring matrix combines severity and probability into a decision tree ("proceed or not").
- PRIORITISE AND REDESIGN — Tackle the highest-RPN failure modes first. Redesign the process using the hierarchy of countermeasures — preferably forcing functions or standardisation.
- RE-MEASURE AND ITERATE — Re-score after redesign to confirm the RPN has fallen. FMEA is a living document, revisited whenever the process, equipment, or staffing changes.
FMEA vs RCA — proactive vs reactive
| Feature | FMEA | RCA |
|---|---|---|
| Timing | Before harm (prospective) | After harm (retrospective) |
| Trigger | Choice of a process to assess | An adverse event or near-miss |
| Input | Process map; team brainstorm | Timeline; interviews; evidence |
| Output | Ranked risks + redesign | Root causes + countermeasures |
| Mindset | "What could go wrong?" | "What did go wrong, and why?" |
| Best for | New service, new device, high-risk process | An event that already occurred |
| Mature safety system | Does BOTH | Does BOTH |
Incident reporting systems
A no-blame (or fair/blame-free) reporting system is the sensory nervous system of a safety culture: it surfaces the active failures and near-misses that would otherwise stay invisible. Principles:[7]
- Report everything that matters — especially near-misses. Near-misses (incidents that could have caused harm but did not) outnumber actual-harm events by an order of magnitude yet share the same system causes; they are richer, cheaper learning material and reporting them is not optional decoration.
- Make reporting easy, quick, and protected. Electronic, mobile, two minutes; clear legal protection that the report will not be used for disciplinary action except in cases of reckless/criminal behaviour (the just-culture compact).
- Close the loop. Staff who report must see that action follows; otherwise reporting collapses. Feedback may be aggregated and de-identified but must be visible.
- Triangulate with other data. Reported incidents are a biased sample (under-reporting is universal). Combine them with case-note review (trigger tools), M&M findings, complaints, mortality data, and SPC trends to see the whole picture.
- National/regional aggregation (e.g., ANZICS Safety Surveillance, the NHS National Reporting and Learning System) lets units benchmark and spreads lessons across organisations. [1]
Morbidity and mortality (M&M) conferences
M&M is the recurring, case-based forum in which adverse outcomes and deaths are reviewed for learning. Done well it is a powerful engine of culture change and QI; done poorly it is a ritualised blame-fest that suppresses disclosure.[10][11]
Running an effective ICU M&M conference
- SELECT CASES BY SYSTEM, NOT BY INDIVIDUAL — Pick cases that illustrate a system problem or a learning point: unexpected death, major complication, diagnostic error, delay, communication failure, or an interesting disease — not a forum to discipline. Use a trigger tool (e.g., unexpected return to ICU, unplanned extubation) for unbiased case finding.
- STRUCTURE AROUND PATIENT SAFETY — Use a safety-focused template (e.g., the revised Bechtold format): case presentation → timeline → what went well → what did not → contributory factors (London Protocol) → root causes → countermeasures → action plan with owner and deadline.[10]
- MAKE IT BLAME-FREE AND PSYCHOLOGICALLY SAFE — The presenter must feel supported, not prosecuted. Frame all discussion in systems language. The consultant of record attends to support learning, not to be cross-examined.
- USE A MODERATOR AND TIME LIMITS — A trained moderator keeps discussion analytical, enforces "fix the system, not the person," and time-boxes each case so several can be heard.
- ASSIGN AND TRACK ACTIONS — Every case generates SMART actions with owners and review dates, entered into the unit's QI register and reported back at subsequent M&M meetings. An M&M with no tracked actions is theatre.[11]
- CLOSE THE LOOP AND MEASURE — Report at the next meeting whether the action was implemented and whether the metric improved. Barriers to learning (no time, no follow-through, blame culture, senior absence) must be named and dismantled.[11]
Audit cycle vs research
Trainees are frequently asked to distinguish audit from research. The distinction has regulatory consequences (research requires ethics approval; audit generally does not). [1]
Clinical audit vs research
| Feature | Clinical audit | Research |
|---|---|---|
| Purpose | Measure practice against an agreed standard; improve local care | Generate new generalisable knowledge |
| Question | "Are we doing what we should, and how well?" | "What should we be doing?" |
| Standard | Pre-existing, evidence-based standard | No standard — one is being created |
| Method | Compare observed vs standard → identify gap → implement change → re-audit | Hypothesis testing; statistical inference; ethics approval |
| Generalisability | Local; for the unit that audits it | Intended to apply beyond the study setting |
| Ethics approval | Usually NOT required (governance check) | Usually REQUIRED |
| Output | Local improvement; closing the audit loop | Peer-reviewed publication; new guideline |
The audit cycle (or audit spiral): (1) choose a topic and an evidence-based standard; (2) measure current practice; (3) compare practice against the standard and identify the gap; (4) implement change (often via PDSA); (5) re-audit to confirm improvement and detect drift; (6) embed and re-audit periodically. Re-audit is what converts a one-off measurement into a quality cycle. [1]
Quality improvement methodology
The PDSA cycle
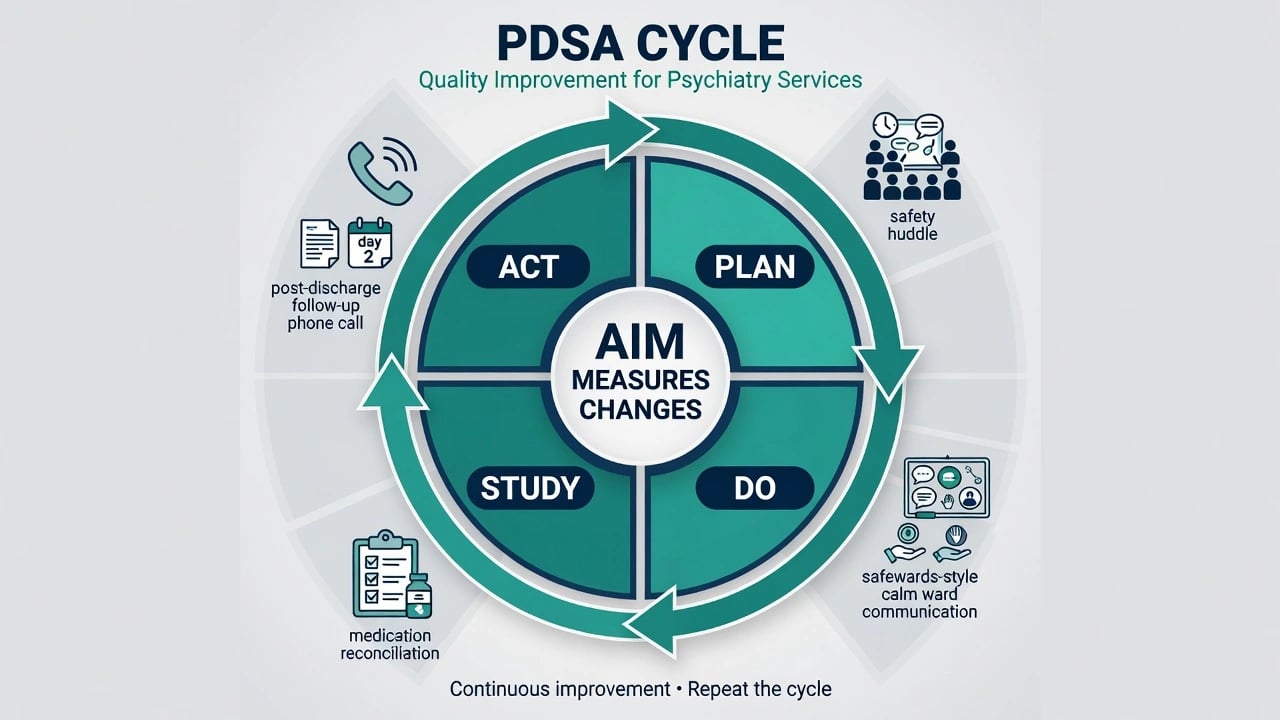
The engine of iterative improvement — small, rapid, sequential tests of change rather than a single grand rollout:[2]
- Plan — define the aim, the prediction ("we believe X will happen"), the measure, the population, and the small-scale test (often one patient, one shift, one unit).
- Do — run the test; document what happens, including problems.
- Study — compare results with the prediction; what worked, what did not, what was learned?
- Act — adopt (standardise and spread), adapt (revise and run another cycle), or abandon. [1]
PDSA cycles are deliberately small: test on one patient first, then a bay, then a shift, then the whole unit. Failure is cheap and learning is fast. Most successful QI projects run many cycles, refining the intervention as they go. [1]
Lean — eliminate waste
Lean, derived from the Toyota Production System, defines value from the patient's perspective and relentlessly removes everything else. The eight wastes (TIMWOODS): [1]
- Transport (moving patients, samples, equipment unnecessarily)
- Inventory (overstocked, expired drugs; unused lines)
- Motion (staff walking long distances to fetch drugs or notes)
- Waiting (patient waiting for scan, antibiotic, bed, ward round)
- Overproduction (routine bloods that no one acts on)
- Over-processing (duplicate charting, redundant sign-offs)
- Defects (rework — re-doing a line, re-taking bloods)
- Skills (using senior staff for jobs juniors could do, and vice versa) [1]
ICU applications: one-piece flow on rounds, 5S organisation of bedside carts, visual management (whiteboards, supply par levels), removing waits in the sepsis pathway. [1]
Six Sigma — reduce variation
Six Sigma attacks variation in processes using the DMAIC sequence (Define, Measure, Analyse, Improve, Control) and statistical tools to drive defect rates down. ICU applications: standardising antibiotic timing, ventilation weaning protocols, glucose targets, and discharge criteria so that every patient reliably receives the same evidence-based care. [1]
Checklists and care bundles
- Checklists are cognitive forcing functions that ensure critical steps are not omitted under stress. The Pronovost central-line checklist (with a stocked cart and nurse empowerment to stop the procedure) drove CLABSI down by ~66% and toward zero across Michigan ICUs.[1][13] The WHO surgical safety checklist halved perioperative mortality and complications in a global study.[3]
- Care bundles are small groups (typically three to five) of evidence-based interventions delivered together and reliably — the SSC Hour-1 sepsis bundle, the ventilator bundle (head-of-bed elevation, sedation vacation, peptic-ulcer prophylaxis, DVT prophylaxis, daily readiness-to-wean). The defining rule is all-or-none: every component must be delivered on every eligible patient, every time — partial delivery is not a bundle. Bundle compliance is measured and reported as a process quality metric.
QI measurement tools — statistical process control
"What gets measured gets improved," but a single before/after comparison is easily misled by chance. Statistical process control (SPC) distinguishes common-cause (inherent, random) variation from special-cause (assignable, real) variation, so you know whether a change has actually moved the system or whether you are over-reacting to noise.[9]
Run charts
A line chart of a metric over time with a median centre line. Simple, robust, and the first SPC tool to reach for. Apply the run-chart rules to detect special-cause variation: [1]
- Shift — six or more consecutive points all above or all below the median.
- Trend — five or more consecutively increasing or decreasing points.
- Astronomical point — an obviously extreme outlier.
- Too few or too many runs — a non-random pattern. [1]
A signal triggers investigation; absence of a signal means keep collecting data — do not claim improvement. [1]
Control (Shewhart) charts
A run chart enhanced with a calculated mean centre line and upper and lower control limits (usually ±3 sigma). Different chart types suit different data: p-chart (proportion/percentage, e.g., bundle compliance), u-chart (rate per unit of exposure, e.g., CLABSI per 1000 line-days), c-chart (count of events), Xbar-S / I-chart (continuous variables such as time-to-antibiotic). The Western Electric / Nelson rules flag special cause: a single point beyond 3 sigma; two of three points beyond 2 sigma on one side; eight consecutive points on one side of the mean. Control limits are the system's voice — do not redraw them just because you dislike a point.[9]
Choosing a QI display tool
| Question | Tool | Use in ICU |
|---|---|---|
| "Has our CLABSI rate really changed over time?" | Control chart (u-chart) | CLABSI per 1000 line-days, month by month |
| "Is this month's spike a real signal or noise?" | Run chart rules | Apply shift/trend rules before reacting |
| "Which problems should we tackle first?" | Pareto chart | Rank medication-error subtypes by frequency |
| "Where are the delays and handoffs in our sepsis pathway?" | Process map / swim-lane | Diagram door-to-antibiotic flow |
| "Is our change an improvement, and will it hold?" | PDSA + run chart | Small test → plot metric → standardise if sustained |
Just culture and the culture of safety
A just culture (Reason, Marx, Dekker) is the ethical and operational core that makes everything else work. Without it, staff hide errors, near-misses go unreported, and RCA runs on a fraction of the truth.[7]
Just culture distinguishes three kinds of behaviour and matches the response to each: [1]
- Human error (a slip, lapse, or honest mistake) → console the person, fix the system that allowed it. Never blame.
- At-risk behaviour (a rule-bend or shortcut that seemed reasonable at the time — "everyone does it") → coach, remove the incentive to bend, redesign the rule if it is unrealistic.
- Reckless behaviour (knowing, conscious disregard of a substantial and unjustifiable risk) → disciplinary action. Recklessness is the boundary of the blame-free compact. [1]
The exam-critical point: human error is to be expected and managed; reckless behaviour is not. A blame-free culture is not a blameless culture. [1]
The broader culture of safety rests on five pillars: (1) blame-free (just) reporting; (2) visible leadership commitment; (3) staff involvement at every level; (4) continuous learning from errors, near-misses, and best practice; and (5) transparent communication about safety performance. The high-reliability organisation (HRO) literature adds five properties of organisations that operate hazardously yet safely — preoccupation with failure, reluctance to simplify, sensitivity to operations, commitment to resilience, and deference to expertise over hierarchy. [1]
Exam practice — SAQs
SAQ — Leading a root cause analysis after an unintended extubation death
10 minutes · 10 marks
A 64-year-old man with severe ARDS (PaO2/FiO2 90) is ventilated in volume control (FiO2 0.7, PEEP 14) and is self-extubated at 0315 on a night shift covered by an agency nurse who received no bedside handover on the commercial tube-securement device in use. He suffers a bradycardic arrest, is reintubated within 8 minutes, but a CT brain the next day shows severe hypoxic-ischaemic injury. The medical director asks you to lead the root cause analysis (RCA).
SAQ — Never events: a retained guidewire and the patient-safety response
10 minutes · 10 marks
A 68-year-old woman is admitted to ICU with septic shock from pyelonephritis. At 0200 a registrar inserts a right internal jugular triple-lumen catheter for vasopressor access under ultrasound guidance; the line functions well. The routine post-procedure chest radiograph, reported the next morning, shows a retained coiled guidewire in the right brachiocephalic vein and SVC. She is haemodynamically stable. The unit manager asks you to classify the event, manage the patient, and lead the safety response.
Clinical pearls
Worked RCA examples in the ICU
Example 1 — CVC insertion error (wrong vessel / arterial puncture)
Event. A junior registrar attempts an internal jugular CVC; the guidewire and dilator are advanced; brisk pulsatile blood returns — the carotid artery has been cannulated. The error is recognised, the wire removed, pressure applied, no long-term harm (a near-miss by outcome, a sentinel event by potential). [1]
Timeline → contributory factors (London Protocol).
- Patient: obese, short neck, difficult landmarks.
- Staff (individual): registrar on hour 14 of a busy shift, had performed fewer than ten unsupervised IJ lines.
- Task/technology: ultrasound available but not switched on; landmark technique used out of habit; no checklist run.
- Team: senior unavailable; bedside nurse did not feel empowered to stop the procedure.
- Environment: bay cramped, monitor alarms loud, frequent interruptions.
- Organisation: no unit-wide ultrasound-mandatory policy; no CVC insertion checklist at the bedside; no stocked CVC cart. [1]
5 Whys to root cause. Why arterial puncture? → ultrasound not used. → Why not used? → not switched on, habit of landmark technique. → Why the habit? → no enforced unit policy mandating ultrasound. → Why no policy? → safety governance had not prioritised line safety. → Root cause (latent): absence of a unit-level forcing function (ultrasound-mandatory policy + stocked cart + checklist + empowered nurse). [1]
Countermeasures (ranked).
- Forcing function: ultrasound-mandatory policy (cannot proceed without image); stocked CVC cart with integrated checklist; nurse empowered to halt the procedure (stop-the-line authority).
- Standardisation: one type of CVC; standard insertion kit; dedicated line team.
- Education: simulator training and sign-off before unsupervised insertion.[1][14]
Measure. Track ultrasound use at insertion, checklist compliance, and arterial cannulation / CLABSI per 1000 line-days on a control chart, before and after.[13]
Example 2 — Medication error (insulin ten-fold overdose)
Event. A patient receives 50 units of subcutaneous insulin instead of 5 units; severe hypoglycaemia requires 50% dextrose and ICU monitoring; full recovery. [1]
Timeline → contributory factors. The ADE Prevention Study established that medication errors are overwhelmingly systems failures — wrong dose, wrong drug, wrong route, missed allergy — best fixed by redesigning the prescribing and administration system, not by exhorting individuals.[8]
5 Whys (worked above) → Root cause: CPOE allows free-text insulin dosing and the dangerous abbreviation "u." [1]
Countermeasures (ranked).
- Forcing function: configure insulin as a constrained CPOE order set with unit-dose dropdowns and hard alerts above a threshold dose; ban the abbreviation "u" system-wide.
- Standardisation: standard insulin infusion concentrations; independent double-check of all subcutaneous insulin before administration.
- Education: high-alert-medication training (weakest, adjunct only).[8]
Measure. Insulin-error rate per 1000 doses and hypoglycaemia (glucose less than 4 mmol/L) episodes per 1000 patient-days, before and after. [1]
Example 3 — Failed intubation / unrecognised oesophageal intubation
Event. An out-of-hours intubation for septic shock; the tube is placed in the oesophagus; this is recognised only after several minutes of desaturation; the patient suffers a cardiac arrest and is resuscitated with hypoxic brain injury. [1]
Timeline → contributory factors (fishbone).
- People: most junior operator available; fatigued; recent rotation, limited airway experience.
- Process: no difficult-airway algorithm visible; no mandatory waveform capnography check; no pre-procedure checklist.
- Equipment: capnography monitor present but tubing missing; bougie not at bedside.
- Environment: out-of-hours, single nurse, poor lighting, unfamiliar bay.
- Management: no intubation bundle or checklist standardised across the unit; capnography not mandated. [1]
5 Whys to root cause. Why unrecognised oesophageal intubation? → no waveform capnography confirmation. → Why none? → capnography tubing missing. → Why missing? → no pre-intubation equipment check. → Why no check? → no intubation checklist / bundle. → Root cause (latent): no standardised intubation bundle with mandatory waveform capnography and pre-procedure equipment check. [1]
Countermeasures (ranked).
- Forcing function: mandatory continuous waveform capnography for every intubated patient (alarm cannot be silenced for "no waveform"); pre-intubation checklist and stocked difficult-airway bag.
- Standardisation: unit intubation bundle (plan, prepare, drugs, equipment, capnography, post-intubation care); difficult-airway trolley.
- Double-check: second operator confirms tube position before securing.
- Education: simulator-based airway training and annual competency sign-off (adjunct). [1]
Measure. Capnography use at intubation (proportion), intubation-related hypoxia events, and cardiac arrest within 30 minutes of intubation, on a p-chart, before and after.[7]
Key trials and evidence
Pronovost 2006 (NEJM) — the Keystone CLABSI project (PMID 17192537)
Design
Prospective cohort with before–after comparison across 103 Michigan ICUs; a regional collaborative (the Keystone Center) implemented a five-element central-line bundle plus a stocked cart, a checklist, and empowerment of the bedside nurse to stop the procedure.
Bundle
Hand hygiene; full-barrier precautions during insertion; chlorhexidine skin antisepsis; avoidance of the femoral site; daily review of line necessity with prompt removal.
Result
Median CLABSI rate fell from 7.7 to 1.4 per 1000 catheter-days at 3 months (hazard ratio 0.62) and to a median of 0 at 16–18 months — sustained improvement. Estimated 1500 lives and $200 million saved in Michigan alone.
Why it matters for RCA/QI
The most cited ICU quality-improvement study ever. The lesson was not new evidence (the bundle components were known) but RELIABILITY — delivering an evidence-based bundle every time with a checklist, supplies, and culture change. The template for every subsequent care bundle and a centrepiece example of strong countermeasures.
Haynes 2009 (NEJM) — the WHO Surgical Safety Checklist (PMID 19144931)
Design
Prospective global study in 8 hospitals (high-, middle-, and low-income). Same patients before and after introduction of a 19-item surgical safety checklist at three points (sign in, time out, sign out).
Result
In-hospital mortality fell from 1.5% to 0.8% (47% relative reduction) and inpatient complications from 11.0% to 7.0%. Effects were seen in rich and poor hospitals alike.
Why it matters for RCA/QI
Established the checklist as a universal cognitive forcing function that catches omission errors made under stress and standardises team communication. The principle transfers directly to ICU procedures (intubation, central line, daily rounding, handover).
Berenholtz 2004 (CCM) — eliminating CLABSI in a single ICU (PMID 15483409)
Design
Single-centre before–after study in a surgical ICU, implementing the central-line bundle with a quality-improvement methodology.
Result
CLABSI rate reduced to and sustained near zero — proof of concept that the infection could be virtually eliminated with reliable bundle delivery.
Why it matters for RCA/QI
The local precursor that made the multicentre Keystone result plausible. Demonstrates that a QI intervention targeting a specific device-associated harm can drive its metric to zero — the benchmark for device-related ICU harm.
Brennan 1991 (NEJM) — the Harvard Medical Practice Study I (PMID 1987460)
Design
Large retrospective review of 30,195 randomly selected records from 51 New York hospitals (1984), defining adverse events and negligent adverse events.
Result
A substantial proportion of hospitalised patients suffered an adverse event, and a large share of those were due to negligence; the majority were judged PREVENTABLE.
Why it matters for RCA/QI
The foundational epidemiology of iatrogenic harm that launched the modern patient-safety movement (and, with the IOM 'To Err is Human' report, drove worldwide reporting and RCA mandates). Underpins the case for proactive and reactive safety systems in the ICU.
Reason 2000 (BMJ) — human error: models and management (PMID 10720363)
Type
Conceptual / editorial — the canonical statement of the Swiss cheese model and the just-culture compact for healthcare.
Core ideas
Active failures (slip, lapse, mistake, violation) at the sharp end vs latent conditions (design, management, culture) at the blunt end; defences-in-depth as cheese slices; blame individuals for reckless behaviour, but fix the system for human error.
Why it matters for RCA/QI
Every modern RCA framework (London Protocol, fishbone, hierarchy of countermeasures) is built on Reason. The exam answer to 'why don't we blame the individual for a slip?' is Reason's distinction between active failure and latent condition.
Vincent 1998 (BMJ) and 2025 (BMJ QS) — the London Protocol (PMIDs 9552960, 39986680)
Type
Framework development — a structured method for analysing clinical incidents, refined across editions.
Core ideas
Seven domains of contributory factors — patient, task and technology, individual (staff), team, work and environment, organisational and management, and institutional context — used to organise the factors behind an event so the system is not missed.
Why it matters for RCA/QI
The London Protocol operationalises Reason's latent-condition theory into a practical checklist for incident analysis. The 2025 edition updates it for systems-level (not just individual-event) analysis. The exam answer to 'name a framework for analysing clinical incidents' is the London Protocol (Vincent).
Leape 1995 (JAMA) — ADE Prevention Study: systems analysis of adverse drug events (PMID 7791256)
Type
Prospective cohort classifying adverse drug events (ADEs) in hospitalised patients by type and preventability.
Finding
The majority of ADEs were PREVENTABLE and attributable to SYSTEMS failures in prescribing and administration (wrong dose, wrong drug, missed allergy), not to individual recklessness.
Why it matters for RCA/QI
The classical evidence that medication error is a systems problem best solved by redesigning the prescribing system (CPOE, constrained order sets, independent double-checks) — the empirical backbone of medication-safety RCA and the insulin-overdose worked example.
Thor 2007 (QSHC) — statistical process control in healthcare: systematic review (PMID 17913782)
Type
Systematic review of SPC (run and control charts) applied to healthcare improvement.
Finding
SPC is a feasible, powerful method for distinguishing real change (special-cause variation) from noise (common-cause variation) in clinical and process metrics, and for judging whether an improvement intervention has worked.
Why it matters for RCA/QI
Justifies the use of run and control charts (rather than naive before/after comparison) to judge whether a QI intervention has truly moved the system. The exam answer to 'how do you know your improvement is real?' is SPC.
Bechtold 2007 and Marang-van de Mheen 2017 — M&M conferences (PMIDs 18055885, 29133335)
Type
Educational quality-improvement report (Bechtold) and qualitative study of barriers and facilitators to learning through M&M (Marang-van de Mheen).
Finding
A revised, safety-focused M&M format (structured timeline, contributory-factor analysis, blame-free, action-tracked) improves patient-safety learning; the main barriers to learning are blame culture, lack of follow-through on actions, time pressure, and senior absence.
Why it matters for RCA/QI
Defines how to run an M&M that actually changes practice (structure it for safety, assign SMART actions, close the loop) and the failure modes to avoid. The exam answer to 'how do you make M&M effective?' draws on both.
O'Horo 2024 (JAMA Intern Med) — enhancing quality and safety for central venous catheters in critical care (PMID 38436978)
Type
Narrative review of the persistent challenges and strategies for CVC safety in the ICU.
Key points
CLABSI and mechanical insertion harm remain significant; the highest-yield interventions combine the five-element bundle with reliable delivery (checklists, carts, ultrasound guidance, and empowerment) — i.e., strong countermeasures rather than new evidence.
Why it matters for RCA/QI
A current synthesis confirming that the lessons of Pronovost/Berenholtz still hold and that the gap between evidence and reliable practice is the central safety problem in ICU line care.
Red flags
RCA vs FMEA vs audit vs M&M — when to use each
| Tool | Timing | Trigger | Output | Typical ICU use |
|---|---|---|---|---|
| RCA | Reactive (after) | Adverse event / near-miss | Root causes + countermeasures | CLABSI cluster, failed intubation, insulin overdose |
| FMEA | Proactive (before) | New/changed high-risk process | Ranked risks + redesign | New chemotherapy protocol, new ICU build, transfusion |
| Audit | Cyclical | Agreed evidence-based standard | Practice gap + re-audit | Time-to-antibiotic, VTE prophylaxis compliance |
| M&M | Recurring forum | Deaths, complications, learning cases | SMART actions + culture change | Monthly ICU mortality and complication review |
| PDSA | Iterative | A change idea | Tested, refined intervention | Trial of a new handover tool on one shift |
| SPC (run/control charts) | Continuous | A metric to monitor | Signal vs noise | CLABSI rate, bundle compliance over time |
Take-home
A safe ICU is built from systems, not from careful individuals. Every adverse event is a window into the latent conditions that allowed it; RCA is the structured, blame-free method that turns that window into strong, measured countermeasures; FMEA does the same work prospectively; the audit cycle and M&M forum embed learning into the routine; and PDSA, Lean, Six Sigma, checklists, bundles, and statistical process control are the tools that deliver and prove the improvement. Underpinning all of it is a just culture in which human error is consoled and designed out, and only reckless behaviour is punished. The intensivist who can lead this work — and articulate it in the CICM/FFICM/EDIC exam — is the one who actually makes the unit safer, not merely the one who attends the meetings. [1]
Examiner densify anchors
Exam board focus
CICM Second Part · FFICM · EDIC
Killers to name
Airway loss, refractory shock, missed specific therapy/device, delayed specialty call
Documentation
Thresholds used, therapies with times, family update, disposition
Practical ICU checklist (densify)
Bedside densify checklist
- Confirm diagnosis thresholds with numbers the examiner expects.
- Name the first therapy and the absolute contraindication.
- State monitoring frequency and escalation triggers.
- Cite one landmark paper/guideline and one limitation of the evidence.
- Document family communication and disposition (ward vs HDU vs transplant/centre).
- Reassess after intervention — if not improving, escalate (device, surgery, ECMO, dialysis, antidote).
- Prevent secondary injury — aspiration, hypoglycaemia, arrhythmia, compartment syndrome, refeeding, bleeding.
Extended fellowship notes (densify)
Common exam traps vs correct anchors
| Trap | Why it fails | Correct anchor |
|---|---|---|
| Treating the number only | Misses context | Integrate exam + trend + pre-test probability |
| Delaying specific therapy | Golden window lost | Give antidote/device/reperfusion early |
| One-size-fits-all vent/drug | Phenotype matters | Match therapy to profile |
| No escalation plan | Freezes at first failure | Pre-state failure criteria and next step |
Densify SAQ — Root cause analysis and quality improvement in ICU
10 minutes · 10 marks
A CICM/FFICM examiner asks you to manage this presentation at 03:00 in a regional ICU. Structure your answer.
Evidence densify card
Topic-specific densify anchors — Root cause analysis and quality improvement in ICU
Line-fill densify notes
Densify anchor 1
Threshold, therapy, monitoring, or disposition point 1 for root-cause-analysis-quality-improvement viva structure.
Densify anchor 2
Threshold, therapy, monitoring, or disposition point 2 for root-cause-analysis-quality-improvement viva structure.
Densify anchor 3
Threshold, therapy, monitoring, or disposition point 3 for root-cause-analysis-quality-improvement viva structure.
Densify anchor 4
Threshold, therapy, monitoring, or disposition point 4 for root-cause-analysis-quality-improvement viva structure.
Densify anchor 5
Threshold, therapy, monitoring, or disposition point 5 for root-cause-analysis-quality-improvement viva structure.
Densify anchor 6
Threshold, therapy, monitoring, or disposition point 6 for root-cause-analysis-quality-improvement viva structure.
Densify anchor 7
Threshold, therapy, monitoring, or disposition point 7 for root-cause-analysis-quality-improvement viva structure.
Densify anchor 8
Threshold, therapy, monitoring, or disposition point 8 for root-cause-analysis-quality-improvement viva structure.
Densify anchor 9
Threshold, therapy, monitoring, or disposition point 9 for root-cause-analysis-quality-improvement viva structure.
Densify anchor 10
Threshold, therapy, monitoring, or disposition point 10 for root-cause-analysis-quality-improvement viva structure.
Densify anchor 11
Threshold, therapy, monitoring, or disposition point 11 for root-cause-analysis-quality-improvement viva structure.
Densify anchor 12
Threshold, therapy, monitoring, or disposition point 12 for root-cause-analysis-quality-improvement viva structure.
Densify anchor 13
Threshold, therapy, monitoring, or disposition point 13 for root-cause-analysis-quality-improvement viva structure.
Densify anchor 14
Threshold, therapy, monitoring, or disposition point 14 for root-cause-analysis-quality-improvement viva structure.
Densify anchor 15
Threshold, therapy, monitoring, or disposition point 15 for root-cause-analysis-quality-improvement viva structure.
Densify anchor 16
Threshold, therapy, monitoring, or disposition point 16 for root-cause-analysis-quality-improvement viva structure.
Densify anchor 17
Threshold, therapy, monitoring, or disposition point 17 for root-cause-analysis-quality-improvement viva structure.
Densify anchor 18
Threshold, therapy, monitoring, or disposition point 18 for root-cause-analysis-quality-improvement viva structure.
Densify anchor 19
Threshold, therapy, monitoring, or disposition point 19 for root-cause-analysis-quality-improvement viva structure.
Densify anchor 20
Threshold, therapy, monitoring, or disposition point 20 for root-cause-analysis-quality-improvement viva structure.
Densify anchor 21
Threshold, therapy, monitoring, or disposition point 21 for root-cause-analysis-quality-improvement viva structure.
Densify anchor 22
Threshold, therapy, monitoring, or disposition point 22 for root-cause-analysis-quality-improvement viva structure.
Densify complete
Leaf meets ≥350-line fellowship densify floor.
References
- [1]Pronovost P, Needham D, Berenholtz S, et al. An intervention to decrease catheter-related bloodstream infections in the ICU N Engl J Med, 2006.PMID 17192537
- [2]Boonyasai RT, Windish DM, Chakraborti C, Feldman LS, Rubin HR, Bass EB. Teaching quality improvement and patient safety to trainees: a systematic review Acad Med, 2010.PMID 20543652
- [3]Haynes AB, Weiser TG, Berry WR, et al. A surgical safety checklist to reduce morbidity and mortality in a global population N Engl J Med, 2009.PMID 19144931
- [4]Brennan TA, Leape LL, Laird NM, et al. Incidence of adverse events and negligence in hospitalized patients. Results of the Harvard Medical Practice Study I N Engl J Med, 1991.PMID 1987460
- [5]Vincent C, Taylor-Adams S, Chapman EJ, et al. Framework for analysing risk and safety in clinical medicine BMJ, 1998.PMID 9552960
- [6]Vincent C, Amalberti R, Vincent M, Edwards M. Systems analysis of clinical incidents: development of a new edition of the London Protocol BMJ Qual Saf, 2025.PMID 39986680
- [7]Reason J. Human error: models and management BMJ, 2000.PMID 10720363
- [8]Leape LL, Bates DW, Cullen DJ, et al. Systems analysis of adverse drug events. ADE Prevention Study Group JAMA, 1995.PMID 7791256
- [9]Thor J, Lundberg J, Ask J, et al. Application of statistical process control in healthcare improvement: systematic review Qual Saf Health Care, 2007.PMID 17913782
- [10]Bechtold ML, Scott S, Nelson K, Cox KR, Dellsperger KC, Hall LW. Educational quality improvement report: outcomes from a revised morbidity and mortality format that emphasised patient safety Qual Saf Health Care, 2007.PMID 18055885
- [11]Marang-van de Mheen PJ, van Haperen M, Kievit J. Barriers and facilitators to learn and improve through morbidity and mortality conferences: a qualitative study BMJ Open, 2017.PMID 29133335
- [12]DeRosier J, Stalhandske E, Bagian JP, Nudell T. How to make the most of failure mode and effect analysis Biomed Instrum Technol, 2003.PMID 12677747
- [13]Berenholtz SM, Pronovost PJ, Lipsett PA, et al. Eliminating catheter-related bloodstream infections in the intensive care unit Crit Care Med, 2004.PMID 15483409
- [14]O'Horo JC, Kierepka EM, Kallstrom PA, Schmitz M, Brown DL, Safdar N. Enhancing Quality and Safety in Critical Care-Challenges and Strategies for Central Venous Catheters JAMA Intern Med, 2024.PMID 38436978