ICU · renal-metabolic
Systematic Arterial Blood Gas Interpretation — Comprehensive
Also known as Blood gas interpretation · ABG analysis · Acid-base interpretation · Anion gap · GOLDMARK · Delta gap · A-a gradient · Osmolar gap · Compensation equations
Systematic arterial blood gas (ABG) interpretation — the 10-step approach to analysing every ABG in ICU. Step 1: pH (acidosis <7.35, alkalosis 7.45). Step 2: PaCO2 (respiratory — high = acidosis, low = alkalosis). Step 3: HCO3 (metabolic — low = acidosis, high = alkalosis). Step 4: Determine primary disorder (pH direction matches primary disorder). Step 5: Check compensation (expected PaCO2 for metabolic, expected HCO3 for respiratory — if compensation is INADEQUATE → mixed disorder). Step 6: A-a gradient (PAO2 - PaO2 — normal <15 young, <25 elderly — elevated = V/Q mismatch/shunt/diffusion). Step 7: Anion gap (Na - Cl - HCO3 — normal 8-12 — elevated = unmeasured anions [GOLDMARK: Glycols, Oxoproline, L-lactate, D-lactate, Methanol, Aspirin, Renal failure, Ketoacidosis]). Step 8: Delta gap ((AG-12)/(24-HCO3) — ratio 1.0 = pure AG acidosis, <1.0 = combined AG + non-AG acidosis, 2.0 = combined AG acidosis + metabolic alkalosis). Step 9: Osmolar gap (measured - calculated — elevated = toxic alcohols). Step 10: Lactate (elevated = tissue hypoperfusion/anaerobic metabolism). Common ICU patterns: sepsis (metabolic acidosis + respiratory alkalosis), COPD (respiratory acidosis + metabolic compensation), DKA (high AG metabolic acidosis + respiratory compensation), renal failure (high AG + non-AG metabolic acidosis).
On this page & tools
Your progress
Saved locally on this device.
Target exams
Red flags
Overview

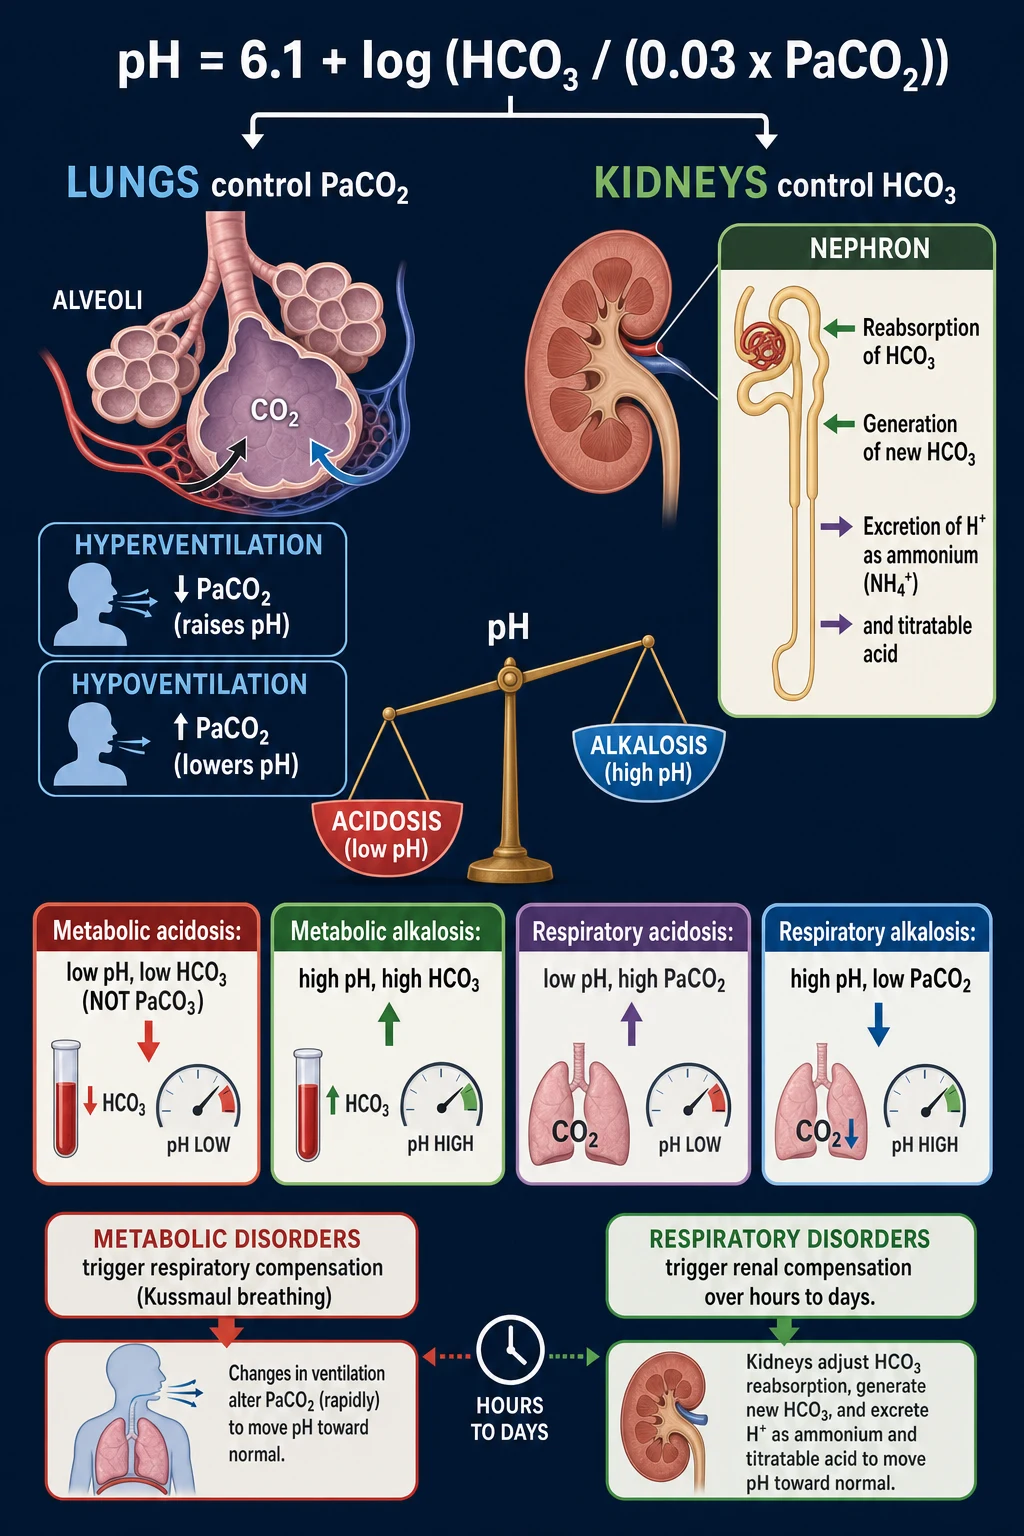
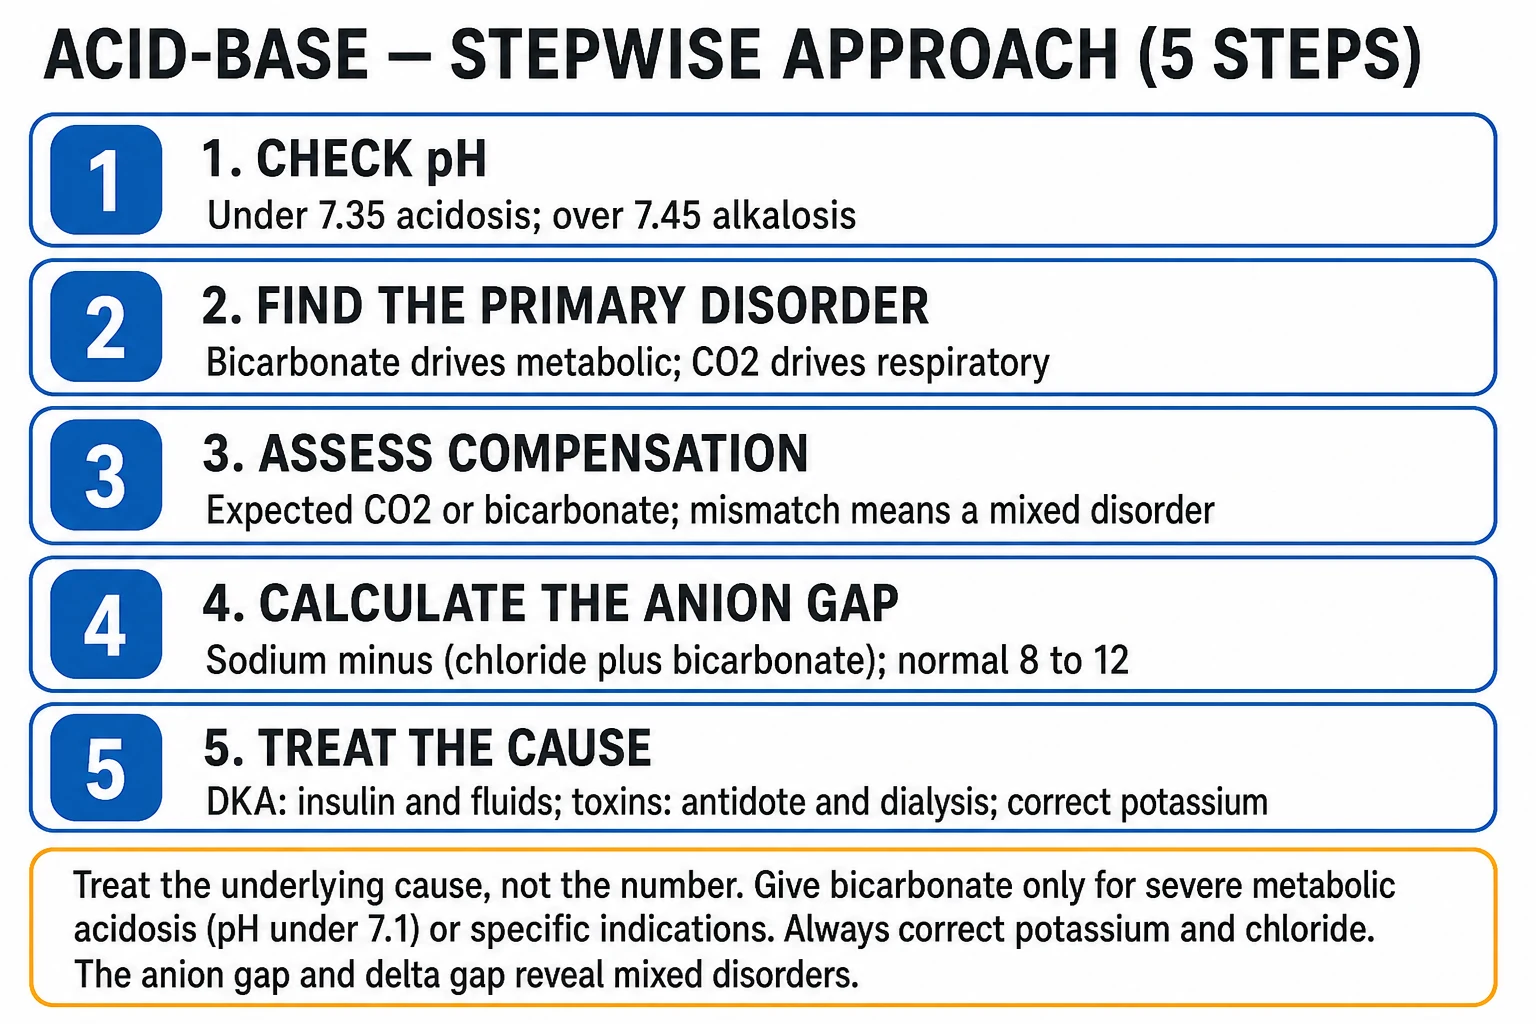
The 10-step systematic approach
ABG interpretation — the 10-step method
- pH: <7.35 = acidosis. >7.45 = alkalosis. 7.35-7.45 = normal (may be compensated or mixed disorder)
- PaCO2 (respiratory): >45 = respiratory acidosis (hypoventilation). <35 = respiratory alkalosis (hyperventilation). Normal = 35-45 mmHg
- HCO3 (metabolic): <22 = metabolic acidosis. >26 = metabolic alkalosis. Normal = 22-26 mmol/L
- PRIMARY DISORDER: The direction of pH change tells you the PRIMARY disorder. Low pH → either respiratory acidosis (high PaCO2) or metabolic acidosis (low HCO3). Whichever one MATCHES the pH direction is the primary. If BOTH match → both are contributing (mixed). If pH is normal but both are abnormal → mixed disorder
- COMPENSATION: Is the compensatory response appropriate?
- Metabolic acidosis → expected PaCO2 = (1.5 × HCO3) + 8 ± 2 (Winter's formula). If ACTUAL PaCO2 > expected → ADDITIONAL respiratory acidosis. If ACTUAL PaCO2 < expected → ADDITIONAL respiratory alkalosis
- Metabolic alkalosis → expected PaCO2 = (0.7 × HCO3) + 20 ± 5
- Respiratory acidosis (acute) → ΔHCO3 = 0.1 × ΔPaCO2 (for every 10 mmHg rise in PaCO2, HCO3 rises by 1). If HCO3 rises MORE than expected → ADDITIONAL metabolic alkalosis
- Respiratory acidosis (chronic, >3-5 days) → ΔHCO3 = 0.35 × ΔPaCO2 (for every 10 mmHg rise in PaCO2, HCO3 rises by 3.5). Renal compensation takes 3-5 days to maximise
- Respiratory alkalosis (acute) → ΔHCO3 = 0.2 × ΔPaCO2. Chronic → ΔHCO3 = 0.5 × ΔPaCO2
- A-a GRADIENT = PAO2 - PaO2. PAO2 from alveolar gas equation: FiO2(713) - PaCO2/0.8. Normal <15 (young), <25 (elderly). Elevated = V/Q mismatch, shunt, diffusion impairment, low FiO2
- ANION GAP = Na - (Cl + HCO3). Normal 8-12 (CORRECT for albumin: AG + 2.5 × (40 - albumin g/L) — low albumin masks elevated AG). Elevated AG (>12) = unmeasured anions. Mnemonic GOLDMARK: Glycols (ethylene glycol), Oxoproline (paracetamol), L-lactate, D-lactate (short bowel), Methanol, Aspirin, Renal failure (urate + phosphate + sulphate), Ketoacidosis (diabetic + alcoholic + starvation)
- DELTA GAP (delta-delta): (AG - 12) / (24 - HCO3). Ratio 1.0 = pure AG metabolic acidosis (AG rise matches HCO3 fall). <1.0 = combined AG + non-AG acidosis (HCO3 fell MORE than AG rose → additional source of acid: diarrhoea, renal tubular acidosis, saline). >2.0 = combined AG acidosis + metabolic alkalosis (HCO3 fell LESS than AG rose → something is PUSHING HCO3 up: vomiting, diuretics). =2.0 = AG acidosis + metabolic alkalosis
- OSMOLAR GAP = measured osmolality - calculated osmolality (2 × Na + glucose + urea + ethanol). Normal <10 mOsm/kg. Elevated >20 = toxic alcohols (methanol, ethylene glycol). HIGH anion gap + HIGH osmolar gap = toxic alcohol poisoning (methanol, ethylene glycol). HIGH anion gap + NORMAL osmolar gap = lactate, ketoacidosis, renal failure, salicylate, oxoproline
- LACTATE: >2 mmol/L = hyperlactataemia. >4 = severe (shock). Check also: glucose (DKA), electrolytes (AKI), troponin (cardiac), toxicology screen
The GOLDMARK mnemonic — causes of elevated anion gap metabolic acidosis
GOLDMARK — elevated anion gap metabolic acidosis causes
| Letter | Cause | Toxin/Metabolite | Diagnosis clue |
|---|---|---|---|
| G | Glycols (ethylene glycol, propylene glycol) | Glycolic acid, oxalic acid | Calcium oxalate crystals in urine. HIGH AG + HIGH osmolar gap. Fluorescence under Wood's lamp. Antifreeze ingestion |
| O | Oxoproline (5-oxoproline) | 5-oxoproline accumulation | Chronic paracetamol/glutathione depletion (especially female, sepsis, malnutrition). Paracetamol level may be therapeutic |
| L | L-lactate | Lactic acid | Sepsis (#1), shock, ischaemia (mesenteric, limb), metformin, malignancy, CO poisoning. Lactate level elevated |
| D | D-lactate | D-lactic acid | Short bowel syndrome → bacterial fermentation → D-lactate (NOT measured by standard lactate assay → specific D-lactate assay needed). Neurological symptoms (confusion, ataxia) |
| M | Methanol | Formic acid | Visual disturbances (blindness). HIGH AG + HIGH osmolar gap. Retinal oedema on fundoscopy |
| A | Aspirin (salicylate) | Salicylic acid | Tinnitus, hyperventilation, mixed respiratory alkalosis + metabolic acidosis. Salicylate level elevated |
| R | Renal failure | Phosphate, sulphate, urate | CKD/AKI with elevated creatinine. HIGH AG + NORMAL osmolar gap |
| K | Ketoacidosis | β-hydroxybutyrate, acetoacetate | DKA (glucose >11, pH <7.3, ketones), alcoholic (history of alcohol abuse, low glucose), starvation (low glucose, chronic illness) |
Compensation equations — the critical calculations
Acid-base compensation equations — memorise these
| Primary disorder | Compensation equation | Time to full compensation | Example |
|---|---|---|---|
| Metabolic acidosis | Expected PaCO2 = (1.5 × HCO3) + 8 ± 2 | Immediate (respiratory) | HCO3 12 → expected PaCO2 = (1.5 × 12) + 8 = 26 ± 2. If actual PaCO2 = 26 → appropriate compensation. If PaCO2 = 35 → ADDITIONAL respiratory acidosis. If PaCO2 = 20 → ADDITIONAL respiratory alkalosis |
| Metabolic alkalosis | Expected PaCO2 = (0.7 × HCO3) + 20 ± 5 | Immediate (respiratory) | HCO3 36 → expected PaCO2 = (0.7 × 36) + 20 = 45 ± 5 |
| Respiratory acidosis (acute) | ΔHCO3 = 0.1 × ΔPaCO2 | Minutes-hours | PaCO2 60 (Δ=20) → HCO3 rises by 2 (to 26) |
| Respiratory acidosis (chronic) | ΔHCO3 = 0.35 × ΔPaCO2 | 3-5 days (renal) | PaCO2 60 (Δ=20) → HCO3 rises by 7 (to 29) |
| Respiratory alkalosis (acute) | ΔHCO3 = 0.2 × ΔPaCO2 | Minutes-hours | PaCO2 20 (Δ=-20) → HCO3 falls by 4 (to 20) |
| Respiratory alkalosis (chronic) | ΔHCO3 = 0.5 × ΔPaCO2 | 2-3 days (renal) | PaCO2 20 (Δ=-20) → HCO3 falls by 10 (to 14) |
Clinical pearls
Red flags
Prognosis
Acid-base disorder outcomes — key prognostic markers
| Marker | Threshold | Outcome | Notes |
|---|---|---|---|
| pH <7.20 | Severe acidosis | 40-50% mortality | BICAR-ICU: bicarbonate may help if AKI present |
| Lactate >4 | Severe hyperlactataemia | 20-30% mortality | Tissue hypoperfusion — aggressive resuscitation |
| Base excess < -10 | Severe metabolic acidosis | 50%+ mortality | Marker of illness severity |
| PaCO2 >80 | Severe hypercapnia | Risk of CO2 narcosis | Need mechanical ventilation |
Key trials and evidence
BICAR-ICU trial — Bicarbonate for severe metabolic acidosis (PMID 29766337)
Study design
Randomised — 389 ICU patients with severe metabolic acidosis (pH 7.20)
Population
ICU patients with pH 7.20 ± 0.05
Intervention
4% sodium bicarbonate vs no bicarbonate
Primary outcome
28-day mortality: 46% (bicarbonate) vs 50% (control) — NOT significant overall
Subgroup (AKI grade 2-3)
Bicarbonate REDUCED mortality (55% vs 70%, p=0.03) AND reduced RRT need (46% vs 65%)
Clinical bottom line
Consider bicarbonate for severe metabolic acidosis (pH <7.20) in patients with AKI — but treat the underlying cause, not just the number
The Stewart (physicochemical) approach to acid-base
The traditional Henderson-Hasselbalch / bicarbonate-centred approach (the 10-step method above) works well for the bedside, but it cannot fully explain why the bicarbonate changed — bicarbonate is itself a dependent variable, dragged around by independent forces. Peter Stewart (1981) reframed acid-base as a problem of physical chemistry governed by three independent variables that the body or the clinician manipulates, with everything else (including pH, HCO3−, and the acid-base disorders themselves) being a dependent consequence.[7][9]
The three independent variables
Stewart showed that the hydrogen ion concentration of any body fluid compartment is determined by exactly three independent variables: [1]
- The partial pressure of CO2 (PaCO2) — set by alveolar ventilation. The ONLY respiratory independent variable.
- The strong ion difference (SID) — the difference between the sum of fully dissociated ("strong") cations and fully dissociated ("strong") anions. SID = (Na+ + K+ + Ca2+ + Mg2+) − (Cl− + lactate− + other strong anions). Approximated at the bedside as SIDa ≈ Na+ − Cl− (apparent SID), normally ~38–42 mEq/L in plasma. SID is set by the kidney (Cl− handling), the gut (diarrhoea/vomiting), and the clinician (fluid choice).
- The total concentration of weak acids (Atot) — predominantly albumin and inorganic phosphate. Atot is set by liver synthesis, nutrition, and renal excretion. [1]
Everything else — pH, HCO3−, the anion gap — is a dependent variable. The body does not "regulate bicarbonate"; it regulates SID (by chloride handling) and CO2 (by ventilation), and bicarbonate follows passively.[7]
Stewart — independent vs dependent variables
| Independent variables (the body manipulates these) | Dependent variables (these follow passively) |
|---|---|
| PaCO2 (ventilation) | pH |
| Strong ion difference (SID) — Na+, K+, Ca2+, Mg2+ minus Cl−, lactate | HCO3− (bicarbonate) |
| Total weak acids (Atot) — albumin, phosphate | Anion gap, base excess, strong ion gap (SIG) |
How the three variables determine pH — the governing equation
Stewart derived a fourth-order polynomial showing that H+ is governed by the relationship between SID, Atot, and PaCO2 (via carbonic acid). Three rules capture the bedside behaviour: [1]
- A FALL in SID → acidosis. Adding chloride (0.9% saline, KCl, HCl) reduces Na−Cl, so SID falls, and pH falls. This is the mechanism of hyperchloraemic (non-anion gap) metabolic acidosis. Adding a "new" unmeasured strong anion (lactate, ketones, sulphate, toxic alcohol metabolites) also lowers the effective SID and causes acidosis.
- A RISE in SID → alkalosis. Losing chloride (vomiting, diuretics, gastric suction) raises Na−Cl, so SID rises, and pH rises. This is the mechanism of contraction / chloride-depleted metabolic alkalosis.
- A FALL in Atot → alkalosis; a RISE in Atot → acidosis. Hypoalbuminaemia (ubiquitous in ICU) lowers Atot and causes a metabolic ALKALOSIS, masking an underlying acidosis (this is why the albumin-corrected anion gap matters). Hyperphosphataemia (renal failure) raises Atot and contributes to acidosis. [1]
The strong ion gap (SIG) — Stewart's "unmeasured anions"
The anion gap is confounded by albumin and by changes in SID itself. Stewart's solution is the strong ion gap (SIG): the difference between the apparent SID (SIDa, from Na/K/Ca/Mg − Cl/lactate) and the effective SID (SIDe, calculated from the charge needed to balance Atot and CO2 at the observed pH). In health SIG ≈ 0. A positive SIG (>2 mEq/L) = unmeasured strong anions (the same toxins as GOLDMARK — lactate, ketones, toxic alcohols, renal acids) but uncorrected by albumin or fluid-induced SID changes.[13][9]
- SIDa (apparent) ≈ Na+ + K+ + 2.4 × (Ca2+ + Mg2+) − Cl− − lactate (normal ~40)
- SIDe (effective) = the anionic charge contributed by albumin and phosphate at the measured pH ≈ 2.8 × albumin(g/L) × (1.15 − 0.05 × pH) + phosphate × 0.32 (normal ~40)
- SIG = SIDa − SIDe (normal ~0–2 mEq/L). Elevated SIG = unmeasured anions = the Stewart equivalent of a high anion gap, but robust to hypoalbuminaemia and hyperchloraemia. [1]
When the Stewart approach changes management
The physicochemical approach is not a replacement for the 10-step method at the bedside — it is a complementary lens that explains and detects three things the traditional approach misses:[9][13]
- Why saline causes acidosis. 0.9% saline has SID = 0 (equal Na and Cl). Infusing it lowers plasma SID → hyperchloraemic acidosis — not detected as an "anion gap" problem because the AG stays normal. The Stewart lens makes the mechanism obvious (and drives the move to balanced crystalloids).
- The hidden acid load in critical illness. Unmeasured anions (SIG) accumulate in sepsis, ischaemia, and renal failure even when the traditional anion gap and lactate are "normal" — the SIG detects them. A rising SIG in a septic patient is an early marker of occult hypoperfusion.
- The albumin effect. Hypoalbuminaemic alkalosis hides a coexisting high-AG acidosis. Correcting for albumin (traditional) or calculating the SIG (Stewart) unmasks it. [1]
Traditional vs Stewart approach — when to use which
| Feature | Traditional (Henderson-Hasselbalch) | Stewart (physicochemical) |
|---|---|---|
| Core variables | PaCO2, HCO3− (and AG) | PaCO2, SID, Atot |
| What it explains | What the disorder is | Why it occurred (mechanism) |
| Bedside speed | Fast (10-step) | Slower (more calculations) |
| Detects hyperchloraemic acidosis | Yes (via delta-delta / AG) but mechanism opaque | Yes — and explains it (low SID) |
| Robust to hypoalbuminaemia | Only if AG corrected for albumin | Yes (SIG inherently accounts for Atot) |
| Detects occult unmeasured anions | Via AG (confounded) | Via SIG (unconfounded) — more sensitive in ICU |
| Best use | Daily bedside interpretation | Research, complex/mixed disorders, understanding fluid effects |
Base excess and standard base excess
Base excess (BE) and standard base excess (SBE) quantify the magnitude of the metabolic (non-respiratory) component of an acid-base disorder, expressed as the amount of strong acid or base (in mmol/L) needed to titrate blood back to pH 7.40 at a PaCO2 of 40 mmHg.[8]
- Base excess (BE / actual base excess, ABE): calculated on the actual in-vivo blood at the patient's own PaCO2. Because PaCO2 changes shift BE, it is influenced by acute respiratory changes — a patient hyperventilating to PaCO2 20 will have an artefactually altered BE. ABE is therefore less reliable in acute respiratory disorders.
- Standard base excess (SBE): calculated on fully oxygenated blood standardised to PaCO2 40 mmHg and haemoglobin ~30–60 g/L (the average extracellular haemoglobin concentration, reflecting the whole extracellular fluid not just the blood). Because it removes the respiratory variable, SBE is the more accurate index of the pure metabolic component and is the value reported on most blood gas analysers.[8]
Interpretation
- SBE = 0 ± 2 mmol/L — normal metabolic component.
- SBE < −2 — metabolic acidosis (magnitude = how many mmol of base would be needed to correct). SBE −10 = severe.
- SBE > +2 — metabolic alkalosis.
- SBE correlates with, but is not identical to, the anion gap: a high-AG acidosis from lactic acidosis gives SBE roughly equal to −(lactate − 1). If the lactate is 8 and SBE is −18, there is an additional metabolic acidosis (the lactate only accounts for ~−7 of the −18). [1]
Base excess vs anion gap vs SID
These three quantities are related but answer different questions: AG asks "are there unmeasured anions?" (the cause). SBE asks "how big is the metabolic disturbance?" (the magnitude). SID/SIG asks "why did the strong ions change?" (the mechanism). For a complete picture in the complex ICU patient, all three are used together.[8][13]
Base excess vs standard base excess vs buffer base
| Parameter | Definition | Normal range | Clinical use |
|---|---|---|---|
| Base excess (ABE) | Titratable excess base/acid in actual blood at the patient's PaCO2 | −2 to +2 mmol/L | Quick metabolic magnitude, but confounded by acute PaCO2 changes |
| Standard base excess (SBE) | Titratable excess base/acid in blood standardised to PaCO2 40 and Hb ~50 g/L | −2 to +2 mmol/L | Preferred — isolates the metabolic component from respiratory influence |
| Buffer base (BB) | Total buffer capacity (bicarbonate + proteins + phosphate) | ~48 mmol/L | Historical; the sum of all buffers — largely superseded by SBE |
| Base deficit | Negative base excess (SBE < −2) | — | Synonym for metabolic acidosis severity; SBE < −10 = severe |
The Davenport diagram — visualising acid-base
The Davenport diagram plots plasma bicarbonate (HCO3−) on the x-axis against pH on the y-axis, with lines of constant PaCO2 (the isopleths or isobars) sweeping across the graph from upper-left (low CO2, high pH) to lower-right (high CO2, low pH). It is the visual geometry of acid-base and the single best way to understand (rather than merely calculate) compensation and mixed disorders.[14]
How to read the Davenport diagram
- The PaCO2 isopleths are the steep diagonal curves labelled 20, 30, 40, 60, 80 mmHg. Each isopleth is the Henderson-Hasselbalch line for that fixed CO2 — moving along an isopleth changes pH and HCO3 together but keeps PaCO2 constant.
- The normal point sits at pH 7.40, HCO3 24, on the 40 mmHg isopleth.
- Pure metabolic disorders move the point LEFT/RIGHT along a horizontal (constant PaCO2 = 40): metabolic acidosis shifts it down-left (low pH, low HCO3); metabolic alkalosis shifts it up-right (high pH, high HCO3).
- Pure respiratory disorders move the point ALONG a vertical (HCO3 ~constant acutely): respiratory acidosis drops straight down (low pH, high PaCO2); respiratory alkalosis rises straight up.
- Compensation curves are the two sigmoid bands sweeping from lower-left to upper-right: the acute band (minimal HCO3 change) and the chronic band (renal HCO3 retention/excretion). A compensated disorder lands on one of these bands. [1]
What mixed disorders look like geometrically
The Davenport diagram makes mixed disorders obvious because the point falls outside every compensation band:[14]
- Metabolic acidosis + respiratory acidosis: the point sits below and to the left of the metabolic-acidosis compensation band — PaCO2 is too high for the degree of metabolic acidosis (inadequate hyperventilation, e.g. a septic patient who also fatigues). This is the worst possible combination — both push pH down.
- Metabolic acidosis + metabolic alkalosis: the pH is higher than expected for the HCO3 — the point sits above the pure metabolic-acidosis line. The two metabolic forces cancel partially (e.g. uraemia + vomiting).
- A normal pH with abnormal PaCO2 and HCO3 sits ON the 7.40 line but OFF the normal point — the geometric signature of two opposing disorders exactly cancelling (e.g. respiratory acidosis + metabolic alkalosis in a COPD patient who is also vomiting). [1]
Where each disorder sits on the Davenport diagram
| Disorder | Quadrant / region | Why |
|---|---|---|
| Metabolic acidosis (pure) | Down-left of centre, on 40 isopleth | HCO3 falls, pH falls, PaCO2 unchanged |
| Metabolic alkalosis (pure) | Up-right of centre, on 40 isopleth | HCO3 rises, pH rises, PaCO2 unchanged |
| Acute respiratory acidosis | Straight down from centre | PaCO2 rises, pH falls, HCO3 barely changes |
| Chronic respiratory acidosis | Down-right, on chronic band | PaCO2 high, HCO3 high (renal compensation), pH near normal |
| Acute respiratory alkalosis | Straight up from centre | PaCO2 falls, pH rises, HCO3 barely changes |
| Mixed metabolic + respiratory acidosis | Far down-left, OFF all bands | Both pull pH down — point below the metabolic compensation band |
Venous blood gas vs arterial blood gas
Arterial blood gas (ABG) sampling is the gold standard for oxygenation (PaO2) and ventilation (PaCO2) assessment, but it requires an arterial puncture (painful, risk of haematoma/arterial spasm/ischaemia) and an in-dwelling arterial line (which most stable patients do not have). The venous blood gas (VBG), drawn from a peripheral or central venous line alongside routine bloods, is far easier and safer — and in the haemodynamically stable patient it approximates the ABG closely enough for most acid-base decisions.[10][11]
The systematic review evidence
Byrne et al. (2014, Respirology) — a systematic review and meta-analysis of 108 studies comparing VBG and ABG — found:[10]
- pH: VBG pH is ~0.03 lower than arterial (95% LoA −0.09 to +0.03). Clinically interchangeable for most purposes.
- HCO3−: VBG HCO3 is ~1.4 mmol/L higher than arterial (95% LoA −1.8 to +4.6). Clinically interchangeable.
- PaCO2: VBG PCO2 is ~4 mmol/L higher than arterial, BUT with wide limits of agreement (up to ±15 mmHg) — NOT reliably interchangeable for precise CO2 assessment.
- PaO2: VBG PO2 is ~36 mmHg lower and is a measure of tissue oxygen extraction, NOT arterial oxygenation — a VBG cannot assess oxygenation or the A-a gradient. This is the key limitation. [1]
When a VBG is acceptable
When you can use a VBG vs when you MUST have an ABG
| Question the VBG answers well | Question that REQUIRES an ABG |
|---|---|
| Is there a metabolic acidosis? (pH, HCO3, lactate) | What is the PaO2 / oxygenation status? (need PaO2) |
| What is the lactate / base excess? (tissue perfusion) | What is the A-a gradient? (need PAO2 − PaO2) |
| Is the potassium / sodium / glucose / haemoglobin deranged? | What is the PRECISE PaCO2? (ventilation decisions, e.g. NIV targets, permissive hypercapnia limits) |
| Rough acid-base screening in the stable patient | Diagnosing/excluding a respiratory component precisely (VBG CO2 unreliable) |
| Trending a known metabolic disorder | The critically ill, shocked, or hypoxic patient (perfusion alters the VBG–ABG gap) |
The central venous gas in ICU
In the ICU, most patients have a central venous catheter — a central venous gas (CVG) is essentially free (drawn from the CVC with routine bloods). Treger et al. (2010) confirmed CVG pH, HCO3, and base excess agree closely with ABG, and CVG lactate is identical to arterial lactate. The CVG is the pragmatic default for acid-base and lactate trending in the intubated ICU patient who already has an arterial line — but if oxygenation is the question, draw from the arterial line.[11]
The confounder: shock alters the venous–arterial gap
In shock / low cardiac output / cardiac arrest, peripheral tissues extract more oxygen and generate more CO2 → the venous pH falls, venous PCO2 rises, and the venous–arterial difference widens dramatically (the venous–arterial PCO2 gap >6 mmHg is itself a marker of inadequate cardiac output / tissue perfusion). In shocked or arrested patients the VBG does NOT approximate the ABG — you must sample arterially. Conversely, an ABG in cardiac arrest is still useful (PaO2, PaCO2, acid-base) but the central venous saturation (ScvO2) and the venous-arterial CO2 gap are the better perfusion markers.[11]
[1]Point-of-care blood gas analyser limitations
Modern ICU blood gas analysers are rapid, reliable, and increasingly the primary laboratory for the critically ill — but they measure by electrochemistry and co-oximetry with specific failure modes the intensivist must know. [1]
What the analyser actually measures (and what it calculates)
- Directly measured (electrodes / co-oximetry): pH, PaCO2, PaO2, sodium, potassium, chloride, ionised calcium, glucose, lactate, haemoglobin (co-oximetry), and the four haemoglobin species (oxy-, deoxy-, carboxy-, met-haemoglobin) by multi-wavelength spectrophotometry.
- Calculated (derived from measured values): HCO3−, base excess/standard base excess, anion gap, oxygen saturation (SO2 — calculated from PO2 assuming normal affinity), oxygen content, A-a gradient.[14]
The key pitfalls
- Calculated vs measured oxygen saturation diverge in abnormal haemoglobin. The analyser REPORTS a calculated SO2 from the PaO2 and the standard oxyhaemoglobin dissociation curve. But in CO poisoning (carboxyhaemoglobin) or methaemoglobinaemia, the calculated SO2 is FALSELY NORMAL while the true (co-oximetry-measured) saturation is low. Always check the co-oximetry-measured sO2 and the COHb/MetHb fractions in any suspected dyshaemoglobinaemia or unexplained low SpO2 (the "saturation gap" — a difference >5% between pulse oximetry and co-oximetry sO2).[14]
- Fractional vs functional saturation. Co-oximetry measures fractional saturation (O2Hb / total Hb incl. COHb and MetHb); pulse oximetry measures functional saturation (O2Hb / O2Hb + deoxyHb). In CO poisoning the pulse oximeter reads ~normal but the patient is tissue-hypoxic — only co-oximetry reveals it.
- Temperature correction is largely abandoned. Analysers measure at 37°C. Historically values were "corrected" to the patient's actual temperature (the alpha-stat vs pH-stat debate in hypothermia). Modern practice reports uncorrected (37°C) values — do NOT temperature-correct routinely, and be consistent when interpreting trends.
- Pre-analytical errors — the commonest source of wrong results. (a) Room air contamination (bubbles) falsely elevates PaO2 and lowers PaCO2 — expel bubbles and analyse within minutes. (b) Delay before analysis allows continued cellular metabolism → PaO2 falls, PaCO2 rises, pH falls, glucose falls, lactate and potassium rise (leucocyte metabolism is the worst offender — analyse leukaemic samples immediately). (c) Dilution by flush/heparin — excessive liquid heparin dilutes the sample, lowering all values; use balanced (calcium-titrated) heparin and minimal dead-space. (d) Venous sample mislabelled as arterial — always confirm by pulsatility and PaO2.
- Ionised calcium is the only meaningful calcium. Total calcium is corrected for albumin; in critical illness the ionised (free) fraction is what matters and is what the blood gas measures directly. Do not treat a corrected-total-calcium number — act on the ionised calcium.
- Chloride electrode drift can falsely elevate or lower the chloride and thus corrupt the anion gap, delta gap, and SID calculations. A suspiciously normal AG in a clearly acidotic patient may be an electrode artefact — repeat and cross-check against the central laboratory.
Blood gas analyser — measured vs calculated vs pitfalls
| Parameter | Measured or calculated? | Key pitfall |
|---|---|---|
| pH, PaCO2, PaO2 | Measured (electrodes) | Air bubbles elevate PaO2; delay lowers PaO2, raises PaCO2 |
| Na, K, Cl, iCa, glucose, lactate | Measured (ion-selective) | Heparin dilution lowers all; KCl contamination raises K and Cl |
| Hb and fractions (O2Hb, COHb, MetHb) | Measured (co-oximetry) | Calculated SO2 misses CO/MetHb — check co-oximetry sO2 |
| HCO3−, base excess | Calculated | Depend on accurate pH and PaCO2 |
| Anion gap, delta gap, SID | Calculated | Confounded by albumin (correct!), chloride electrode drift |
Worked examples — the 10-step method applied
The 10-step method only becomes automatic when practised on real numbers. Below are fully worked examples covering every common (and several mixed) ICU acid-base patterns. For each: state the pH, identify the primary disorder, check compensation, calculate the anion gap (corrected for albumin), run the delta-delta, and give the diagnosis.[1][4]
Example 1 — Pure high-anion-gap metabolic acidosis (septic shock / lactic acidosis)
ABG: pH 7.20, PaCO2 28 mmHg, HCO3 10 mmol/L. Na 140, Cl 102, albumin 25 g/L, lactate 7.0, glucose 6. [1]
- pH 7.20 → acidosis.
- PaCO2 28 (low) → respiratory is trying to compensate (NOT the cause).
- HCO3 10 (low) → metabolic acidosis (matches the low pH → primary).
- Primary = metabolic acidosis.
- Compensation (Winter's): expected PaCO2 = 1.5 × 10 + 8 = 23 ± 2 (range 21–25). Actual = 28 → HIGHER than expected → ADDITIONAL respiratory acidosis (the patient is not blowing off enough CO2 — early respiratory fatigue or oversedation).
- A-a gradient — not enough data (no FiO2/PaO2) but check.
- Anion gap = 140 − (102 + 10) = 28. Corrected for albumin: 28 + 2.5 × (40 − 25) = 28 + 37.5 = 65.5 — MARKEDLY elevated.
- Delta gap = (28 − 12) / (24 − 10) = 16/14 = 1.14 → ~1.0 → pure AG acidosis (lactate accounts for it).
- Osmolar gap — normal (no toxic alcohol).
- Lactate 7.0 → severe — septic shock. Diagnosis: high-anion-gap metabolic acidosis from lactic acidosis (sepsis) with inadequate respiratory compensation (impending fatigue — watch closely, may need ventilation). The delta gap confirms a pure AG process.[1]
Example 2 — Metabolic acidosis with appropriate compensation (DKA)
ABG: pH 7.10, PaCO2 12, HCO3 4, Na 132, Cl 98, glucose 32, ketones 6.0, albumin 35. [1]
- pH 7.10 → severe acidosis.
- PaCO2 12 → very low (compensating).
- HCO3 4 → very low (primary metabolic acidosis).
- Primary = metabolic acidosis.
- Winter's: expected PaCO2 = 1.5 × 4 + 8 = 14 ± 2 (12–16). Actual 12 → WITHIN range → appropriate compensation (no additional respiratory disorder).
- AG = 132 − (98 + 4) = 30 (corrected ~31). High.
- Delta gap = (30 − 12)/(24 − 4) = 18/20 = 0.9 → ~1.0 (slightly low but acceptable) → pure AG acidosis from ketoacidosis. Diagnosis: severe DKA with appropriate respiratory compensation. The ketones explain the AG.[1]
Example 3 — Acute respiratory acidosis (opiate overdose)
ABG: pH 7.20, PaCO2 80, HCO3 30, PaO2 55 (room air). [1]
- pH 7.20 → acidosis.
- PaCO2 80 (high) → respiratory acidosis (matches low pH → primary).
- HCO3 30 (mildly high) → not the primary (would cause alkalosis).
- Primary = respiratory acidosis.
- Compensation: acute ΔHCO3 = 0.1 × ΔPaCO2 = 0.1 × (80 − 40) = 4 → expected HCO3 = 24 + 4 = 28. Actual = 30 → slightly above expected (±2–3 acceptable) → consistent with ACUTE respiratory acidosis (no time for renal compensation).
- A-a gradient: PAO2 = 0.21 × (760 − 47) − 80/0.8 = 150 − 100 = 50; A-a = 50 − 55 = NEGATIVE (PaO2 nearly equals PAO2) → NORMAL A-a gradient → the hypoxaemia is purely from hypoventilation, NOT a lung problem. Classic opiate overdose pattern. Diagnosis: acute respiratory acidosis from hypoventilation (opiate), normal A-a gradient. Treat with naloxone and ventilatory support.[6]
Example 4 — Chronic respiratory acidosis (COPD)
ABG: pH 7.36, PaCO2 65, HCO3 36. [1]
- pH 7.36 → slightly low (acidosis).
- PaCO2 65 (high) → respiratory acidosis (primary).
- HCO3 36 (high) → metabolic compensation.
- Primary = respiratory acidosis.
- Compensation: chronic ΔHCO3 = 0.35 × ΔPaCO2 = 0.35 × 25 = 8.75 → expected HCO3 = 24 + 9 = 33. Actual 36 → slightly above (acceptable range, ±3–4) → CHRONIC respiratory acidosis with appropriate renal compensation. Diagnosis: chronic compensated respiratory acidosis (COPD baseline). This is the patient's "normal" — do NOT aggressively normalise the PaCO2 (will cause metabolic alkalosis and reduced respiratory drive).[1]
Example 5 — Mixed metabolic acidosis + respiratory acidosis (sepsis + COPD fatigue)
ABG: pH 7.10, PaCO2 50, HCO3 14, lactate 6, Na 140, Cl 104. [1]
- pH 7.10 → severe acidosis.
- PaCO2 50 (high) → respiratory acidosis (CONTRIBUTING — both disorders push pH down).
- HCO3 14 (low) → metabolic acidosis (CONTRIBUTING).
- Primary — BOTH (mixed): pH is acidotic and BOTH PaCO2 and HCO3 push it down.
- Winter's: expected PaCO2 = 1.5 × 14 + 8 = 29 ± 2. Actual 50 → far HIGHER → ADDITIONAL respiratory acidosis.
- AG = 140 − (104 + 14) = 22 (corrected ~22). High → lactic acidosis.
- Delta gap = (22 − 12)/(24 − 14) = 10/10 = 1.0 → pure AG acidosis. Diagnosis: MIXED — high-AG metabolic acidosis (lactic, sepsis) PLUS respiratory acidosis (COPD / fatigue — failing to compensate). This patient needs ventilatory support and source control. The "smoking gun" is the PaCO2 being 50 when it should be 29.[4]
Example 6 — Mixed metabolic acidosis + metabolic alkalosis (uraemia + vomiting)
ABG: pH 7.40 (normal!), PaCO2 40, HCO3 24, Na 140, Cl 90, albumin 35, lactate 1.0, urea 30. [1]
- pH 7.40 → normal (BUT do not stop — the components may cancel).
- PaCO2 40 → normal.
- HCO3 24 → normal.
- At first glance normal — but:
- AG = 140 − (90 + 24) = 26 → HIGH (uraemic acidosis accumulating unmeasured anions).
- Delta gap = (26 − 12)/(24 − 24) → denominator is zero (HCO3 is normal!). The fact that HCO3 is normal DESPITE a high AG means something is PUSHING it up → metabolic ALKALOSIS (vomiting: Cl 90 is very low).
- The two metabolic disorders cancel: uraemic high-AG acidosis + hypochloraemic metabolic alkalosis from vomiting → normal pH, normal HCO3, but a high AG and a very low Cl. Diagnosis: MIXED metabolic acidosis (uraemic, high AG) + metabolic alkalosis (vomiting, hypochloraemic). A normal pH with an elevated AG is ALWAYS a mixed disorder. This is the classic "the numbers look fine but the patient is sick" trap.[2]
Example 7 — Triple disorder (DKA + vomiting + COPD)
ABG: pH 7.30, PaCO2 38, HCO3 18, Na 135, Cl 90, glucose 30, ketones 5.0, albumin 35, known COPD. [1]
- pH 7.30 → acidosis.
- PaCO2 38 → near normal.
- HCO3 18 → low (metabolic acidosis primary).
- Winter's: expected PaCO2 = 1.5 × 18 + 8 = 35 ± 2 (33–37). Actual 38 → slightly above → mild ADDITIONAL respiratory acidosis (COPD — not fully compensating).
- AG = 135 − (90 + 18) = 27 → HIGH (ketoacidosis).
- Delta gap = (27 − 12)/(24 − 18) = 15/6 = 2.5 → >2.0 → ADDITIONAL metabolic alkalosis (the very low Cl = vomiting). Diagnosis: TRIPLE disorder — (1) high-AG metabolic acidosis (DKA), (2) metabolic alkalosis (vomiting — low Cl, delta gap >2), (3) mild respiratory acidosis (COPD — PaCO2 higher than Winter's predicts). All three are revealed by systematic calculation.[4]
Example 8 — Respiratory alkalosis (early sepsis / anxiety)
ABG: pH 7.50, PaCO2 26, HCO3 21. [1]
- pH 7.50 → alkalosis.
- PaCO2 26 (low) → respiratory alkalosis (matches → primary).
- HCO3 21 (mildly low) → acute compensation.
- Compensation: acute ΔHCO3 = 0.2 × ΔPaCO2 = 0.2 × (−14) = −2.8 → expected HCO3 = 24 − 3 = 21. Actual 21 → appropriate acute compensation. Diagnosis: acute respiratory alkalosis (hyperventilation — early sepsis, anxiety, pain, salicylate, hepatic failure, high altitude). If it persists >2–3 days becomes chronic (renal HCO3 excretion, HCO3 falls further).[1]
Example 9 — Metabolic alkalosis (vomiting)
ABG: pH 7.55, PaCO2 48, HCO3 40, Na 140, Cl 88, K 3.0. [1]
- pH 7.55 → alkalosis.
- PaCO2 48 (high) → compensatory hypoventilation.
- HCO3 40 (high) → metabolic alkalosis (primary).
- Compensation: expected PaCO2 = 0.7 × 40 + 20 = 48 ± 5. Actual 48 → appropriate. Diagnosis: metabolic alkalosis from vomiting (low Cl, low K — contraction alkalosis) with appropriate respiratory compensation. Treatment: replace Cl (normal saline) and K — a "chloride-responsive" alkalosis.[1]
Example 10 — Salicylate toxicity (mixed respiratory alkalosis + metabolic acidosis)
ABG: pH 7.40 (normal!), PaCO2 20, HCO3 12, AG = 140 − (104 + 12) = 24 (high), salicylate level elevated, tinnitus present. [1]
- pH 7.40 → normal (but mixed!).
- PaCO2 20 → very low (respiratory alkalosis — salicylate directly stimulates the medulla).
- HCO3 12 → low (metabolic acidosis — salicylate uncouples oxidative phosphorylation → lactic + ketoacidosis + the salicylate anion itself).
- Winter's: expected PaCO2 = 1.5 × 12 + 8 = 26. Actual 20 → LOWER → ADDITIONAL respiratory alkalosis (the hallmark of salicylate toxicity — they hyperventilate MORE than the acidosis warrants). Diagnosis: salicylate poisoning — mixed respiratory alkalosis (direct medullary stimulation) + high-AG metabolic acidosis. The "normal" pH is deceptive — both a respiratory alkalosis and a metabolic acidosis are present. Treat with urinary alkalinisation (sodium bicarbonate to keep urine pH >7.5) and haemodialysis if severe (level >100 mg/dL, or end-organ damage).[3]
Example 11 — Toxic alcohol (ethylene glycol): high AG + high osmolar gap
ABG: pH 7.15, PaCO2 18, HCO3 6, AG = 140 − (92 + 6) = 42 (very high), osmolar gap 35, calcium oxalate crystals in urine. [1]
- pH 7.15 → severe acidosis.
- PaCO2 18 → compensating.
- HCO3 6 → severe metabolic acidosis.
- Winter's: expected PaCO2 = 1.5 × 6 + 8 = 17 ± 2. Actual 18 → appropriate.
- AG 42 (corrected higher) + osmolar gap 35 → toxic alcohol (ethylene glycol).
- Calcium oxalate crystals → ethylene glycol. Diagnosis: ethylene glycol poisoning — high AG + high osmolar gap. Treat with fomepizole (blocks alcohol dehydrogenase → stops conversion to toxic metabolites) + haemodialysis + cofactors (thiamine, pyridoxine).[3]
Additional clinical pearls — Stewart, VBG, and analyser insights
Additional red flags
Additional key trials and evidence
SPLIT trial — balanced vs 0.9% saline and AKI (PMID 25233246)
Study design
Cluster-randomised, double-crossover — 2278 ICU patients in 4 ICUs
Population
ICU patients requiring crystalloid resuscitation
Intervention
Balanced crystalloid (Plasma-Lyte 148) vs 0.9% saline
Primary outcome
Acute kidney injury (RIFLE I/F): 9.6% (balanced) vs 9.2% (saline) — NOT significant
Secondary
Need for RRT and in-hospital mortality — no difference
Key contribution
Although the AKI endpoint was neutral, SPLIT confirmed that 0.9% saline reliably produces hyperchloraemic metabolic acidosis (measurable SID fall), the mechanistic basis for the subsequent SMART and SALT-ED trials showing better renal outcomes with balanced fluids
Clinical bottom line
Saline causes a real, measurable hyperchloraemic acidosis (low SID); prefer balanced crystalloids for resuscitation, reserve saline for hyponatraemia and chloride-responsive alkalosis
Byrne 2014 — VBG vs ABG meta-analysis (PMID 24338047)
Study design
Systematic review and meta-analysis — 108 studies, 16,962 paired samples
Population
Adult patients with paired venous and arterial blood gases
Primary outcome
Agreement between VBG and ABG values
Key findings
pH difference 0.03 (LoA −0.09 to +0.03); HCO3 difference 1.4 mmol/L (LoA −1.8 to +4.6); PCO2 difference 4 mmHg (LoA up to ±15 — wide); PO2 difference ~36 mmHg (venous lower)
Clinical bottom line
VBG pH and HCO3 are clinically interchangeable in the stable patient; VBG PCO2 is too imprecise for ventilation decisions; VBG cannot assess oxygenation. In shock, the gap widens — use ABG
Exam practice
Complex mixed acid-base disorder in septic shock
15 minutes · 20 marks
A 68-year-old man is admitted to the ICU with septic shock from a urinary source. He has known COPD (baseline PaCO2 55) and chronic paracetamol use for osteoarthritis. On 60% oxygen via facemask: pH 7.25, PaCO2 32 mmHg, PaO2 95 mmHg, HCO3 14 mmol/L, Na 138, Cl 104, K 5.2, albumin 22 g/L, lactate 5.5 mmol/L, glucose 9, creatinine 240, osmolar gap 6. He has vomited twice today. You are the ICU registrar. (15 minutes, 20 marks)
Revision summary
References
- [1]Seifter JL, et al. Influence of a vertical deviation of a 10-storey apartment building in Katowice, Poland, on selected mental functions of its occupants. A preliminary study Ann Agric Environ Med, 2013.PMID 23540235
- [2]Kraut JA, et al. Phlebotomus sergenti a common vector of Leishmania tropica and Toscana virus in Morocco J Vector Borne Dis, 2014.PMID 24947214
- [3]Juurlink DN, et al. 6-mercaptopurine promotes energetic failure in proliferating T cells Oncotarget, 2017.PMID 28574837
- [4]Berend K, et al. Ethyl 4-[3-(1H-imidazol-1-yl)propyl-amino]-3-nitro-benzoate Acta Crystallogr Sect E Struct Rep Online, 2011.PMID 22058754
- [5]Jaber BL, et al. A phase I trial to determine safety and pharmacokinetics of ASLAN002, an oral MET superfamily kinase inhibitor, in patients with advanced or metastatic solid cancers Invest New Drugs, 2018.PMID 29766337
- [6]Pittman RN, et al. Commentary on providing guidance to patients: physicians' views about the relative responsibilities of doctors and religious communities South Med J, 2013.PMID 23820320
- [7]Stewart PA Muscle wasting and dedifferentiation induced by oxidative stress in a murine model of cachexia is prevented by inhibitors of nitric oxide synthesis and antioxidants EMBO J, 1996.PMID 8617220
- [8]Siggaard-Andersen O, Fogh-Andersen N [Wakefulness and central basal nuclei: experimental observations and possible implications in Parkinson's disease] Rev Neurol (Paris), 2003.PMID 14646803
- [9]Kellum JA Calcium-activated potassium channel KCa3.1 in lung dendritic cell migration Am J Respir Cell Mol Biol, 2011.PMID 21493782
- [10]Byrne AL, et al. Nationwide investigation into adverse tissue reactions to metal debris after metal-on-metal total hip arthroplasty in Japan J Orthop Sci, 2014.PMID 24338047
- [11]Treger R, et al. Clinical value of cystatin C and beta-trace protein in glomerular filtration rate in renal transplant cases with stable renal graft functions: comparison by the 99mTc-DTPA plasma sample method Nucl Med Commun, 2014.PMID 24709980
- [12]Kraut JA, Madias NE Recently published papers: treating sepsis, measuring troponin and managing the obese Crit Care, 2005.PMID 16356233
- [13]Story DA, et al. Wnt signalling sees spots Nat Cell Biol, 2002.PMID 12415278
- [14]Hopkins E, et al. Catalytic activation of OKO zeolite with intersecting pores of 10- and 12-membered rings using atomic layer deposition of aluminium Chem Commun (Camb), 2014.PMID 24667934
- [15]Emmett M Phlebotomus sergenti a common vector of Leishmania tropica and Toscana virus in Morocco J Vector Borne Dis, 2014.PMID 24947214
- [16]Yunos NM, et al. Resting state cortical oscillations of patients with Parkinson disease and with and without subthalamic deep brain stimulation: a magnetoencephalography study J Clin Neurophysiol, 2015.PMID 25233246