ICU · Respiratory / monitoring
Ventilator Waveforms — Scalars, Pressure-Volume & Flow-Volume Loops
Also known as Ventilator waveforms · Pressure-volume loop · P-V loop · Flow-volume loop · Pressure-time scalar · Flow-time scalar · Plateau pressure · Peak inspiratory pressure · Driving pressure · Patient-ventilator asynchrony
Ventilator waveforms are the bedside physics of mechanical ventilation. The scalars (pressure, volume, and flow against time) and the loops (pressure-volume and flow-volume) show airway resistance, compliance, overdistension, and patient-ventilator interaction. The key manoeuvre is the inspiratory hold, which separates the peak pressure into its resistive and elastic components: a high peak with a normal plateau is an airway-resistance problem (bronchospasm, kink, secretions), while a high peak with a high plateau is a compliance problem (ARDS, oedema, pneumothorax). The driving pressure (plateau minus PEEP) and the static compliance (Vt divided by plateau minus PEEP) quantify the stress on the lung.
On this page & tools
Your progress
Saved locally on this device.
Target exams
Overview & definition
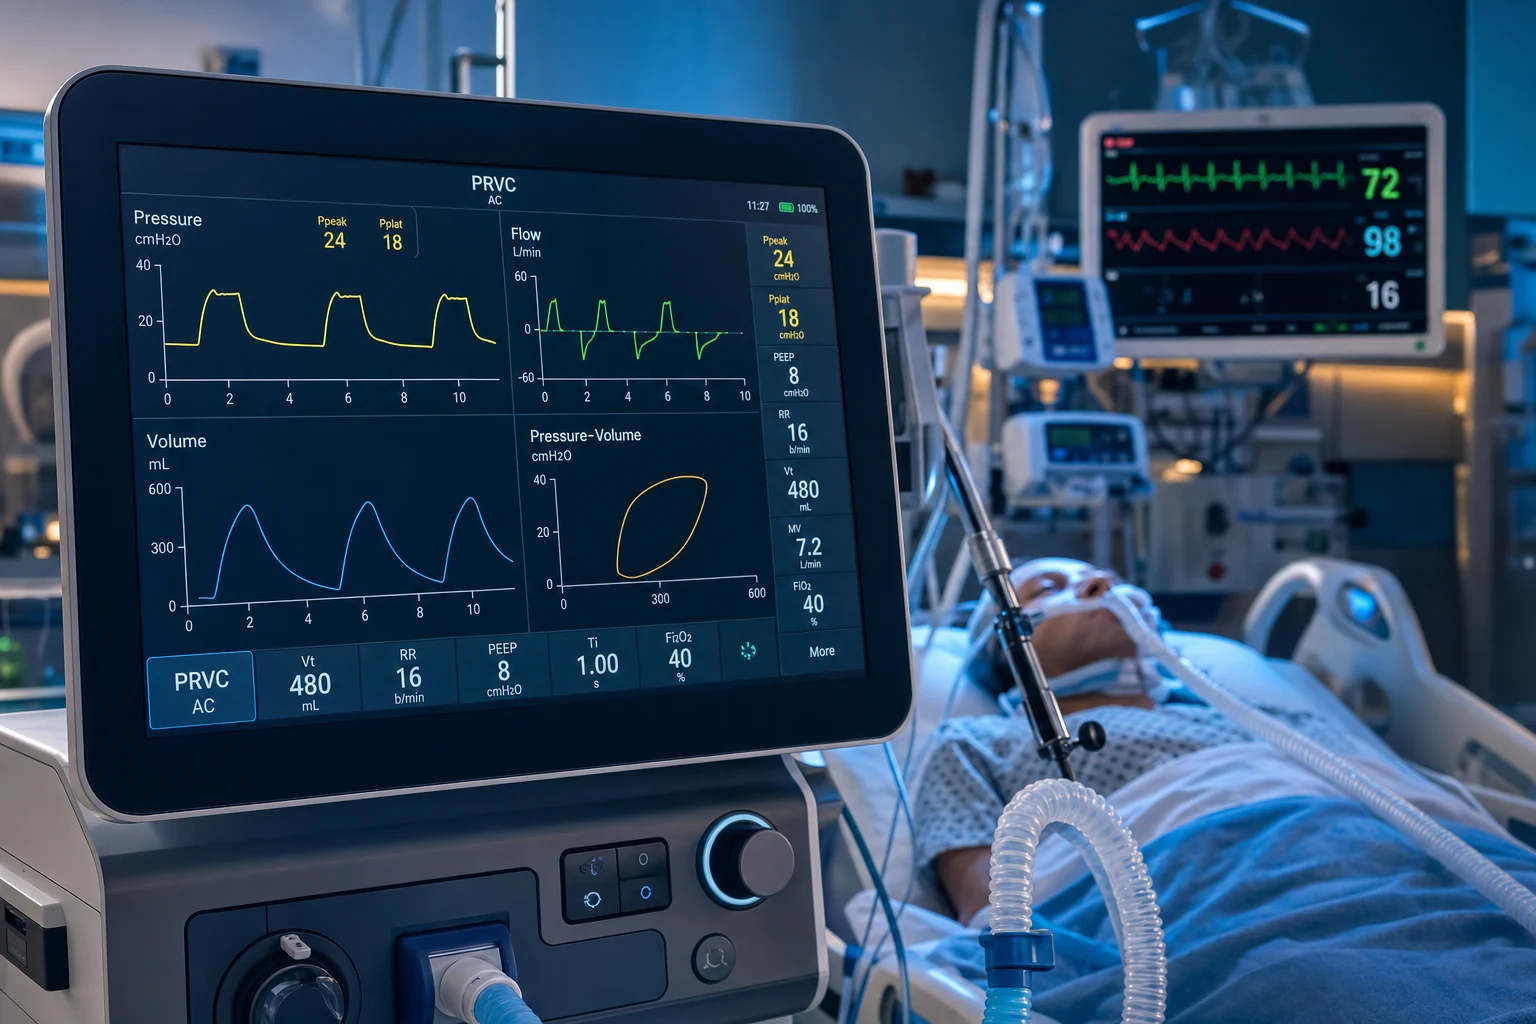
Ventilator waveforms display the scalars (pressure, volume, and flow plotted against time) and the loops (pressure-volume and flow-volume) generated by the ventilator. Reading them is the bedside physics of mechanical ventilation: they reveal airway resistance, respiratory-system compliance, alveolar recruitment and overdistension, and patient-ventilator synchrony. The single most useful manoeuvre is the inspiratory hold, which splits the peak pressure into a resistive and an elastic component.[1][1]
The key pressures
- Peak inspiratory pressure (PIP / Ppeak) — the highest airway pressure during the breath. It reflects airway resistance, compliance, PEEP, and the inspiratory flow.
- Plateau pressure (Pplat) — measured during an inspiratory hold (a brief pause at end-inspiration with no flow). With no flow, there is no resistive pressure, so the Pplat reflects only the elastic (compliance) pressure — the alveolar pressure. Target a Pplat under about 30 cmH2O for lung protection.
- PEEP — the end-expiratory pressure.[1]
The inspiratory hold separates the resistive from the elastic pressure:[1]
- PIP minus Pplat = the resistive pressure (the pressure dropped across the airway resistance).
- Pplat minus PEEP = the elastic pressure — the driving pressure (ΔP), the stress on the lung. Keep it low (under about 15 cmH2O where possible).
The diagnostic split — what a high peak pressure means
A rise in the peak inspiratory pressure is the most common ventilator alarm. The inspiratory hold distinguishes the cause:[1][1]
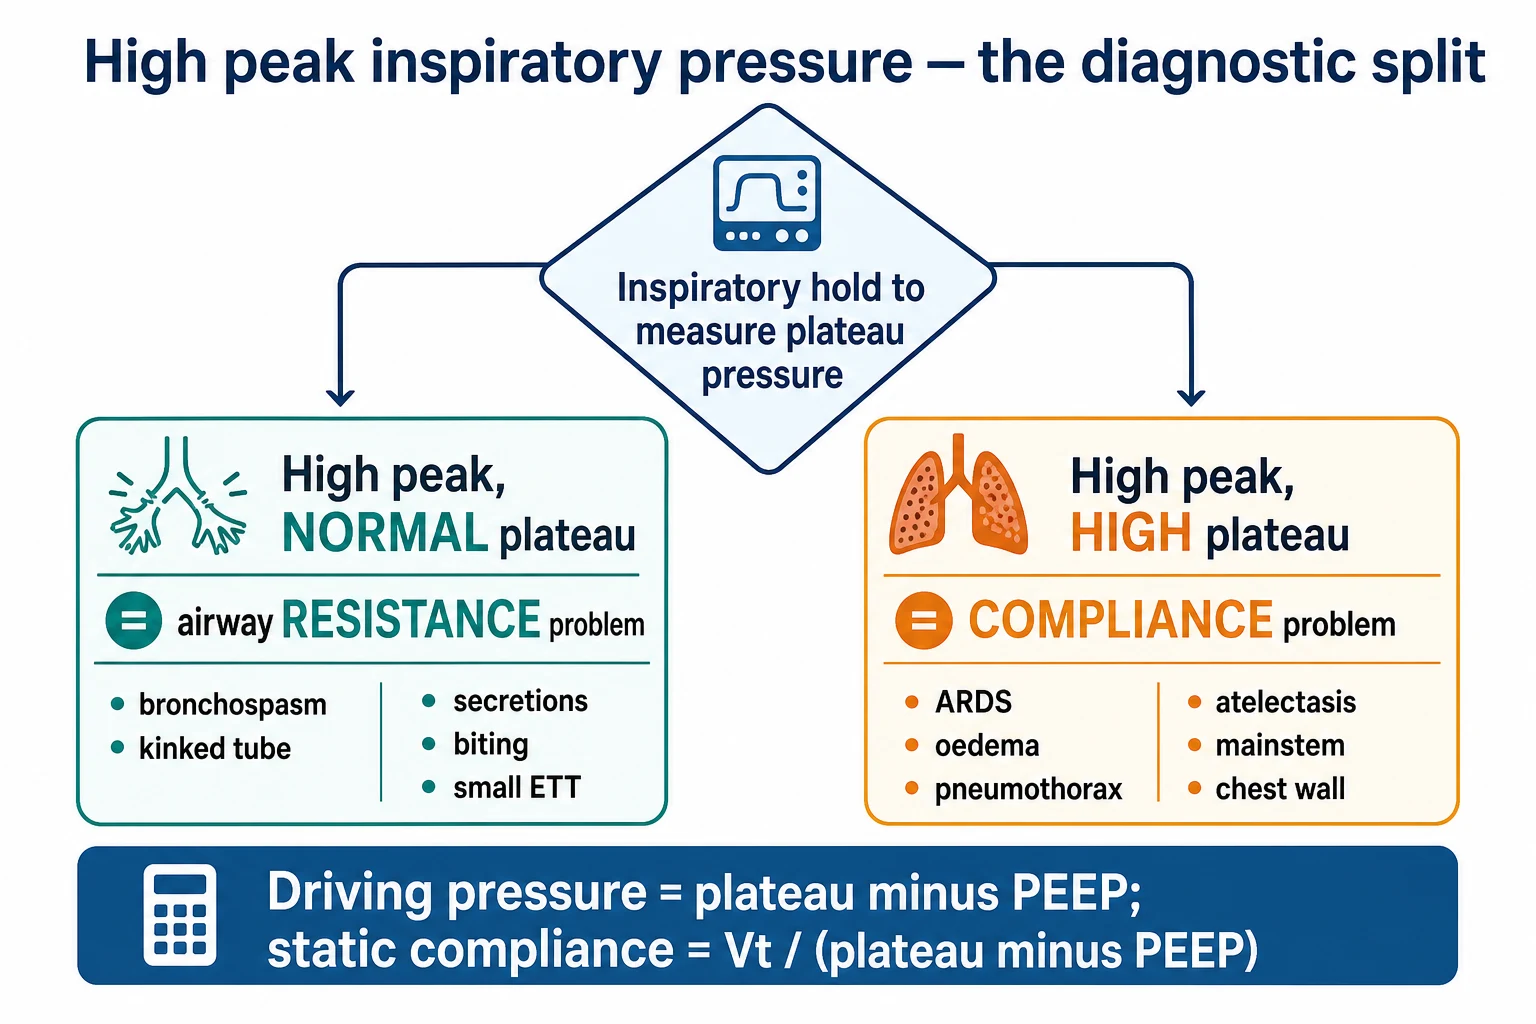
- High PIP, normal Pplat — an airway resistance problem: bronchospasm, a kinked tube, a mucus plug or secretions, the patient biting the tube, an endotracheal tube that is too small, or an obstruction. (The pressure is dissipated pushing gas through narrowed tubes; the alveolar pressure is normal.)
- High PIP, high Pplat — a compliance problem: a stiff lung or chest wall — ARDS, pulmonary oedema, a tension pneumothorax, atelectasis, main-stem intubation, or chest-wall restriction. (The alveolar pressure itself is high.)[1]
Compliance and resistance
- Static compliance = tidal volume divided by (Pplat minus PEEP). Normal about 50-100 mL/cmH2O; lower in ARDS and atelectasis.
- Dynamic compliance = tidal volume divided by (PIP minus PEEP). It is lower than the static compliance when airway resistance is high.
- Airway resistance = (PIP minus Pplat) divided by the inspiratory flow.[1]
A falling compliance on sequential readings signals worsening lung disease (or overdistension from too high a tidal volume or PEEP). [1]
The pressure-volume (P-V) loop
The P-V loop plots airway pressure (x) against volume (y) through a single breath:[1][1]
- The slope of the loop is the compliance — a flatter slope means a stiffer lung.
- The lower inflection point on the inspiratory limb marks the pressure at which collapsed alveoli are recruited (a guide, historically, to setting PEEP above it).
- The upper inflection point (beaking) — a flattening of the loop at high pressure — signals overdistension: further pressure produces little extra volume, only lung stress. Reduce the tidal volume or the PEEP if beaking appears.
- Hysteresis — the inspiratory and expiratory limbs follow different paths; the area within the loop is the work of breathing.[1]
The flow-volume loop
The flow-volume loop plots flow (y) against volume (x):[1]
- A coved (scooped) expiratory limb indicates obstruction (COPD, asthma) — the expiratory flow collapses.
- A sawtooth pattern suggests secretions or oscillation in the upper airway.
- A leak appears as the inspiratory and expiratory volumes failing to meet (the expiratory limb does not return to zero volume).[1]
The flow-time scalar and auto-PEEP
On the flow-time scalar, the expiratory flow should return to baseline (zero) before the next breath. If it does not, the patient has not fully exhaled — there is intrinsic (auto-) PEEP from air-trapping (COPD, asthma, a high respiratory rate). An end-expiratory hold measures the auto-PEEP.[1]
Patient-ventilator asynchrony
Waveforms reveal mismatch between the patient's effort and the ventilator:[1][1]
- Flow starvation (ineffective triggering) — the pressure trace dips or the flow is inadequate to meet demand; the patient appears to "suck" against the ventilator.
- Double triggering — two breaths triggered close together (breath stacking).
- Auto-triggering — the ventilator triggers without patient effort (a leak, or an over-sensitive trigger).
- Cycling asynchrony — the inspiratory time too short or too long for the patient's neural timing.[1]
Scalar waveforms in detail — the three time-based curves
Every ventilator screen shows three scalars — variables plotted against time. Reading them together is the foundation of waveform interpretation: each breath produces a coordinated set of pressure, flow, and volume traces, and a change in one must be explained by the others. The independent variable (what the ventilator controls) differs between volume control and pressure control, and this single fact determines the shape of every scalar.[1][1]
The pressure-time scalar
The pressure-time scalar plots airway opening pressure on the y-axis against time on the x-axis. Its shape depends on the mode: [1]
- Volume control (VC): pressure RISES progressively during inspiration (from PEEP toward the peak). Because flow is constant, pressure climbs as the lung fills and elastic recoil increases. The curve is concave-down. At end-inspiration, the inspiratory hold drops the pressure from PIP to Pplat — the signature stepwise decrement that separates resistance from compliance. After the hold, pressure falls sharply back to PEEP at the start of expiration, then remains flat at PEEP until the next breath.
- Pressure control (PC) and pressure support (PS): pressure rises RAPIDLY to the set target and is held CONSTANT (a square wave) throughout inspiration. At end-inspiration it drops sharply back to PEEP. A square pressure trace is the defining feature of a pressure-targeted mode — if the trace is not square (it overshoots, sags, or ramps slowly), the rise time or demand is mismatched. [1]
Key shape abnormalities on the pressure-time scalar:
- A downward deflection before the inspiratory rise = patient triggering effort (the inspiratory muscles pull airway pressure down before the ventilator responds). The depth and slope reflect the patient's work of breathing.
- A concavity or notch mid-inspiration in VC = flow asynchrony — the patient is pulling harder than the delivered flow, drawing pressure below the expected trajectory.
- A spike at the very start of a PC/PS breath = pressure overshoot from an aggressive rise time.
- A pressure sag during the plateau of PC/PS = high patient demand outstripping flow delivery.
- A spike at END-inspiration in PS = delayed cycling — the patient has begun to exhale against ongoing inspiratory flow.[1][7]
The flow-time scalar
The flow-time scalar is the most diagnostically rich of the three scalars. Inspiratory flow is plotted above the zero baseline; expiratory flow below it. The SHAPE of the inspiratory flow immediately identifies the mode: [1]
- VC with constant flow: a SQUARE (rectangular) inspiratory flow waveform — flow is fixed at the set value throughout inspiration.
- VC with decelerating flow: flow starts high and falls — resembles PC, but the ventilator is still volume-targeting.
- PC / PS: a DECELERATING inspiratory flow waveform — flow starts maximal (large driving gradient between set pressure and alveolar pressure) and falls exponentially as alveolar pressure rises toward the set pressure.[1]
The expiratory limb is normally a decelerating exponential that returns to the zero-flow baseline before the next breath. Three expiratory-limb abnormalities carry diagnostic weight:
- Expiratory flow does not return to zero → auto-PEEP (incomplete expiration, gas trapping).
- The expiratory limb is concave (scooped) with a prolonged tail → expiratory obstruction (COPD, asthma).
- A sawtooth oscillation on the expiratory limb → secretions in the airway or upper-airway oscillation.[1][7]
The volume-time scalar
The volume-time scalar shows delivered volume against time. In VC it rises LINEARLY (constant flow = constant rate of volume delivery); in PC/PS it rises CURVILINEARLY (fast initially when flow is high, slowing as flow decelerates). Two bedside checks:
- Inspiratory volume should equal the set Vt in VC — if the delivered Vt is less than set, there is a LEAK (cuff leak, bronchopleural fistula, circuit disconnect, cracked humidifier).
- Expiratory volume should return to the zero baseline. If it does not, trapped gas remains above FRC (auto-PEEP). If expiratory volume is less than inspiratory volume, there is a circuit or airway leak.[1]
What each scalar shape tells you about the mode
| Scalar | Volume control (constant flow) | Pressure control / support |
|---|---|---|
| Pressure-time | Progressive rise (concave-down) from PEEP to PIP; inspiratory hold drops to Pplat | Square wave — rapid rise to set pressure, held constant, sharp drop to PEEP |
| Flow-time | Square inspiratory flow (constant); decelerating expiratory flow | Decelerating inspiratory flow (exponential); decelerating expiratory flow |
| Volume-time | Linear rise during inspiration; linear fall during expiration | Curvilinear rise (fast then slow); curvilinear fall |
| What you SET | Flow, Vt, inspiratory time | Pressure, inspiratory time |
| What you READ | Pressure (PIP, Pplat) | Flow and resulting Vt |
Inspiratory flow patterns in volume control
In volume control the clinician chooses the SHAPE of the inspiratory flow waveform. The two options have distinct mechanical consequences:[1][1]
Constant (square) vs decelerating flow in volume control
| Feature | Constant (square) flow | Decelerating flow |
|---|---|---|
| Inspiratory flow shape | Rectangular — flat plateau at the set peak flow throughout inspiration | Starts at peak flow, falls toward end-inspiration |
| Peak pressure timing | PIP occurs at END-inspiration (pressure climbs throughout) | PIP occurs EARLY (when flow is maximal), then falls as flow decelerates |
| Gas distribution | Prefers low-resistance (healthy) regions — may overinflate compliant lung and underinflate stiff regions | Better distribution to slow-filling (stiff, long time-constant) units — more homogeneous inflation |
| Best use | Standard ventilation; clearest for reading resistance and auto-PEEP on the expiratory limb | Heterogeneous lungs (ARDS, pneumonia) where gas distribution matters; resembles pressure control |
| Effect on inspiratory time | At a given Vt and peak flow, Ti is fixed (Ti = Vt / flow) | Ti depends on the deceleration profile; longer gas-distribution time |
Choosing the flow pattern: constant flow is the default and gives the cleanest waveforms for teaching and resistance measurement. Decelerating flow (or simply switching to PC/PS) is preferred when lung units are heterogeneous — it allows slow-filling, long time-constant regions (consolidated, atelectatic, or oedematous alveoli) to fill alongside fast-filling units, improving ventilation-perfusion matching and reducing regional overdistension.[1]
Auto-PEEP — detection, measurement, and consequences
Auto-PEEP (intrinsic PEEP, PEEPi) is the positive end-expiratory pressure that arises from incomplete expiration — gas remains trapped in the alveoli above the set PEEP. It is one of the most important waveform diagnoses because it causes hypotension (increased intrathoracic pressure reduces venous return), barotrauma, hypercapnia, and triggering difficulty (the patient must first overcome the intrinsic PEEP before generating a trigger).[1]
How auto-PEEP appears on the waveforms
The flow-time scalar is the primary screening tool. In a normal breath, expiratory flow decelerates exponentially and reaches the zero-flow baseline BEFORE the next inspiration begins. When auto-PEEP is present, expiratory flow does not return to zero — a residual expiratory flow persists at end-expiration, confirming that gas is still leaving the lung when the next breath is delivered. The magnitude of the residual flow roughly correlates with the severity of gas trapping.[1][7]
On the volume-time scalar, the expiratory volume does not return fully to baseline — the trapped volume is "stored" above functional residual capacity. [1]
Quantitative measurement — the expiratory hold
The expiratory hold (end-expiratory hold) measures auto-PEEP precisely. At end-expiration, occlude both inspiratory and expiratory valves for 1-2 seconds. With no flow, the alveolar pressure equilibrates with the airway pressure, and the ventilator reads the TOTAL PEEP (set PEEP + auto-PEEP). Auto-PEEP = total PEEP − set PEEP. A value above 5 cmH2O is clinically significant.[1]
Measuring and managing auto-PEEP at the bedside
- Screen on the flow-time scalar. Look at the expiratory limb of each breath. If expiratory flow does NOT reach the zero baseline before the next inspiration → suspected auto-PEEP.
- Confirm with an expiratory hold. Press the end-expiratory hold button. Read the total PEEP. Auto-PEEP = total PEEP − set PEEP. A value >5 cmH2O is significant.
- Assess for haemodynamic consequences. Check for hypotension (increased intrathoracic pressure → reduced venous return) and consider a fluid bolus or vasopressor if compromised.
- Reduce the respiratory rate. Fewer breaths per minute give more time for expiration per unit time.
- Shorten the inspiratory time. A shorter Ti lengthens the expiratory time (increase the I:E ratio toward 1:3 or 1:4). Increase peak inspiratory flow in VC (which shortens Ti for a given Vt).
- Reduce the tidal volume if Vt is large — less volume to exhale per breath.
- Treat the obstruction. Nebulised bronchodilators (salbutamol, ipratropium) for bronchospasm; suction for secretions; corticosteroids for airway inflammation.
- Set external PEEP at about 75-80 per cent of the auto-PEEP. External PEEP acts as a counter-pressure that reduces the work of triggering (the patient no longer needs to decompress the full intrinsic PEEP) without worsening hyperinflation, provided external PEEP does not exceed auto-PEEP.
Why auto-PEEP causes ineffective triggering
In a patient with auto-PEEP attempting to trigger a breath, the inspiratory muscles must first generate enough negative pressure to overcome the INTRINSIC PEEP before any flow change is detectable at the airway opening (where the trigger sensor sits). If the patient's effort is insufficient to decompress the intrinsic PEEP, no trigger signal reaches the ventilator → an ineffective (missed) trigger. This is the commonest mechanism of ineffective triggering in COPD, and the fix is to reduce auto-PEEP (lower RR, shorter Ti) and apply modest external PEEP.[4][5]
Patient-ventilator asynchrony — the five major types
Patient-ventilator asynchrony is the mismatch between the patient's neural respiratory timing and the ventilator's delivery. It is common (up to a quarter of mechanically ventilated patients have significant asynchrony), harmful (prolonged ventilation, delayed weaning, discomfort, worse outcomes), and — critically — it is VISIBLE on the waveforms before it appears in the vital signs.[2][4][7]
1. Ineffective triggering (missed trigger)
Waveform signature: a downward deflection in the pressure-time scalar (or a deflection in the flow-time scalar) that represents a patient inspiratory effort, but NO ventilator breath follows. The patient tries to trigger, fails, and the effort is wasted. Often visible as a regular series of small pressure dips between delivered breaths. [1]
Causes: the trigger threshold is too insensitive (high trigger setting), or — most commonly in COPD — auto-PEEP means the patient cannot generate enough pressure change at the airway opening to reach the trigger threshold. Other causes: respiratory muscle weakness, oversedation, excessive set respiratory rate (the ventilator is already breathing faster than the patient wants). [1]
Correction: make the trigger more sensitive (flow trigger 1-2 L/min, or pressure trigger -0.5 to -1 cmH2O). Reduce auto-PEEP (lower RR, shorter Ti, treat bronchospasm). Reduce the set rate if the patient is being over-ventilated.[4][5]
2. Double triggering
Waveform signature: two ventilator breaths delivered within a single patient inspiratory effort — the second breath is triggered within about half a second of the first (before the patient's neural inspiration has ended). On the pressure-time scalar, the two breaths are back-to-back with no intervening expiratory phase; the flow-time scalar shows two inspiratory flow peaks with a minimal or absent expiratory dip between them. [1]
Causes: the delivered flow or volume is INSUFFICIENT for the patient's demand. The patient is still inhaling when the ventilator cycles the first breath to expiration, and the continuing inspiratory effort immediately triggers a second breath (breath stacking). This is the commonest asynchrony in many ICUs. In PS, an overly high cycle-off percentage (premature cycling) can also cause double triggering. [1]
Correction: increase the inspiratory flow rate (VC), or switch to PS/PC where flow is variable and demand-matched. Increase the tidal volume or inspiratory time if appropriate. In PS, decrease the cycle-off percentage to lengthen inspiration.[4][7]
3. Auto-triggering
Waveform signature: the ventilator delivers breaths WITHOUT any preceding patient effort — the rate is irregular and often faster than set, with no pressure or flow deflection before the inspiratory rise. Breath timing does not match the patient's own respiratory rhythm. [1]
Causes: the trigger is TOO sensitive — circuit movement, condensation sloshing in the tubing, cardiac oscillations (the heart beating against the airway moves enough gas to trigger a flow sensor), water in the circuit, or a circuit leak that creates a continuous flow change. Also seen with an excessively sensitive flow trigger in the presence of a leak. [1]
Correction: make the trigger less sensitive. Drain condensation from the circuit. Check for and repair leaks. If the patient has an intrinsic rhythm (e.g., cardiac oscillation), a slightly less sensitive trigger or a pressure trigger may be more appropriate than a flow trigger.[7]
4. Flow starvation (flow asynchrony)
Waveform signature: in VC, a CONCAVITY or downward notch in the mid-inspiratory portion of the pressure-time scalar — the patient is pulling harder than the delivered flow, drawing airway pressure below the expected trajectory. The patient appears to "suck" against the ventilator. The flow-time scalar may show the inspiratory flow remains at its set (constant) value despite the patient's increased demand. [1]
Causes: the set inspiratory flow is lower than the patient's demand. This is inherent to constant-flow VC, which cannot increase flow in response to effort. Common in patients with high respiratory drive (sepsis, metabolic acidosis, hypoxaemia, pain, anxiety). [1]
Correction: increase the set inspiratory flow rate. Switch to a decelerating flow pattern or to PS/PC, where flow is variable and rises to meet demand. Treat the underlying cause of high drive (analgesia, correction of acidosis, oxygenation, antipyresis).[1][7]
5. Cycle asynchrony (premature and delayed cycling)
Waveform signature: an end-inspiratory pressure spike on the pressure-time scalar in PS signals DELAYED cycling — the ventilator is still insufflating (inspiratory flow above the cycle-off threshold) when the patient has already begun to exhale; the patient actively expires against positive pressure, producing a sharp pressure spike at end-inspiration. Conversely, an abrupt cessation of inspiratory flow followed by an immediate second trigger (double trigger) signals PREMATURE cycling — the ventilator cycled to expiration before the patient's neural inspiration ended. [1]
Causes: the inspiratory time is mismatched to the patient's neural timing. In PS, the cycle-off percentage controls this: too low a cycle-off (e.g., 5%) delays cycling (common in obstructive disease where expiratory flow falls slowly); too high a cycle-off (e.g., 50%) causes premature cycling. [1]
Correction: in PS, adjust the cycle-off percentage — increase it (e.g., to 30-40%) for delayed cycling in obstructive disease; decrease it (e.g., to 10-20%) for premature cycling in restrictive disease. In VC, adjust the inspiratory time or flow pattern to match the patient's neural timing.[4][7]
The five major asynchrony types — recognition at a glance
| Type | Waveform signature | Commonest cause | First correction |
|---|---|---|---|
| Ineffective trigger | Pressure dip or flow deflection with NO delivered breath | Auto-PEEP (COPD); insensitive trigger | Make trigger more sensitive; reduce auto-PEEP |
| Double trigger | Two breaths in one patient effort; back-to-back, no expiration between | Insufficient flow for demand (VC) | Increase flow; switch to PS/PC; check cycle-off |
| Auto-triggering | Breath delivered with NO patient effort; irregular fast rate | Trigger too sensitive; leak; water in circuit | Make trigger less sensitive; drain circuit; fix leak |
| Flow starvation | Mid-inspiratory concavity/notch on pressure scalar (VC) | Set flow < patient demand | Increase flow; switch to PS/PC (variable flow) |
| Cycle asynchrony | End-inspiratory pressure spike (delayed) or double trigger (premature) | Cycle-off % mismatch in PS; Ti mismatch | Adjust cycle-off %; adjust inspiratory time |
Quantifying asynchrony — the Asynchrony Index
Asynchrony can be QUANTIFIED from a short waveform recording, not merely eyeballed. The Asynchrony Index (AI) = (number of asynchrony events ÷ total breaths [triggered + machine]) × 100, measured over a representative window (typically 5-30 minutes). Severe asynchrony is defined as AI >10% — this threshold, established by Thille (2006) and de Wit (2009), identifies patients in whom asynchrony is independently associated with prolonged mechanical ventilation and worse outcomes. If AI >10%, systematically address each modifiable cause: trigger sensitivity, auto-PEEP, demand matching (flow rate or mode), and cycling criteria.[4][5]
The pressure-volume (P-V) loop in detail — hysteresis, inflection points, and overdistension
The P-V loop is the most information-dense single graphic in mechanical ventilation. From one loop you can read compliance (slope), recruitment opportunity (lower inflection point), overdistension (upper inflection point), and energy dissipation (hysteresis).[1][3]
Loop orientation and direction
The P-V loop plots airway pressure (x-axis) against lung volume (y-axis). The loop is drawn CLOCKWISE for a passive breath: the inspiratory limb moves from left (PEEP) to right (end-inspiration), and the expiratory limb returns from right to left. The inspiratory limb lies to the RIGHT of (below) the expiratory limb — at any given volume, the inspiratory pressure is higher than the expiratory pressure because of tissue resistance and surfactant hysteresis.[1]
The four features to extract from every P-V loop
The four P-V loop features and their clinical meaning
| Feature | What it is | How to read it | Clinical action |
|---|---|---|---|
| Slope = compliance | ΔV/ΔP of the loop (steepness of the mid-portion) | Draw a line along the steep part of the inspiratory limb. Steeper = more compliant; flatter = stiffer lung | Calculate Cstat = Vt / (Pplat − PEEP). Normal 50-100 mL/cmH2O; ARDS often 20-40 |
| Lower inflection point (LIP) | The pressure at which collapsed alveoli begin to recruit (slope suddenly steepens at low pressure) | Find where the flat low-pressure segment transitions to the steep mid-portion | Historically: set PEEP just ABOVE the LIP to keep recruited alveoli open. Controversial — not reliably visible on dynamic loops |
| Upper inflection point (UIP) | The pressure at which the lung is fully recruited and further pressure overdistends (slope flattens at high pressure — "beaking") | Find where the steep mid-portion flattens toward the top of inspiration | Keep end-inspiratory (plateau) pressure BELOW the UIP — typically Pplat <30 cmH2O — to avoid overdistension and VILI |
| Hysteresis | The gap between inspiratory and expiratory limbs; the area between them = energy dissipated per breath (tissue viscoelastic resistance + surfactant + recruitment-derecruitment) | The inspiratory limb lies to the right of the expiratory limb; greater separation = more hysteresis | Increased hysteresis = ARDS, surfactant dysfunction, ongoing recruitment-derecruitment. Monitor for change |
Hysteresis — why the limbs don't overlap
The inspiratory and expiratory limbs follow different paths because the lung is a viscoelastic structure with surfactant. During inspiration, pressure opens alveoli against tissue resistance and recruitment thresholds; during expiration, alveoli close at a lower pressure than they opened (a consequence of surfactant's surface-tension dynamics and the geometric instability of recruitment-derecruitment). The AREA enclosed by the loop equals the mechanical work dissipated in tissue resistance and surfactant — it is not the total work of breathing (which includes the elastic work stored and returned). Increased hysteresis is a feature of ARDS, where heterogeneous, recruitable lung cycles between open and closed with each breath.[1][1]
Overdistension and "beaking"
When the upper inflection point is reached, the inspiratory limb FLATTENS — additional pressure produces almost no additional volume because the lung is fully recruited and further pressure only overstretches the open alveoli. This flattening is called beaking. At the beak:
- The tidal volume is too large for the aerated ("baby") lung — reduce Vt.
- PEEP may be too high (the lung is already over-recruited at end-expiration) — reduce PEEP and recheck.
- The plateau pressure is almost certainly >30 cmH2O.
- The driving pressure (Pplat − PEEP) is elevated, the strongest ventilatory predictor of mortality in ARDS (Amato 2015).[3]
Static vs dynamic P-V loops
Dynamic P-V loops displayed in real time by the ventilator are useful but include a resistive pressure component (they are generated during flow). To identify the TRUE lower and upper inflection points, a low-flow (quasi-static) inflation P-V curve is performed: the patient is deeply sedated and paralysed, and the ventilator delivers a constant low inspiratory flow (e.g., 5-8 L/min) so that resistive pressure is minimised and the curve approximates the static compliance curve. Modern practice favours best-compliance PEEP titration (the PEEP that gives the highest compliance / lowest driving pressure) over inflection-point methods, because recruitability varies between patients and the LIP is often a gradual transition rather than a sharp point.[1][6]
The flow-volume (F-V) loop in detail
The F-V loop plots flow (y-axis) against volume (x-axis). Inspiration is above the baseline (positive flow); expiration below (negative flow). It complements the P-V loop by foregrounding flow information.[1]
Key F-V loop features
- Expiratory limb does not return to zero flow → auto-PEEP. The loop fails to close — the expiratory flow is still above (or below, depending on axis convention) the zero-flow line when the next inspiration begins. This is the F-V loop equivalent of the flow-time scalar's truncated expiratory limb.
- Concave (scooped) expiratory limb → expiratory obstruction (COPD, asthma). The expiratory flow falls rapidly initially, then plateaus at a low level as small-airway collapse limits further flow. The degree of scooping correlates with severity.
- Sawtooth oscillation → secretions in the airway or upper-airway oscillation (a regular low-amplitude ripple on the flow trace). Suctioning resolves it if secretions were the cause.
- Leak → the inspiratory and expiratory volumes do not match. The loop fails to close along the volume axis — the expiratory limb does not return to zero volume. Causes: cuff leak, bronchopleural fistula, circuit disconnect.
- Reduced inspiratory flow limb → if peak inspiratory flow is lower than expected, suspect flow limitation, a kinked tube, or insufficient ventilator flow delivery in VC.[1][7]
Bedside waveform interpretation — the structured daily review
Waveform interpretation is a daily (and often hourly) ICU skill. The goal is a STRUCTURED pass through the scalars and loops that screens for the common, actionable problems — high airway pressure, auto-PEEP, overdistension, asynchrony, and leak — in under two minutes at the bedside.[1][8]
The two-minute bedside waveform review
- Identify the mode. Is the pressure-time scalar a progressive rise (VC) or a square wave (PC/PS)? Is the inspiratory flow square (VC) or decelerating (PC/PS)? This tells you the independent variable and what to expect.
- Read the PIP and trend it. Note the peak inspiratory pressure. A rising PIP prompts an inspiratory hold.
- Inspiratory hold → read Pplat. Now you have PIP, Pplat, and PEEP. Calculate the resistive gradient (PIP − Pplat; normal 4-6 cmH2O) and the driving pressure (Pplat − PEEP; target <15 cmH2O).
- Apply the diagnostic split. High PIP + normal Pplat = resistance problem (suction, bronchodilate, check tube). High PIP + high Pplat = compliance problem (reduce Vt, drain pneumothorax, diurese, reposition tube).
- Check the expiratory limb of the flow-time scalar. Does expiratory flow return to zero? If not → auto-PEEP → confirm with an expiratory hold, then reduce RR, shorten Ti, treat obstruction.
- Look at the P-V loop. Is the slope appropriate (not too flat)? Is there beaking (overdistension → reduce Vt)? Is there a visible lower inflection (consider PEEP)?
- Look at the F-V loop. Is the expiratory limb scooped (obstruction)? Is there a sawtooth (secretions → suction)? Does the loop close (no leak)?
- Screen for asynchrony. Watch for 30-60 seconds. Look for pressure dips without breaths (ineffective triggers), back-to-back breaths (double triggers), irregular fast breaths without effort (auto-triggering), mid-inspiratory notches (flow starvation), and end-inspiratory spikes (delayed cycling).
- Check the volume-time scalar. Compare inspiratory and expiratory volumes for leak. Confirm the delivered Vt matches the set Vt in VC.
- Calculate the asynchrony index if asynchrony is frequent. If AI >10%, systematically correct trigger, auto-PEEP, flow, and cycling.
How to perform the inspiratory and expiratory hold manoeuvres
The two occlusion manoeuvres are the cornerstone of quantitative waveform analysis. They create brief periods of ZERO FLOW during which airway pressure equilibrates with alveolar pressure, allowing direct measurement of plateau pressure and auto-PEEP.[1]
Inspiratory hold (end-inspiratory pause):
- Performed at end-inspiration. Press and hold the inspiratory hold button. The inspiratory valve stays open and the expiratory valve closes for 0.5-2 seconds.
- During the pause, flow falls to zero and airway pressure drops from PIP (dynamic, includes resistive component) to Pplat (static, elastic component only).
- Read Pplat. The gradient PIP − Pplat = resistive pressure. The driving pressure ΔP = Pplat − PEEP.
- Requires a passive patient (no active inspiration or expiration during the hold, or the measurement is invalid). Brief and safe in most patients; monitor for hypotension or desaturation if held too long. [1]
Expiratory hold (end-expiratory pause):
- Performed at end-expiration. Press and hold the expiratory hold button. Both valves close for 1-2 seconds.
- During the pause, any trapped gas equilibrates and the airway pressure rises from set PEEP to the total PEEP (set PEEP + auto-PEEP).
- Read total PEEP. Auto-PEEP = total PEEP − set PEEP.
- Also requires a passive patient. If the patient breathes during the hold, the measurement is unreliable. [1]
SAQ — Acute rise in peak airway pressure in a ventilated patient
10 minutes · 10 marks
A 70-year-old man with severe COPD exacerbation is 24 hours into volume-control ventilation (Vt 450 mL, RR 14, PEEP 5, FiO2 0.35). The nurse calls you because the peak inspiratory pressure has risen over the last 30 minutes from 28 to 52 cmH2O, with falling SpO2 and new hypotension (BP 84/50). Describe your structured waveform-based assessment and immediate management.
SAQ — Pressure-volume loop interpretation in ARDS
10 minutes · 10 marks
A 50-year-old woman with severe ARDS (PaO2/FiO2 110) is in volume-control ventilation (Vt 6 mL/kg PBW, PEEP 10). On the live pressure-volume loop the inspiratory limb is flat (low slope) and FLATTENS further at the top ('beaking'), and the calculated static compliance is 28 mL/cmH2O. Critically appraise the loop and outline the ventilator adjustments.
Red flags
Additional red flags
Clinical pearls
Key trials and evidence
Amato 2015 — Driving pressure and survival in ARDS (PMID 25844785)
Source
New England Journal of Medicine — meta-analysis of 3,562 patients from 9 ARDS randomised trials
Key finding
Driving pressure (ΔP = Pplat − PEEP) was the STRONGEST ventilatory predictor of survival — stronger than Vt, PEEP, or Pplat alone
Threshold
ΔP >15 cmH2O associated with increased mortality
Clinical bottom line
Monitor ΔP on the P-V loop and inspiratory hold. If ΔP >15: reduce Vt or optimise PEEP to minimise ΔP. The driving pressure captures the stress on the aerated lung better than tidal volume alone.
Why it matters for waveforms
Established the P-V loop and driving pressure as the central lung-protective monitoring tools in ARDS
Thille 2006 — Patient-ventilator asynchrony during assisted mechanical ventilation (PMID 17032638)
Source
American Journal of Respiratory and Critical Care Medicine — prospective observational study, 62 intubated patients
Study design
30-minute waveform recordings at least once daily; asynchrony index (AI) = asynchrony events / total breaths × 100
Key finding
Severe asynchrony (AI >10%) occurred in 24% of patients and was independently associated with prolonged mechanical ventilation and delayed weaning
Asynchrony types
Ineffective triggering was the commonest type, followed by double triggering
Clinical bottom line
Asynchrony is common, quantifiable from the waveform, and clinically meaningful when AI >10%. Daily waveform review and prompt correction (trigger sensitivity, auto-PEEP, demand matching) is part of standard ventilator care.
Why it matters for waveforms
Established the 10% Asynchrony Index threshold used worldwide and validated waveform-based asynchrony counting
de Wit 2009 — Ineffective triggering predicts increased duration of mechanical ventilation (PMID 19710428)
Source
Critical Care Medicine — prospective observational cohort
Key finding
Ineffective triggering was the most common asynchrony and independently predicted longer duration of mechanical ventilation
Clinical bottom line
Ineffective (missed) triggering — most often due to auto-PEEP in COPD or an insensitive trigger — is not benign. Identifying and correcting it (reduce auto-PEEP, adjust trigger sensitivity) may shorten ventilation.
ART 2017 — Alveolar Recruitment for ARDS Trial (PMID 28615069)
Source
JAMA — multicentre RCT, 1,010 patients with moderate-to-severe ARDS
Study design
Strategy of recruitment manoeuvre + PEEP titration to BEST COMPLIANCE (highest static compliance / lowest driving pressure) on the P-V loop vs standard ARDSNet PEEP/FiO2 table
Key finding
Higher PEEP guided by compliance (driving-pressure minimisation) did NOT reduce 28-day mortality; trend to HARM (28-day mortality 34.8% vs 27.8%)
Hypothesis
The compliance-guided approach recruited lung in some patients but OVERDISTENDED others — harm in patients with poorly recruitable lung
Clinical bottom line
Driving pressure and P-V-loop compliance are powerful MONITORING tools, but aggressively maximising PEEP for all ARDS patients can cause harm. Apply compliance-guided PEEP selectively to recruitable lung; keep ΔP <15 cmH2O where achievable, individualised to the patient.
Why it matters for waveforms
Cautionary tale — the P-V loop and driving pressure are diagnostic tools, but using them to drive a one-size-fits-all protocol can cause harm. Waveform-guided ventilation must be individualised.
Blanch 2015 — Asynchronies during mechanical ventilation are associated with mortality (PMID 25936282)
Source
Intensive Care Medicine — prospective multicentre observational study (VIDIICS project), 50 ICU patients monitored continuously
Key finding
Asynchrony burden over 24 hours was independently associated with ICU mortality — patients with higher asynchrony rates had worse outcomes
Clinical bottom line
Asynchrony is not merely a comfort issue — a high asynchrony burden is a marker of (and likely contributor to) worse outcomes. Continuous waveform monitoring and prompt correction is warranted.
Prognosis and clinical significance of waveform findings
Waveform findings and their prognostic significance
| Finding | Clinical significance | Management |
|---|---|---|
| High driving pressure (ΔP >15 cmH2O) | Strongest ventilatory predictor of mortality in ARDS (Amato 2015) | Reduce Vt; optimise PEEP to minimise ΔP |
| Auto-PEEP >5 cmH2O | Gas trapping, hypotension (reduced venous return), barotrauma risk, ineffective triggering | Reduce RR; shorten Ti; lengthen expiratory time; treat obstruction |
| Beaking on P-V loop | Alveolar overdistension → VILI risk | Reduce Vt; consider reducing PEEP |
| Asynchrony Index >10% | Prolonged mechanical ventilation, delayed weaning, worse outcomes (Thille 2006; de Wit 2009) | Correct trigger, auto-PEEP, flow/demand matching, cycling criteria |
| Sawtooth on flow/pressure | Secretions → atelectasis, obstruction, VAP risk | Suction the airway; reassess for mucus plug |
| Sudden rise in PIP and Pplat | Acute derecruitment, mucus plug, main-stem intubation, tension pneumothorax | Examine patient; inspiratory hold; chest X-ray; treat cause |
Quick reference — the high-yield exam one-liners for ventilator waveforms
| Waveform rule | One-liner |
|---|---|
| PIP vs Pplat | High PIP + normal Pplat = resistance; high PIP + high Pplat = compliance |
| Driving pressure | ΔP = Pplat − PEEP; the strongest ventilatory predictor of survival; target <15 cmH2O |
| Static compliance | Cstat = Vt / (Pplat − PEEP); normal 50-100 mL/cmH2O |
| Auto-PEEP screening | Expiratory flow not returning to zero on the flow-time scalar = auto-PEEP |
| Auto-PEEP measurement | Expiratory hold: total PEEP − set PEEP = auto-PEEP |
| VC flow pattern | Square flow (constant) = VC; decelerating flow = PC/PS |
| Overdistension | Beaking on the P-V loop = reduce Vt |
| Commonest asynchrony | Double triggering = flow asynchrony = patient wants more flow |
| Subtlest asynchrony | Missed trigger (auto-PEEP in COPD is the commonest cause) |
| Asynchrony threshold | AI >10% = severe asynchrony = prolonged ventilation |
| Secretions | Sawtooth on flow/pressure scalar = suction |
| External PEEP for auto-PEEP | Set at 75-80% of the measured auto-PEEP |
References
- [1]Chatburn RL, Mireles-Cabodevila E, Sassoon CSH. How to Interpret Ventilator Waveforms Using the Taxonomy for Modes of Mechanical Ventilation Respir Care, 2026.PMID 41631602
- [2]Blanch L, Villagra A, Sales B, et al. Preparation of food grade carboxymethyl cellulose from corn husk agrowaste Int J Biol Macromol, 2015.PMID 25936282
- [3]Amato MBP, Meade MO, Slutsky AS, et al. Novel psoriasis therapies and patient outcomes, part 1: topical medications Cutis, 2015.PMID 25844785
- [4]Thille AW, Rodriguez P, Cabello B, Lellouche F, Brochard L. Are physicians ready for patients with Internet-based health information? J Med Internet Res, 2006.PMID 17032638
- [5]de Wit M, Miller KB, Green DA, Ostman HE, Gennings C, Epstein SK. Officials look toward fall for clinical data on pandemic vaccines Am J Health Syst Pharm, 2009.PMID 19710428
- [6]Cavalcanti AB, Suzumura ÉA, Laranjeira LN, et al. (ART Investigators). Regulatory landscape fusion in rhabdomyosarcoma through interactions between the PAX3 promoter and FOXO1 regulatory elements Genome Biol, 2017.PMID 28615069
- [7]Nilsestuen JO, Hargett KD. Single-beat estimation of right ventricular end-systolic pressure-volume relationship Am J Physiol Heart Circ Physiol, 2003.PMID 12531727
- [8]Longhini F, Colombo D, Pisani L, et al. Correction: Delayed diagnosis of a cerebrovascular accident associated with anabolic steroid use BMJ Case Rep, 2017.PMID 28202481
- [9]Mojoli F, Iotti GA, Torriglia F, et al. Use of okadaic acid to identify relevant phosphoepitopes in pathology: a focus on neurodegeneration Mar Drugs, 2013.PMID 23697949