ICU · Applied physiology
Applied Physiology — Cardiovascular, Respiratory, Renal, Neuro, GI and the Stress Response
Also known as Applied physiology · Oxygen delivery · Cardiac output determinants · Oxygen cascade · Oxyhaemoglobin dissociation curve · Venous return · Cerebral autoregulation · Dead space and shunt · Frank-Starling mechanism · Guyton cardiac function curve · Mean systemic filling pressure · Lung volumes and closing capacity · Hypoxic pulmonary vasoconstriction · Splanchnic circulation · Gut barrier and bacterial translocation · Stress response and the HPA axis · Critical illness hypermetabolism
The applied physiology that underpins every ICU intervention — the cardiovascular (the cardiac-output determinants of preload, afterload, contractility and heart rate; the Frank-Starling mechanism; the oxygen-delivery equation; the venous-return and the Guyton model; the cardiac and the vascular function curves and the mean systemic filling pressure; the Fick principle), the respiratory (the oxygen cascade; the oxyhaemoglobin dissociation curve and its shifts by the pH, the temperature, the 2,3-DPG and the CO2; the ventilation-perfusion matching; the dead space and the shunt; the compliance and the time constants; the lung volumes and the closing capacity; the work of breathing; the hypoxic ventilatory response and the carotid body; the hypoxic pulmonary vasoconstriction), the renal (the GFR determinants; the tubular sodium and water handling; the RAAS; the countercurrent multiplier; the acid-base handling), the neuro (the cerebral autoregulation; the Monro-Kellie doctrine; the cerebral perfusion pressure; the cerebral metabolic rate), the gastrointestinal (the splanchnic circulation and the gut barrier; the bacterial translocation; the hepatic clearance), and the stress response (the HPA axis and the cortisol; the catecholamines; the ebb-and-flow hypermetabolism; the non-thyroidal illness syndrome; the feeding strategy). Each system is applied to the critically ill patient — the shock, the ARDS, the AKI, the raised ICP, the multi-organ failure.
On this page & tools
Your progress
Saved locally on this device.
5 MCQs with explanations
Target exams
Overview & definition
The applied physiology is the CICM First Part backbone — the cardiovascular, the respiratory, the renal and the neuro physiology that explains every intervention at the bedside. The intensivist who understands the cardiac-output determinants, the oxygen-delivery equation, the oxyhaemoglobin dissociation curve, the dead space and the shunt, the GFR and the renal sodium handling, and the cerebral autoregulation can reason from the first principles rather than memorise the protocols.[1][1]
The framework rests on four systems applied to the critically ill: the cardiovascular (the cardiac output and the oxygen delivery), the respiratory (the oxygen cascade and the gas exchange), the renal (the filtration and the sodium-water balance), and the neuro (the cerebral blood flow and the intracranial pressure).[1]
Cardiovascular physiology: the cardiac output
The cardiac output (the CO) is the volume the heart ejects each minute — the stroke volume multiplied by the heart rate (the CO = SV × HR). The four determinants are the preload, the afterload, the contractility and the heart rate.[1][1]
The preload is the ventricular end-diastolic volume (or the wall tension — the Laplace relation), set by the venous return. The Frank-Starling mechanism: the greater the preload (the sarcomere stretch up to the optimum of 2.0 to 2.2 micrometres), the greater the contractility and the stroke volume — up to the plateau. Beyond the plateau (the failing, the overfilled ventricle), the further preload gives no extra output and causes the pulmonary oedema. The preload is estimated by the CVP, the GEDVI, the LVED area on the echo.[1][1]
The afterload is the ventricular wall tension during the ejection — the resistance against which the ventricle empties. The left-ventricular afterload approximates the systemic vascular resistance (the SVR). The higher the afterload, the lower the stroke volume (the increased afterload reduces the shortening). The afterload is reduced by the vasodilators and raised by the vasopressors.[1]
The contractility (the inotropy) is the force of the contraction at the constant preload and afterload — the intracellular calcium, the sympathetic drive (the beta-1). It is augmented by the inotropes (the dobutamine, the milrinone, the adrenaline) and reduced by the negative inotropes (the beta-blocker, the acidosis, the ischaemia, the sepsis).[1][1]
The heart rate — the tachycardia reduces the diastolic filling time (the reduced preload) and the coronary perfusion; the bradycardia limits the output when the stroke volume is fixed. The optimum is the rate that maximises the CO without compromising the filling.[1]
The venous return and the Guyton model
The cardiac output is set NOT by the heart alone but by the venous return — the Guyton model. The heart pumps what the venous system delivers. The venous return is driven by the systemic filling pressure (the mean systemic filling pressure, the MSFP — the pressure in the venous system when the flow stops, normally 7 to 10 mmHg) minus the right atrial pressure, divided by the venous resistance.[1]
The implication is profound: the venous return, NOT the heart, is the rate-limiting step in most of the shock. The fluid raises the MSFP (the venous return rises); the venoconstrictors (the noradrenaline) raise the MSFP by the venous capacitance reduction; the venodilators (the nitrate, the sepsis) lower the MSFP (the venous return falls).[1][1]
The Guyton cardiac and vascular function curves
The full Guyton framework plots two relationships on the same axes (the cardiac output on the y-axis, the right atrial pressure on the x-axis). The cardiac function curve is the familiar Frank-Starling relation — the cardiac output rises as the right atrial pressure (the preload) rises, then plateaus when the sarcomere reaches its optimum length. The vascular function curve is the mirror — the venous return falls linearly as the right atrial pressure rises (the pressure gradient for the venous return narrows), and reaches zero when the right atrial pressure equals the mean systemic filling pressure. The two curves intersect at one point — that single equilibrium point is the operating cardiac output and the operating right atrial pressure of the circulation.[14][15]
The mean systemic filling pressure (the MSFP) is the pivot of the vascular curve — the pressure in the whole systemic circulation when the flow stops, normally 7 to 12 mmHg. It is set by the stress volume (the blood volume that stretches the vessels, about 1.5 L) and the unstressed volume (the blood held in the venous capacitance, about 4.5 L). The MSFP rises when the fluid adds the stress volume, when the venoconstrictors (the noradrenaline, the vasopressin) shift the unstressed volume to the stressed, or when the sympathetic tone raises the venous recoil; it falls when the venodilators (the nitrate, the sepsis, the anaesthesia) increase the venous capacitance. The right atrial pressure is normally near zero, so the gradient of about 7 mmHg drives the venous return.[14][15]
The bedside corollaries are immediate. A bolus raises the MSFP — the vascular curve shifts up and right, the new intersection is at a higher cardiac output and a higher right atrial pressure. A pure vasoconstrictor (the phenylephrine) raises the arterial resistance but barely moves the MSFP — the cardiac output may fall. A venoconstrictor (the noradrenaline in the septic venodilation) raises the MSFP — the venous return and the cardiac output rise. The failing heart shifts the cardiac function curve down and right — the intersection moves to the higher right atrial pressure and the lower cardiac output (the congestive failure). The therapeutic target in any shock is to identify which curve is the limiting one and to shift it.[1][14][15]
The further implication: the right atrial pressure is NOT a marker of the volume status — it is the downstream pressure of the venous return. A high right atrial pressure can mean the overfilled ventricle (the cardiogenic shock) OR the empty venous system pumping against the stiff heart (the low MSFP, the venous-return failure). The fluid responsiveness (the rise of the stroke volume with the bolus) is the only reliable test of whether the heart is on the ascending limb of the Frank-Starling curve.[14][15]
The oxygen delivery and the Fick principle
The oxygen delivery (the DO2) is the cardiac output multiplied by the arterial oxygen content: the DO2 = CO × CaO2 × 10 (the mL/min, the factor 10 converts the dL to mL). The arterial oxygen content is the CaO2 = (1.34 × Hb × SaO2) + (0.003 × PaO2) — the haemoglobin-bound oxygen (the 1.34 mL/g, the saturation) plus the dissolved oxygen (the tiny 0.003 × PaO2). The normal DO2 is about 1000 mL/min.[1][1]
The oxygen consumption (the VO2) is the CO multiplied by the arteriovenous oxygen difference: the VO2 = CO × (CaO2 − CvO2) × 10. The normal VO2 is about 250 mL/min. The extraction ratio (the ER = VO2/DO2) is normally about 25 per cent — the body consumes a quarter of what is delivered.[1]
The Fick principle (the CO = VO2 / (CaO2 − CvO2)) is the gold-standard cardiac-output measurement — the CO is the oxygen consumption divided by the arteriovenous oxygen difference. The mixed venous saturation (the SvO2) reflects the balance: the normal SvO2 of 65 to 75 per cent; the low SvO2 (the increased extraction) signals the inadequate DO2 — the anaemia, the hypoxaemia, the low output, the high demand.[1][1]
The critical point: the VO2 is flow-independent (the tissue regulates its own uptake) UNTIL the DO2 falls below a critical threshold (about 300 mL/min/m2), below which the VO2 falls with the DO2 — the supply-dependence, the anaerobic metabolism, the lactate rise. The shocked patient with the rising lactate is below the critical DO2.[1][3]
Respiratory physiology: the oxygen cascade
The oxygen cascade is the stepwise fall of the oxygen partial pressure from the inspired gas to the mitochondrion. The dry inspired PO2 is 0.21 × 760 = 160 mmHg at the sea level. The humidification (the 47 mmHg of the water vapour) reduces it to 150 mmHg. The alveolar gas equation gives the alveolar PO2: the PAO2 = FiO2 × (Patm − PH2O) − PaCO2/R, where the R is the respiratory quotient (the 0.8). The normal PAO2 is about 100 mmHg. The arterial PO2 is about 95 mmHg (the small A-a gradient of less than 15 mmHg in the young). The mitochondrial PO2 is near 1 mmHg.[1][1]
The implication: the hypoxaemia arises from the lowered FiO2 (the altitude), the hypoventilation (the raised PaCO2 — the PAO2 falls by the alveolar gas equation), the V/Q mismatch, the shunt, the diffusion limitation, or the high A-a gradient.[1]
The oxyhaemoglobin dissociation curve
The oxyhaemoglobin dissociation curve is the sigmoid relationship between the PaO2 and the saturation. The sigmoid shape (the cooperative binding — the haem gains affinity as each oxygen binds) means the saturation is preserved across a wide PaO2 range (the flat upper portion — the 90 per cent saturation down to a PaO2 of 60 mmHg) but the steep lower portion means a small PaO2 fall below 60 mmHg causes a large saturation fall.[1][6]
The P50 (the PaO2 at the 50 per cent saturation) is the affinity index — the normal 26.6 mmHg. The right shift (the reduced affinity — the oxygen released to the tissues) is caused by the acidosis, the hypercapnia, the fever, the increased 2,3-DPG (the Bohr effect, the metabolic adaptation — the chronic anaemia, the high-altitude, the chronic hypoxia raise the 2,3-DPG).[6][7]
The left shift (the increased affinity — the oxygen held, the impaired tissue release) is caused by the alkalosis, the hypocapnia, the hypothermia, the reduced 2,3-DPG (the stored blood), the carboxyhaemoglobin (the CO poisoning), the methaemoglobin, the foetal haemoglobin.[6][7]
The ventilation-perfusion matching
The ideal gas exchange requires the matched ventilation and perfusion — the V/Q of about 0.8 (the ventilation 4 L/min, the perfusion 5 L/min). The V/Q mismatch is the commonest cause of the hypoxaemia.[1]
The low V/Q (the ventilation less than the perfusion — the pneumonia, the atelectasis, the oedema, the COPD) causes the hypoxaemia that is partially corrected by the supplemental oxygen. The shunt (the V/Q of zero — the perfusion without the ventilation) causes the refractory hypoxaemia (the oxygen does not help, for the blood bypasses the ventilated alveoli). The dead space (the V/Q of infinity — the ventilation without the perfusion) causes the CO2 retention and the wasted work of breathing; the Bohr equation gives the dead-space fraction.[5][1]
Hypoxic pulmonary vasoconstriction (the HPV) is the protective response — the hypoxic alveolus constricts its arteriole, the redirecting the blood to the ventilated alveoli, the optimising the V/Q. The HPV is impaired by the vasodilators, the sepsis, and the volatile anaesthetics.[1]
The compliance, the resistance and the time constants
The compliance (the C = ΔV/ΔP) is the distensibility — the lung and the chest wall. The static compliance (the 60 to 100 mL/cmH2O) reflects the elastic recoil; the dynamic compliance reflects the resistance too. The ARDS reduces the compliance (the stiff lung — the 20 to 40 mL/cmH2O); the emphysema raises it (the floppy lung).[1]
The airway resistance is set by the radius (the Poiseuille law — the resistance is proportional to the 1/r4) and the flow regime. The bronchoconstriction, the secretions and the oedema raise the resistance.[1]
The time constant (the τ = resistance × compliance) is the time for the alveolus to fill or empty by 63 per cent. The slow alveolus (the high resistance, the asthma, the COPD) has the long time constant — the inspiration must be long enough to fill it, else the air-trapping and the intrinsic PEEP. This is the basis of the long expiratory time in the obstructive disease.[1][1]
The work of breathing and the oxygen consumption
The work of breathing is the energy to move the gas and the lungs — normally 1 to 2 per cent of the oxygen consumption. The increased work (the low compliance of the ARDS, the high resistance of the asthma) can consume 20 to 30 per cent of the cardiac output — the fatigue, the hyperlactataemia, the respiratory failure. The mechanical ventilation unloads this work.[1]
The lung volumes and the capacities
The lung is divided into four volumes (the irreducible subunits) and four capacities (the sums of two or more volumes). The tidal volume (the VT, 500 mL) is the volume of each breath. The inspiratory reserve volume (the IRV, 3000 mL) is the extra volume inhaled above the tidal. The expiratory reserve volume (the ERV, 1100 mL) is the extra volume exhaled below the tidal. The residual volume (the RV, 1200 mL) is the volume that cannot be exhaled — the minimum that keeps the alveoli open. [1]
The capacities combine these: the inspiratory capacity (the IC = VT + IRV, 3500 mL); the functional residual capacity (the FRC = ERV + RV, 2300 mL — the oxygen reservoir at the end-expiration, the keystone of the safe apnoea); the vital capacity (the VC = IRV + VT + ERV, 4600 mL); the total lung capacity (the TLC = VC + RV, 5800 mL).[1][1]
The closing capacity (the CC) is the volume at which the small airways begin to close — the dependent airways collapse first because the pleural pressure exceeds the airway pressure. When the CC exceeds the FRC (the elderly, the obese, the supine, the pregnant, the anaesthesia), the airways close within the tidal breathing — the atelectasis, the shunt, the hypoxaemia. The PEEP recruits above the CC and the head-up position increases the FRC above the CC.[1][1]
The compliance of the lung-chest wall unit sums the reciprocals (the 1/Ctotal = 1/Clung + 1/Cwall) — normally 100 mL/cmH2O for the lung and 200 mL/cmH2O for the chest wall, giving 70 mL/cmH2O overall. In the ARDS both the Clung and the Cwall fall (the stiff oedematous lung and the oedematous chest wall, the abdominal distension). The lung-protective ventilation targets the tidal volume of 6 mL/kg of the predicted body weight (not the actual — the actual overfills the obese) and the plateau pressure below 30 cmH2O to operate on the safe, the steep portion of the compliance curve — the overdistension beyond the upper inflection point (the volutrauma) is avoided.[1][9]
The compliance curve and the PEEP
The compliance curve (the pressure-volume loop) is sigmoid — the low-compliance zone at the low lung volumes (the collapsed alveoli, the high opening pressure), the high-compliance zone in the mid-range (the linear portion where the small tidal volume operates), and the low-compliance zone at the high volumes (the overdistension). The PEEP sets the end-expiratory pressure above the lower inflection point — it keeps the alveoli open, the recruitment, the improved compliance and the oxygenation. Too little PEEP — the cyclic collapse (the atelectrauma). Too much PEEP — the overdistension (the volutrauma) and the reduced venous return (the high intrathoracic pressure). The best PEEP is the one that maximises the compliance (the best-compliance PEEP, the open-lung approach).[1][9]
The airway resistance and the laminar-turbulent transition
The airway resistance is dominated by the medium-sized bronchi (not the small airways — the total cross-sectional area of the small airways is vast). The flow is laminar in the small airways (the Poiseuille law — the resistance is proportional to the 1/r4 and to the viscosity) and turbulent in the upper airway and the large bronchi (the resistance is proportional to the density and to the flow squared). The implication for the inhaled helium-oxygen mixture (the heliox): the lower density reduces the turbulent-resistance work in the upper-airway obstruction (the croup, the post-extubation stridor). The bronchodilators target the small-airway smooth muscle.[1]
The ventilatory control and the carotid body
The ventilation is controlled by the central chemoreceptors (the medulla — the CSF pH, the proxy for the PaCO2) and the peripheral chemoreceptors (the carotid body — the PaO2, the PaCO2 and the pH).[8]
The carotid body is the primary sensor of the arterial PaO2 — the type-I glomus cell releases the neurotransmitter (the ATP, the acetylcholine) in response to the hypoxia, the signalling the afferent nerve. The hypoxic ventilatory response is the hyperbolic rise of the ventilation as the PaO2 falls — the rapid below a PaO2 of 60 mmHg.[8][1]
The implication: the patient with the chronic CO2 retention (the COPD) relies on the hypoxic drive — the over-oxygenation may reduce the ventilation and worsen the CO2 (though this is overstated; the V/Q mechanism is more important than the drive loss).[1]
The preoxygenation
The preoxygenation is the denitrogenation — the replacement of the alveolar nitrogen with the oxygen, the building the alveolar and the functional residual capacity oxygen reservoir. The 3 minutes of the 100 per cent oxygen (or the eight vital-capacity breaths) raises the alveolar oxygen reserve and prolongs the safe apnoea time — from about 1 minute to the 8 to 10 minutes (the normal, the not-pregnant, the not-obese patient).[4]
The safe apnoea time is the function of the FRC (the oxygen reservoir), the oxygen consumption (the rate of the drain) and the preoxygenation quality. The obese, the pregnant, the child and the septic have the reduced FRC and the raised consumption — the shortened safe apnoea time, the need for the apnoeic oxygenation (the nasal or the HFNC) and the rapid sequence.[4]
Renal physiology: the filtration and the sodium-water balance
The renal physiology underpins the AKI, the electrolyte disorders and the diuretic therapy.[1][1]
The GFR is set by the Starling forces across the glomerulus — the GFR = Kf × [(Pgc − Pbs) − (πgc − πbs)]. The glomerular capillary hydrostatic pressure (the Pgc) is the driving force; the raised by the dilated afferent and the constricted efferent (the angiotensin II). The reduction of the renal blood flow (the shock) or the raised intra-abdominal pressure lowers the Pgc and the GFR.[1]
The tubular sodium handling — the proximal tubule reabsorbs about 65 per cent (the active, the isotonic); the thick ascending limb (the loop — the Na-K-2Cl cotransporter, the furosemide site) reabsorbs 25 per cent; the distal tubule (the thiazide site) and the collecting duct (the aldosterone, the ENaC, the amiloride; the ADH-controlled water reabsorption) the remainder.[1]
The RAAS — the renin (the juxtaglomerular apparatus, the response to the low pressure, the low sodium, the sympathetic drive) cleaves the angiotensinogen to the angiotensin I; the ACE converts it to the angiotensin II (the vasoconstriction, the efferent constriction — the GFR preservation, the aldosterone release, the ADH and the thirst stimulation).[1]
The countercurrent multiplier — the loop of Henle establishes the medullary osmotic gradient (the 1200 mOsm/L at the papilla) by the active sodium reabsorption in the water-impermeable ascending limb; the ADH opens the collecting-duct water channels (the aquaporin-2) and the water is reabsorbed down the gradient — the concentrated urine. The loss of the medullary gradient (the sickle cell, the repeated loop diuretics) impairs the concentration.[1]
The acid-base — the kidney excretes the daily acid load (the 70 mEq) by the bicarbonate reclamation (the proximal), the titrable acid (the phosphate) and the ammonium excretion (the distal). The renal failure causes the metabolic acidosis (the reduced excretion) and the hyperkalaemia (the reduced distal secretion).[1][1]
Neuro physiology: the cerebral blood flow and the intracranial pressure
The neuro physiology underpins the raised-ICP and the brain-injury management.[1][1]
The cerebral autoregulation — the cerebral blood flow (the CBF) is maintained constant across the CPP of 50 to 150 mmHg by the myogenic and the metabolic regulation (the vasodilation at the low CPP, the vasoconstriction at the high). The autoregulation is impaired by the brain injury (the trauma, the SAH, the ischaemia, the hypercapnia, the hypoxia) — the CBF becomes pressure-passive, and the blood-pressure swings cause the ischaemia or the haemorrhage.[1]
The Monro-Kellie doctrine — the intracranial volume (the brain, the blood, the CSF) is fixed in the rigid skull; the increase in one component is compensated by the reduction of another until the compensatory reserve is exhausted, then the small volume increase causes the large ICP rise (the steep portion of the intracranial compliance curve).[1][1]
The cerebral perfusion pressure — the CPP = MAP − ICP. The CPP is the pressure that drives the CBF. The raised ICP (the oedema, the haematoma, the hydrocephalus) reduces the CPP unless the MAP is raised. The target CPP is 60 to 70 mmHg in the traumatic brain injury.[1]
The cerebral metabolic rate (the CMRO2) is the oxygen consumption of the brain — about 20 per cent of the whole-body consumption (the 50 mL/min). The CMRO2 is reduced by the sedation, the hypothermia and the barbiturates (the metabolic suppression for the refractory intracranial hypertension). The coupling — the CBF rises with the CMRO2 (the active brain region demands more flow).[1][1]
The PaCO2 is the potent CBF regulator — the 1 mmHg PaCO2 change causes the 1 to 2 mL/100g/min CBF change (the hypocapnia vasoconstricts, the hypercapnia vasodilates). This is the basis of the mild hypocapnia (the 30 to 35 mmHg) as a temporary ICP-lowering measure and the strict normocapnia to avoid the ischaemia.[1]
Gastrointestinal physiology: the splanchnic circulation and the gut barrier
The splanchnic circulation receives 25 per cent of the cardiac output at rest and the 35 per cent after the meal — the gut, the liver, the spleen and the pancreas. It is the physiological reservoir of the blood volume (the portal vein and the mesenteric veins hold about 30 per cent of the circulating volume) and the first organ system to be sacrificed in the shock — the splanchnic vasoconstriction diverts the flow to the heart and the brain, the mesenteric ischaemia, the mucosal injury.[1][18]
The splanchnic autoregulation is limited. Unlike the cerebral or the renal bed, the mesenteric circulation has a weak autoregulation — the flow is roughly proportional to the perfusion pressure below a MAP of 60 mmHg. The alpha-1-mediated vasoconstriction (the endogenous catecholamines of the shock, the exogenous noradrenaline) is unopposed in the splanchnic bed — the splanchnic ischaemia in the high-dose vasopressor state. The mesenteric venous desaturation (the gastric tonometry, the sublingual capnography) is the early, the sensitive marker of the splanchnic hypoperfusion, often preceding the systemic lactate rise.[1][18]
The gut barrier is the physical, the chemical and the immunological defence against the 100 trillion micro-organisms of the lumen. The physical barrier is the mucus layer (the goblet-cell secretion), the tight junctions (the zonulin-regulated) and the epithelial cell turnover (the 3- to 5-day renewal). The chemical barrier is the gastric acid (the pH below 3 sterilises the upper tract), the bile (the detergent) and the pancreatic enzymes. The immunological barrier is the gut-associated lymphoid tissue (the GALT — 70 per cent of the body's immune cells), the secretory IgA and the lamina propria macrophages.[1][1]
The gut hypothesis of the multi-organ failure — the splanchnic hypoperfusion injures the mucosa, the barrier breaks down (the increased permeability), the bacterial translocation (the endotoxin and the live bacteria reach the portal vein and the mesenteric lymph nodes), the systemic inflammatory response and the distal organ injury (the ARDS, the AKI). The clinical corollaries: the early enteral nutrition (within 48 hours) trophic-feeds the mucosa (the enteral starved mucosa atrophies, the tight junctions loosen); the selective decontamination of the digestive tract (the SDD) targets the overgrowth; the stress-ulcer prophylaxis is balanced against the bacterial overgrowth of the high gastric pH; the early gut motility (the prokinetic) is preferred.[1][1][13]
The liver is the metabolic hub — the dual supply (the portal vein 75 per cent, the hepatic artery 25 per cent, the hepatic arterial buffer response — the hepatic artery flow rises when the portal flow falls). The hepatic clearance of the lactate (the Cori cycle — the lactate to glucose, 60 per cent of the lactate clearance is hepatic) and the detoxification (the ammonia to urea) fail in the shock and the liver failure. The indocyanine green clearance (the ICG-PDR) is the dynamic test of the hepatic perfusion and the function — the value below 20 per cent per minute signals the hepatic dysfunction and predicts the mortality.[18]
The stress response: the HPA axis and the hypermetabolism
The critical illness triggers a stereotyped neuroendocrine and metabolic response — the fight-or-flight of the sustained injury. The two waves are described by the Cuthbertson ebb-and-flow model — the ebb phase (the first 24 to 48 hours, the hypometabolic, the low cardiac output, the hypothermia, the glucose conservation) followed by the flow phase (the days to weeks, the hypermetabolic, the high cardiac output, the fever, the catabolism, the glucose intolerance).[12][1]
The hypothalamic-pituitary-adrenal axis is the central coordinator. The stress (the cytokines, the pain, the hypovolaemia) signals the hypothalamus to release the corticotropin-releasing hormone — the CRH stimulates the pituitary ACTH — the ACTH stimulates the adrenal cortisol. The cortisol rises 5- to 10-fold within hours of the insult — the permissive hypercortisolaemia. The cortisol mobilises the glucose (the gluconeogenesis, the glycogenolysis), the protein catabolism (the muscle, the amino acids for the hepatic gluconeogenesis), the lipolysis, the anti-inflammatory effect (the NF-kB suppression, the cytokine reduction), the catecholamine potentiation and the vascular reactivity (the alpha-1 upregulation, the permissive role in the vasopressor responsiveness).[12]
The critical-illness-related corticosteroid insufficiency (the CIRCI) — the relative adrenal failure of the severe septic shock — is diagnosed by the random cortisol below 292 nmol/L OR the cortisol rise below 250 nmol/L after the 250 microgram ACTH. The corticosteroid supplementation (the hydrocortisone 200 mg/day) is reserved for the vasopressor-refractory septic shock, NOT the routine sepsis — the lack of the cortisol response in the severely stressed patient is the loss of the permissive vascular tone, the catecholamine-resistant vasoplegia.[11][12]
The catecholamines — the sympathetic surge and the adrenal medulla. The noradrenaline (the alpha-1, the venoconstriction and the arteriolar constriction), the adrenaline (the alpha and the beta, the chronotropy and the inotropy and the bronchodilation and the metabolic — the lactate rise from the beta-2 glycolysis), the dopamine (the dose-dependent receptor profile — the renal at the low, the cardiac at the moderate, the alpha at the high — abandoned for the high arrhythmia and mortality).[1]
The thyroid axis — the non-thyroidal illness syndrome (the NTIS, the low-T3 syndrome) is universal in the critically ill. The T4-to-T3 conversion falls (the deiodinase-1 suppression), the TSH is inappropriately normal or low. The T3 falls because the peripheral conversion is suppressed; the free T3 and the free T4 fall with the illness severity. The treatment is NOT routine — the T3 or the T4 supplementation does not improve the outcome and is reserved for the documented hypothyroidism.[12][17]
The hypermetabolism and the catabolism — the resting energy expenditure rises by 20 to 50 per cent above the predicted (the indirect-calorimetry is the gold standard, the predicted-equation estimates are unreliable in the obese and the septic). The nitrogen loss (the negative nitrogen balance) reaches 20 to 30 g/day in the severe burn — the muscle wasting of 1 to 2 per cent per day, the ICU-acquired weakness. The glucose intolerance (the stress hyperglycaemia — the insulin resistance of the cytokines, the cortisol and the catecholamines) is universal; the tight glucose control (the 4.4 to 6.1 mmol/L) of the Van den Berghe Leuven trial was the proof of concept but the hypoglycaemia harm and the NICE-SUGAR re-targeting established the moderate target of 6 to 10 mmol/L. The feeding strategy is the permissive underfeeding (the 70 to 80 per cent of the measured energy) with the full protein (1.5 to 2 g/kg/day) in the first week to avoid the refeeding and the overfeeding (the CO2 production, the hyperglycaemia, the hepatic steatosis).[12][13]
Applied: the physiology at the bedside
The applied physiology connects the first principles to the interventions.[1][1]
- The shock — the inadequate DO2. The haemorrhagic: the low preload (the venous return), the high SVR (the compensatory), the normal-high SV. The septic: the low SVR (the vasoplegia), the low MSFP (the venodilation), the impaired contractility, the high CO (the early) or the low (the late). The cardiogenic: the low contractility, the raised afterload (the compensatory), the high preload.[1][1]
- The ARDS — the low compliance (the stiff lung), the high dead space, the shunt (the refractory hypoxaemia), the low FRC, the raised work of breathing. The lung-protective ventilation (the low tidal volume — the reduced stress and strain, the plateau below 30 cmH2O) and the PEEP (the alveolar recruitment — the improved compliance and the oxygenation).[1][5]
- The AKI — the low GFR (the low Pgc in the shock), the high intra-abdominal pressure, the nephrotoxin, the obstruction. The fluid balance and the mean pressure are the physiological levers.[1]
- The raised ICP — the Monro-Kellie, the pressure-passive CBF (the impaired autoregulation). The CPP-guided therapy (the MAP maintenance, the ICP reduction — the head-up, the sedation, the osmotherapy, the CSF drainage).[1][1]
Monitoring the physiology
The physiological monitoring validates the reasoning.[2][3]
- The haemodynamics — the cardiac output (the thermodilution, the pulse-contour, the echo), the venous return (the CVP, the GEDVI), the SVR (the calculated), the SvO2 (the balance).[2][3]
- The respiratory — the tidal volume, the plateau pressure (the compliance), the PEEP, the capnography (the PaCO2 proxy, the dead space), the arterial gas (the PA-a gradient, the shunt fraction).[5]
- The renal — the urine output, the creatinine, the electrolytes, the acid-base.
- The neuro — the ICP, the CPP, the brain tissue oxygenation (the PbtO2), the jugular venous saturation.[1]
Prognosis
The applied physiology is the foundation of the ICU — the patient who is managed with the physiological reasoning (the targeted DO2, the lung-protective ventilation, the CPP-guided care) has the better outcome than the patient managed by the rote protocol. The haemodynamic management targeting the patient's own baseline (the personalised) is the modern direction.[3][1][1]
SAQ — The oxygen cascade and the A–a gradient
10 minutes · 10 marks
A 60-year-old man with community-acquired pneumonia is breathing room air. ABG: pH 7.32, PaCO2 32 mmHg, PaO2 50 mmHg, HCO3 18 mmol/L, lactate 3.1. The registrar asks you to explain the calculation that distinguishes a pure hypoventilatory hypoxaemia from a V/Q-mismatch lung problem.
SAQ — Guyton venous return and the shock states
10 minutes · 10 marks
A 55-year-old woman with septic shock from a urinary source has a right atrial pressure of 14 mmHg and a cardiac output of 3.2 L/min despite 30 mL/kg of crystalloid. The intensivist states her venous return has collapsed. Explain the Guyton model and how it explains the choice of vasopressor.
Clinical pearls
Comparison tables
The four shock states by the applied physiology
| Feature | The haemorrhagic (the hypovolaemic) | The septic (the distributive) | The cardiogenic | The obstructive |
|---|---|---|---|---|
| The MSFP | Low (the volume loss) | Low (the venodilation) | High (the venoconstriction) | Normal |
| The venous return | Low | Low (the low MSFP) | Low (the high right atrial pressure) | Low (the high right atrial pressure, the impaired filling) |
| The cardiac output | Low | High (early) or low (late) | Low | Low |
| The preload | Low | Low or normal | High | Low or normal |
| The afterload (the SVR) | High (the compensatory) | Low (the vasoplegia) | High (the compensatory) | Normal or high |
| The contractility | Normal | Impaired (the myocardial depression) | Impaired | Normal |
| The SvO2 | Low (the high extraction) | High (the impaired extraction) | Low | Low |
| The lactate | Raised | Raised | Raised | Raised |
| The key lever | The fluid and the blood (the MSFP restoration) | The fluid, the noradrenaline (the MSFP and the SVR), the source control | The inotrope, the diuretic, the revascularisation | The relief of the obstruction (the tamponade, the tension pneumothorax, the PE) |
The hypoxaemia mechanisms by the alveolar-arterial gradient
| The mechanism | The A-a gradient | The response to the 100 per cent oxygen | The examples |
|---|---|---|---|
| The hypoventilation | Normal | Full correction (the PAO2 rises) | The opiate, the neuromuscular, the brainstem |
| The low V/Q (the mismatch) | Raised | Good response (the V/Q improves with the oxygen) | The pneumonia, the COPD, the atelectasis |
| The shunt (the V/Q of zero) | Raised | Poor response (the blood bypasses the alveoli) | The ARDS, the pulmonary oedema, the lobar pneumonia, the PDA |
| The diffusion limitation | Raised | Good response | The pulmonary fibrosis, the emphysema |
| The low inspired PO2 | Normal | Full correction | The altitude, the hypoxic gas mixture |
The oxyhaemoglobin dissociation curve shifts
| The factor | The shift | The P50 change | The affinity | The clinical context |
|---|---|---|---|---|
| The acidosis (the low pH) | Right | Higher | Reduced — the oxygen released | The tissue demand |
| The alkalosis (the high pH) | Left | Lower | Increased — the oxygen held | The over-alkalinisation |
| The hypercapnia | Right | Higher | Reduced | The CO2 retention |
| The hypocapnia | Left | Lower | Increased | The over-ventilation |
| The fever | Right | Higher | Reduced | The sepsis |
| The hypothermia | Left | Lower | Increased | The targeted temperature management |
| The increased 2,3-DPG | Right | Higher | Reduced | The chronic anaemia, the high altitude, the chronic hypoxia |
| The reduced 2,3-DPG | Left | Lower | Increased | The stored blood, the massive transfusion |
| The carboxyhaemoglobin | Left | Lower | Increased (the CO binds the haem) | The CO poisoning |
| The methaemoglobin | Left | Lower | Increased | The benzocaine, the dapsone, the nitrate |
The cerebral blood flow determinants
| The determinant | The effect on the CBF | The magnitude |
|---|---|---|
| The PaCO2 | The 1 mmHg change → 1 to 2 mL/100g/min change | The 4 per cent per mmHg — the potent regulator |
| The PaO2 | The small effect until the PaO2 below 50 mmHg | The hypoxia → the vasodilation |
| The CPP (the MAP − ICP) | The constant CBF across the 50 to 150 mmHg (the autoregulation) | The plateau; the pressure-passive outside the range or in the injured brain |
| The CMRO2 (the coupling) | The active region → the higher flow | The 20 per cent of the whole-body consumption |
| The viscosity (the haematocrit) | The lower viscosity → the higher flow | The microcirculation, the exchange transfusion |
| The adenosine, the K+, the H+ (the metabolic) | The active-region vasodilation | The local matching |
The flow steps
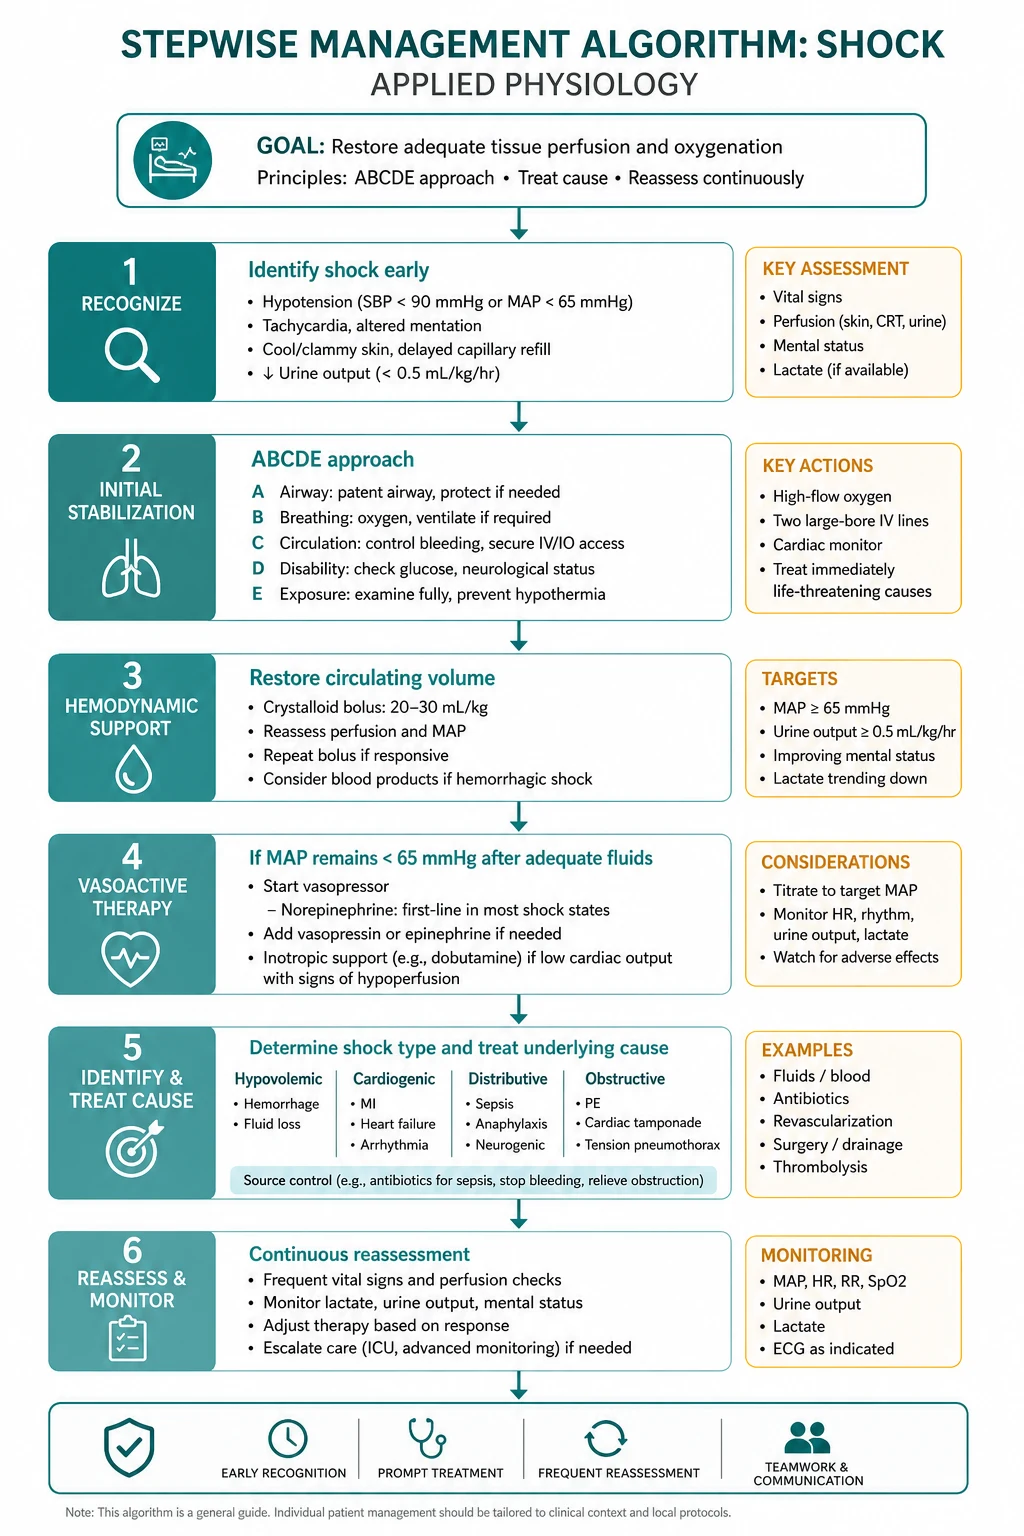
The physiological assessment of the shocked patient
- Recognise the shock — the inadequate DO2. The clinical (the mottled skin, the cold extremities, the oliguria, the altered mental state), the lactate (the rising or the persistent), the SvO2 (the low in the low-output shock, the high in the septic impaired-extraction shock).
- Identify which curve is limiting — the venous return (the MSFP) or the cardiac function. The fluid challenge or the passive leg raise; the echo (the underfilled versus the failing ventricle); the dynamic indices (the pulse-pressure or the stroke-volume variation).
- Target the lever — the fluid (the MSFP), the venoconstrictor (the noradrenaline in the septic venodilation), the inotrope (the cardiogenic), the source control (the septic).
- Restore the DO2 above the critical threshold — the CO (the preload, the afterload, the contractility, the rate), the CaO2 (the haemoglobin, the saturation). The lactate clearance is the marker.
- Reassess — the bedside physiology is dynamic. The fluid that helped at hour 0 may overload at hour 6. The repeated assessment is the only constant.
The lung-protective ventilation set-up
- Set the tidal volume at 6 mL/kg of the predicted (not the actual) body weight — the overdistension prevention.[9]
- Set the respiratory rate at 20 to 35 to maintain the normocapnia (the permissive hypercapnia if the plateau pressure is the constraint — the pH above 7.20 is tolerated).
- Set the PEEP to keep the alveoli open above the lower inflection point — the best-compliance or the best-oxygenation PEEP, titrated to the FiO2 (the ARDSNet table).[9]
- Limit the plateau pressure below 30 cmH2O — the transalveolar pressure, the stress and the strain.[9]
- Limit the driving pressure (the plateau minus the PEEP) below 15 cmH2O — the surrogate of the tidal lung strain, the strongest predictor of the survival.[9]
- Escalate if refractory — the prone positioning (the homogenisation, the lung recruitment, the V/Q improvement), the neuromuscular blockade (the early severe ARDS), the inhaled pulmonary vasodilator (the prostacyclin, the NO — the improved V/Q), the ECMO (the refractory, the most severe).
The raised-ICP management by the applied neuro physiology
- Position — the head-up 30 degrees, the midline (the venous drainage, the ICP reduction).
- Sedation and analgesia — the metabolic suppression (the CMRO2 reduction), the cough and the agitation prevention (the ICP spikes).
- Normocapnia, normoxia, normothermia, normoglycaemia — the four physiological normals (the hypercapnia, the hypoxia, the fever and the hyperglycaemia all raise the CMRO2 and the ICP).
- The CPP target 60 to 70 mmHg — the MAP raise (the noradrenaline) and the ICP reduction as the two levers.
- The osmotherapy — the mannitol 0.5 g/kg or the 3 per cent or 5 per cent hypertonic saline for the acute rise. The serum osmolality ceiling of 320 mOsm/L (the mannitol) or the sodium ceiling of 155 mmol/L (the hypertonic saline).
- The second-tier — the barbiturate coma (the CMRO2 and the CBF reduction), the decompressive craniectomy, the hypothermia (controversial), the surgical evacuation (the haematoma, the hydrocephalus).[16]
The trial cards
The ARDSNet low-tidal-volume trial (2000)
The design: the multicentre RCT of 6 mL/kg predicted body weight versus 12 mL/kg in the 861 patients with the acute lung injury and the ARDS.[9] The result: the 6 mL/kg arm reduced the 28-day mortality from 40 per cent to 31 per cent (the relative risk reduction of 22 per cent) and increased the ventilator-free days. The applied physiology: the low tidal volume operates on the safe, the steep portion of the compliance curve — the reduced stress and strain, the reduced volutrauma and the biotrauma. The plateau below 30 cmH2O and the driving pressure below 15 cmH2O are the surrogates of the lung-protective ventilation.
The Sepsis-3 definition (2016)
The design: the international consensus task force redefining the sepsis and the septic shock.[10] The result: the sepsis is now the life-threatening organ dysfunction caused by the dysregulated host response (the SOFA score of 2 or more as the operationalisation); the septic shock is the sepsis with the vasopressor requirement to maintain the MAP above 65 mmHg and the lactate above 2 mmol/L despite the adequate fluid. The applied physiology: the septic shock is the distributive (the low SVR and the low MSFP), the impaired-extraction (the high SvO2 despite the low DO2), the hyperlactataemic shock. The qSOFA (the altered mental state, the systolic below 100, the respiratory rate above 22) is the bedside screen.
The Surviving Sepsis Campaign 2016 (and 2021) guidelines
The design: the evidence-based guidelines for the sepsis and the septic shock management.[11] The result: the fluid (the 30 mL/kg crystalloid bolus), the early broad-spectrum antibiotic, the source control, the noradrenaline as the first-line vasopressor, the vasopressin as the second, the corticosteroid in the refractory, the lactate-guided resuscitation. The applied physiology: the early restoration of the MSFP (the fluid), the SVR (the noradrenaline), the source control (the inflammatory driver removal) and the DO2 above the critical threshold — the lactate clearance as the marker. The balanced crystalloid and the albumin are the fluid choices; the starch is harmful.
The Van den Berghe Leuven intensive insulin trial (2001)
The design: the single-centre surgical-ICU RCT of the tight glucose control (4.4 to 6.1 mmol/L) versus the conventional (10 to 11 mmol/L).[12] The result: the tight control reduced the mortality from 8 to 4.4 per cent (the surgical ICU); the medical-ICU replication was neutral and the NICE-SUGAR trial (2009) showed the harm of the hypoglycaemia in the broader population. The applied physiology: the stress hyperglycaemia (the cortisol, the catecholamines, the cytokine-mediated insulin resistance) is universal in the critical illness. The moderate target (6 to 10 mmol/L, the 8 to 10 in the 2021 update) is the modern standard — the tight control is abandoned because the hypoglycaemia harm exceeds the glycaemic benefit.
Red flags
References
- [1]Miller A. Energy, flow and pressure in the cardiovascular system: a narrative review of how the circulation works Anaesthesia, 2026.PMID 42157570
- [2]Mirus M, et al. Hemodynamic monitoring: basic principles in operation room and intensive care unit J Clin Monit Comput, 2026.PMID 41493520
- [3]Flick M, et al. Personalized hemodynamic management targeting preoperative baseline cardiac index in high-risk patients having major abdominal surgery: rationale and design of the international multicenter randomized PELICAN trial Trials, 2026.PMID 41904483
- [4]Nimmagadda U, et al. Preoxygenation: Physiologic Basis, Benefits, and Potential Risks Anesth Analg, 2017.PMID 28099321
- [5]Nakamura S, et al. Association Between Intraoperative Alveolar Dead Space Fraction and Early Extubation After Glenn and Fontan Procedures J Cardiothorac Vasc Anesth, 2026.PMID 42225457
- [6]Jaafar LS. 2,3-Diphosphoglycerate: the forgotten metabolic regulator of oxygen affinity Br J Nutr, 2025.PMID 41070558
- [7]Kumar A, et al. Effects of inhaled anaesthetic agents on the oxygen dissociation curve: An updated discussion J Perioper Pract, 2025.PMID 39991860
- [8]Honing M, et al. Cholinergic Chemotransmission and Anesthetic Drug Effects at the Carotid Bodies Molecules, 2020.PMID 33348537
- [9]Acute Respiratory Distress Syndrome Network; Brower RG; Matthay MA, et al. Ventilation with lower tidal volumes as compared with traditional tidal volumes for acute lung injury and the acute respiratory distress syndrome N Engl J Med, 2000.PMID 10793162
- [10]Singer M; Deutschman CS; Seymour CW, et al. The Third International Consensus Definitions for Sepsis and Septic Shock (Sepsis-3) JAMA, 2016.PMID 26903338
- [11]Rhodes A; Evans LE; Alhazzani W, et al. Surviving Sepsis Campaign: International Guidelines for Management of Sepsis and Septic Shock: 2016 Intensive Care Med, 2017.PMID 28101605
- [12]Van den Berghe G On the Neuroendocrinopathy of Critical Illness. Perspectives for Feeding and Novel Treatments Am J Respir Crit Care Med, 2016.PMID 27611700
- [13]Wischmeyer PE; Bear DE; Berger MM, et al. Personalized nutrition therapy in critical care: 10 expert recommendations Crit Care, 2023.PMID 37403125
- [14]Magder S Volume and its relationship to cardiac output and venous return Crit Care, 2016.PMID 27613307
- [15]Furst B; Gonzalez-Alonso J The heart, a secondary organ in the control of blood circulation Exp Physiol, 2025.PMID 38126953
- [16]Depreitere B; Citerio G; Smith M, et al. Cerebrovascular Autoregulation Monitoring in the Management of Adult Severe Traumatic Brain Injury: A Delphi Consensus of Clinicians Neurocrit Care, 2021.PMID 33495910
- [17]Mebis L; Debaveye Y; Visser TJ, et al. Changes within the thyroid axis during the course of critical illness Endocrinol Metab Clin North Am, 2006.PMID 17127148
- [18]Sakka SG Assessment of liver perfusion and function by indocyanine green in the perioperative setting and in critically ill patients J Clin Monit Comput, 2018.PMID 29039062