ICU · Resuscitation & shock
Fluid Responsiveness — Static & Dynamic Indices, Passive Leg Raise, SVV/PPV & Fluid Challenge
Also known as Fluid responsiveness · Passive leg raise · PLR · Stroke volume variation · SVV · Pulse pressure variation · PPV · Fluid challenge · Dynamic indices · End-expiratory occlusion test · EEOT · IVC distensibility
Fluid responsiveness is the prediction of whether a patient will increase stroke volume (or cardiac output) by at least 10 per cent in response to a fluid bolus — and only around half of ICU patients actually do. Static markers (CVP, PAOP) do NOT predict it; the curve is flat. Dynamic markers do: the passive leg raise (PLR) is the gold standard, reversible self-test that works in spontaneous breathing and atrial fibrillation (a rise in CO, SV or LVOT VTI above 10 per cent is positive). Pulse pressure variation (PPV) above 13 per cent and stroke volume variation (SVV) above 12 per cent require controlled mechanical ventilation with a tidal volume above 8 mL/kg and a regular rhythm. Fluid overload worsens outcome — the CLASSIC and CLOVERS trials mandate a restrictive strategy once the patient is no longer responsive.
On this page & tools
Your progress
Saved locally on this device.
Target exams
Red flags

Definition and why it matters
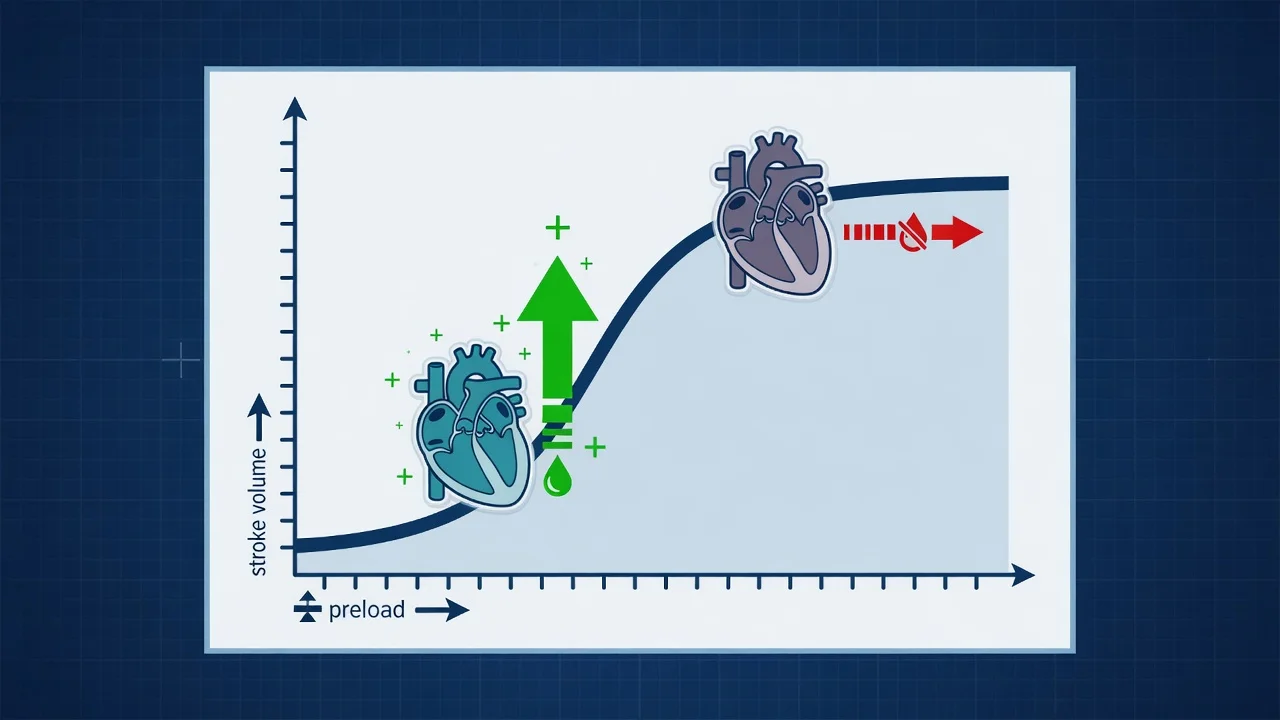
Fluid responsiveness is defined as a rise in stroke volume (SV) or cardiac output (CO) of at least 10 per cent (some authors 10 to 15 per cent) in response to a 250 to 500 mL fluid bolus.[1] It tells the clinician whether the patient's heart is operating on the steep (preload-dependent) portion of the Frank-Starling curve, where a fluid bolus will meaningfully increase stroke volume, or on the flat (preload-independent) portion, where extra fluid will only distend the venous system and leak into the interstitium.
The reason this matters is empirical: only about 50 per cent of ICU patients with circulatory failure are fluid responsive.[1][2] That means a blanket fluid bolus, given without testing, helps half the patients and harms the other half — and the harm from fluid overload is now well established (longer ventilation, more acute kidney injury, higher mortality).[5][6]
Why fluid responsiveness matters — the key numbers
The Frank-Starling principle — the concept that underpins everything
The heart's stroke volume depends on preload (end-diastolic fibre length). The relationship is non-linear: a steep initial limb, where increases in preload produce large increases in stroke volume (the patient is responsive), and a flat later limb, where further preload produces almost no change (the patient is non-responsive). The same numerical value of a filling pressure (e.g. CVP 8 mmHg) can sit anywhere on either limb — which is exactly why a single static measurement cannot predict the response to a bolus.[1][3]
Static indices — not predictive
Static indices are single-time-point measurements of pressure or volume. Despite a century of clinical use, they are not predictive of fluid responsiveness.[3]
CVP / RAP
Central venous pressure
- NOT predictive — flat CVP-fluid responsiveness curve
- Marik 2008 meta-analysis of 24 studies: NO relationship between CVP and responsiveness
- A low CVP does NOT guarantee and a high CVP does NOT exclude responsiveness
- Still useful as a target for the *endpoint* of resuscitation (trend), not for predicting a bolus response
PAOP / PCWP
Pulmonary artery occlusion pressure
- NOT predictive — suffers the same Frank-Starling problem as CVP
- Invasive, requires a pulmonary artery catheter
- PAOP does not reliably estimate left ventricular end-diastolic volume
- Largely abandoned as a guide to fluid therapy
GEDV / ITBV
Volumetric (transpulmonary thermodilution)
- Better than CVP/PAOP because they measure volume, not pressure
- Still a single static value — only modestly predictive
- Require a calibrated PiCCO/EV1000 system
- Main value is as part of an integrated transpulmonary thermodilution assessment
Dynamic indices — predictive
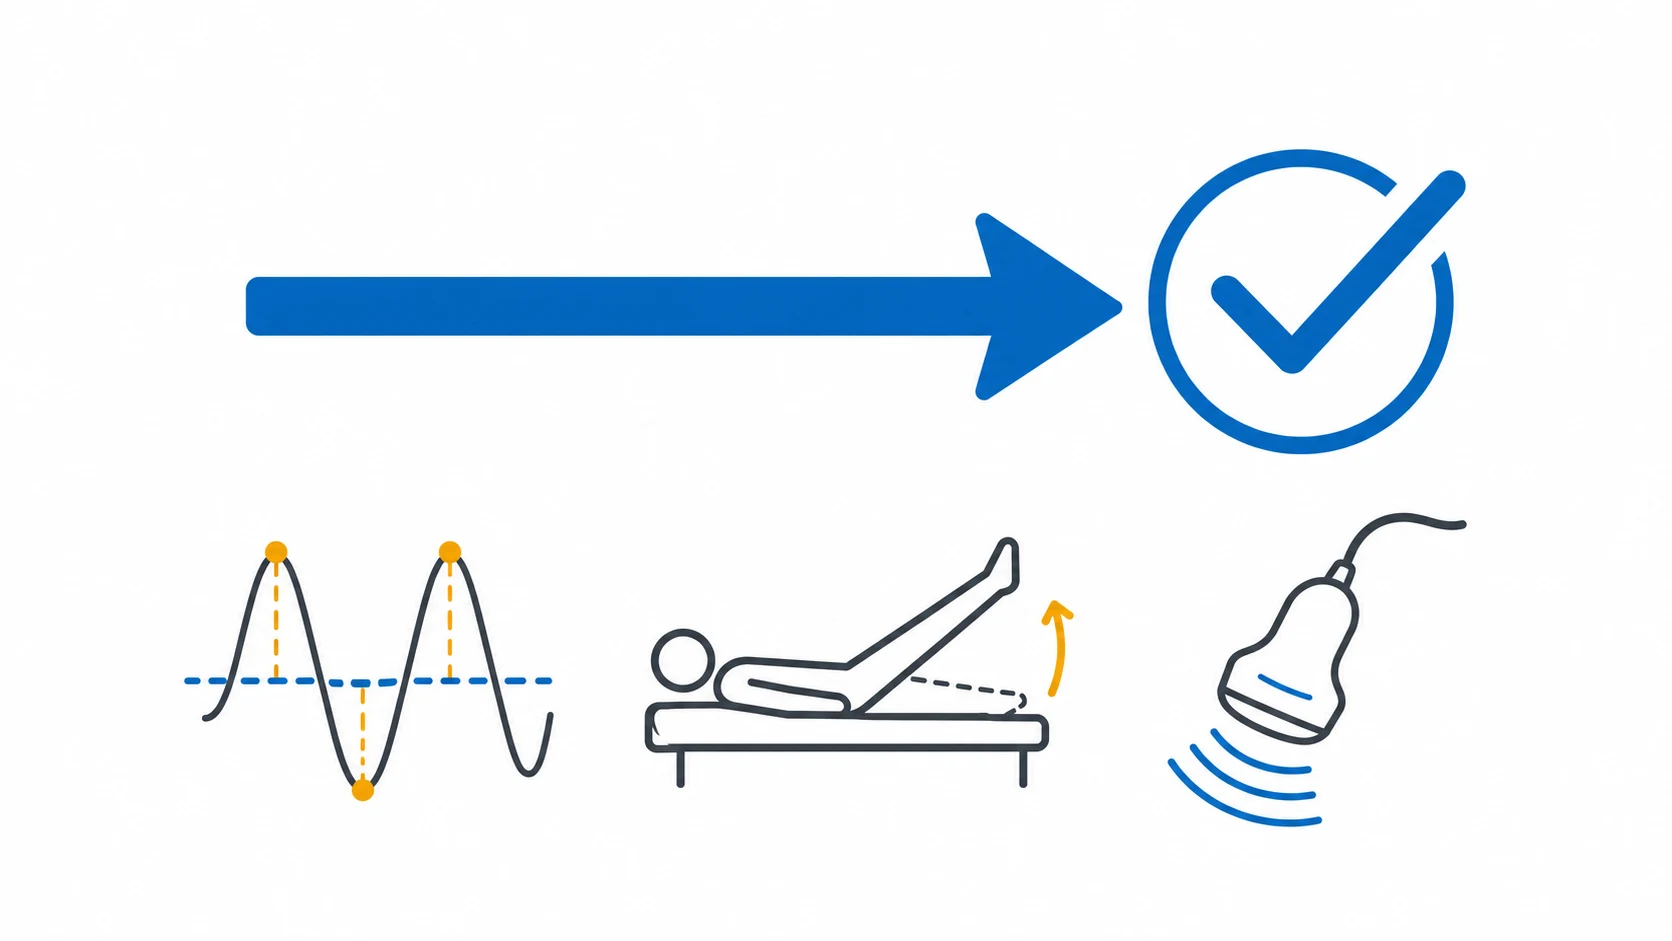
Dynamic indices provoke a change in preload and measure the change in output — they reveal the slope of the Frank-Starling curve at the patient's current position. There are two families: heart-lung interaction indices (PPV, SVV) and preload challenge tests (passive leg raise, fluid bolus, end-expiratory occlusion).[1][4]
Pulse pressure variation (PPV) and stroke volume variation (SVV)
During controlled mechanical ventilation, positive-pressure inspiration raises intrathoracic pressure, which reduces venous return and changes LV afterload. In a preload-dependent patient (steep Frank-Starling limb) this produces a measurable beat-to-beat fall in stroke volume and pulse pressure during inspiration. PPV and SVV quantify that variation.[4]
- PPV = (PPmax − PPmin) / [(PPmax + PPmin)/2] × 100. Threshold above 13 per cent predicts responsiveness.[1][4]
- SVV = the equivalent calculated from stroke volume. Threshold above 10 to 12 per cent predicts responsiveness.[4]
Marik's systematic review of 29 studies (Crit Care Med 2009) confirmed that dynamic arterial waveform variables reliably predict fluid responsiveness in mechanically ventilated patients — but only when the prerequisites are met.[4]
Passive leg raise (PLR) — the gold standard
The passive leg raise is a reversible, endogenous preload challenge: passive elevation of the lower limbs transfers roughly 300 mL of venous blood from the legs and splanchnic bed into the thorax, transiently raising cardiac preload exactly as a fluid bolus would — but without giving any fluid, so it is fully reversible.[1][2]
Monnet and Teboul's systematic review and meta-analysis (Intensive Care Med 2016) of 21 studies confirmed that the PLR-induced change in cardiac output is the most accurate predictor of fluid responsiveness, with the highest pooled sensitivity and specificity of any bedside method.[2]
Passive leg raise — correct technique
Start semi-recumbent at 45 degrees (head AND trunk up)
This is the critical first step. Starting supine is a common error — the 45-degree semi-recumbent start means the manoeuvre transfers the maximal venous volume and correctly tests the steepness of the Frank-Starling curve.
Tilt the bed: trunk flat, legs elevated to 45 degrees for 60-90 seconds
A whole-bed tilt is best (it keeps the trunk horizontal). If manual, keep the trunk horizontal. The effect peaks within 60-90 seconds and is gone within minutes.
Measure CO, SV or LVOT VTI in real time — BEFORE and DURING the peak
You MUST have a real-time cardiac output monitor: echocardiographic LVOT VTI, arterial waveform analysis (PiCCO, Vigileo, LiDCO), or oesophageal Doppler. The PLR without a CO measurement is useless.
Positive if CO/SV/VTI rises by 10 per cent or more
A rise of at least 10 per cent predicts responsiveness to a 500 mL bolus. Then give the bolus (250-500 mL balanced crystalloid) and reassess.
Return the patient to the semi-recumbent position
The effect is fully reversible within minutes. The manoeuvre is non-invasive, repeatable, and gives no fluid.
Advantages of PLR
Why it is the gold standard
- Reversible — no fluid given, so no risk of overload from the test itself
- Works in spontaneous breathing and in atrial fibrillation
- Highest sensitivity and specificity of any bedside method
- Requires only a real-time CO monitor (echo VTI is enough)
- Can be repeated as the patient evolves
Pitfalls of PLR
Where it fails
- Requires a real-time CO monitor — without it the test is uninterpretable
- Compression stockings or leg amputation blunt the venous transfer
- Raised intra-abdominal pressure reduces the volume transferred
- Spontaneous breathing during the manoeuvre in a deeply distressed patient adds noise
- Operator must start at 45 degrees semi-recumbent — the commonest error
End-expiratory occlusion test (EEOT)
In a mechanically ventilated patient, holding the ventilator at end-expiratory hold for 15 seconds removes the intrathoracic pressure swings of inspiration, transiently increasing venous return — a built-in reversible preload challenge. A rise in cardiac output or pulse pressure of 5 per cent or more during the occlusion predicts fluid responsiveness.[10]
Monnet's original study (Crit Care Med 2009) showed the EEOT reliably predicted volume responsiveness in ventilated ICU patients, and it is especially useful where PPV is unreliable (low tidal volume, arrhythmia, spontaneous triggering — provided the patient can tolerate the 15-second hold).[10]
Echocardiography — LVOT VTI
The left ventricular outflow tract velocity-time integral (LVOT VTI) measured by transthoracic echo is a surrogate for stroke volume (SV = LVOT area × VTI). Measuring VTI before and after a PLR (or a mini-fluid bolus) gives a percentage change that predicts responsiveness: a VTI rise above 10 to 15 per cent is positive.[1] The advantage is that it requires no specialised monitor — any clinician competent in critical-care echo can perform it.
Inferior vena cava (IVC) variability
The IVC diameter varies with respiration. The direction of variation depends on the breathing pattern:[9]
- Spontaneous breathing — IVC collapsibility index. During inspiration, the negative intrathoracic pressure draws blood into the thorax and the IVC collapses. A collapse above 40 to 50 per cent suggests low right-sided filling pressures and probable responsiveness. The original description is Feissel's seminal 2004 paper.[9]
- Mechanical ventilation — IVC distensibility index. During inspiration, positive pressure distends the IVC. A distensibility above 18 per cent predicts responsiveness.[1]
Orso's systematic review and meta-analysis (J Intensive Care Med 2020) of over 1000 patients found that IVC-based indices have modest diagnostic accuracy — useful in some settings but inferior to the PLR, and unreliable in the spontaneously breathing patient, after abdominal surgery, and with high intra-abdominal pressure or high PEEP.[9]
The fluid challenge technique
A fluid challenge is the definitive test: give a small bolus and measure whether cardiac output rises. The FENICE study (Fluid Challenges in Intensive Care, Cecconi et al., Intensive Care Med 2015) was a global inception cohort of over 2000 fluid challenges in 311 centres across 46 countries. It documented widespread heterogeneity in how fluid challenges are performed — and revealed that clinicians often fail to define what they mean by a "response" before giving the fluid.[8]
How to perform a proper fluid challenge
Decide the target BEFORE giving the fluid
Define what a response will look like (a rise in CO/SV/VTI of at least 10 per cent, or a fall in lactate / rise in MAP) before the bolus starts. FENICE showed clinicians rarely do this.
Give 250-500 mL of balanced crystalloid over 5-10 minutes
250 mL is the minimum that reliably tests preload; 500 mL is the standard bolus. Balanced crystalloid (Hartmann / Plasma-Lyte) preferred over 0.9% saline. A bolus is a *test*, not a resuscitation target.
Measure the response in real time (CO, SV, VTI, MAP)
Use echo VTI, arterial waveform analysis, or transpulmonary thermodilution. The pulse pressure or MAP alone is a weak surrogate — measure flow, not pressure.
Classify: responsive or non-responsive
Responsive = CO/SV/VTI rose by at least 10 per cent. Give further boluses ONLY while the patient keeps responding. Non-responsive = output did not rise: STOP fluids, start a vasopressor.
Re-test before every subsequent bolus
A patient who was responsive at hour 1 may be non-responsive at hour 3. Each bolus deserves its own test (PLR or challenge). Never run maintenance fluid blindly into a non-responsive patient.
FENICE
Intensive Care Med 2015
Global inception cohort — 2213 fluid challenges in 46 countries
Key finding
Enormous heterogeneity in fluid type, volume, rate and method of assessing response; only a minority of clinicians defined a target before the challenge; crystalloid was most common; 500 mL the median bolus.
Practice change
Standardised the language of the fluid challenge; called for defined endpoints and real-time CO monitoring
When to STOP giving fluids — fluid overload harms
The complement of "give fluid only if responsive" is stop giving fluid when the patient is no longer responsive. Three landmark trials establish that a liberal fluid strategy worsens outcome, especially in sepsis and ARDS.[5][6][7]
The four phases of fluid therapy in critical illness (click each) — Vincent's ROSE model
Stabilisation
Shock resolved, no ongoing losses. Aim for a zero or negative fluid balance; avoid maintenance fluid excess. This is the phase where most fluid is GIVEN UNNECESSARILY.
The key concept: fluid is a drug with a narrow therapeutic window. Too little and the patient remains in shock; too much and oedema (pulmonary, tissue, intra-abdominal) and a cytokine-laden interstitium prolong ventilation, cause AKI, and increase mortality. The "fluid staircase" of the ROSE model (Resuscitation, Optimisation, Stabilisation, Evacuation) frames when to give fluid and when to remove it.[1][5]
Evidence and guidelines
CLASSIC
NEJM 2022
Multicentre RCT — 1554 ICU patients with septic shock; restrictive vs liberal IV fluid
Key finding
Restrictive strategy (median 1.2 L after randomisation vs 3.0 L) was safe; no increase in death, kidney failure or ischaemic events. Less fluid did not harm — and trended toward less harm.
Practice change
Supports a restrictive fluid strategy after initial resuscitation in septic shock
FACTT
NEJM 2006
Multicentre RCT (ARDSNet) — 1000 ALI/ARDS patients; conservative vs liberal fluid for 7 days
Key finding
Conservative fluid strategy (lower cumulative fluid, lower CVP/PAOP targets) gave MORE ventilator-free days and LESS ICU days, with no increase in shock or renal failure.
Practice change
Conservative fluid management is the standard in ALI/ARDS
CLOVERS
NEJM 2023
Multicentre RCT (PETAL) — 1563 sepsis-induced hypotension; early restrictive vs liberal fluid before vasopressors
Key finding
A restrictive strategy (earlier vasopressors, less fluid) was non-inferior to a liberal strategy for 90-day mortality. No excess harm; supports permissive minimal early fluids.
Practice change
Earlier vasopressors and less fluid is an acceptable early sepsis strategy
Monnet & Teboul (PLR meta-analysis)
Intensive Care Med 2016
Systematic review & meta-analysis — 21 studies of PLR
Key finding
PLR-induced change in cardiac output is the most accurate bedside predictor of fluid responsiveness; works in spontaneous breathing and arrhythmia; requires real-time CO monitoring.
Practice change
Confirmed PLR as the gold-standard dynamic test
FENICE
Intensive Care Med 2015
Global inception cohort — 2213 fluid challenges, 46 countries
Key finding
Heterogeneous practice; clinicians rarely define the response target before giving fluid; median bolus 500 mL crystalloid.
Practice change
Standardised the language of the fluid challenge
Marik (CVP)
Chest 2008
Systematic review — 24 studies of CVP vs fluid responsiveness
Key finding
Flat CVP–response curve; CVP has no predictive value (area under ROC 0.55).
Practice change
CVP should not guide fluid therapy
Complications of fluid overload
Giving fluid to a non-responsive patient (or beyond the point of responsiveness) is not neutral — it causes harm:[5][6][7]
- Pulmonary oedema and worse oxygenation — the defining harm in ARDS; FACTT showed conservative fluid gave more ventilator-free days.
- Tissue oedema — gut, liver, skeletal muscle; impairs wound healing and mitochondrial function; raises intra-abdominal pressure.
- Acute kidney injury — a paradox: fluid-induced renal venous congestion and abdominal compartment syndrome cause AKI, the very organ resuscitation was meant to protect.
- Delayed recovery and longer ICU stay — cumulative positive fluid balance is independently associated with mortality.
- Haemodilution — falls in haematocrit and albumin; worsens oxygen delivery and oncotic pressure. [1]
Prognosis
Fluid-responsiveness-guided resuscitation gives less fluid, less pulmonary oedema, shorter ventilation, and equivalent or better survival than a liberal strategy — established by FACTT in ARDS and reinforced by CLASSIC and CLOVERS in sepsis. The prognosis of the underlying condition (sepsis, haemorrhage, cardiogenic shock) dominates; the contribution of the fluid strategy is to avoid iatrogenic harm from overload.[5][6][7]
Outcomes — the restrictive evidence base
Exam practice
SAQ — Assessing fluid responsiveness in septic shock
10 minutes · 10 marks
A 68-year-old man is admitted to the ICU with community-acquired pneumonia and septic shock. He has received 30 mL/kg of crystalloid in the emergency department. On examination: HR 112, BP 88/50 (MAP 63), warm peripheries, lactate 3.2 mmol/L, urine output 0.3 mL/kg/h. He is intubated and on volume-controlled ventilation, tidal volume 6 mL/kg predicted body weight, PEEP 10, SpO2 95% on FiO2 0.5. He is in sinus rhythm. A central line and arterial line are in place. Bedside echocardiography shows a hyperdynamic left ventricle with a small collapse of the IVC on inspiration.
SAQ — Fluid responsiveness in a spontaneously breathing patient in atrial fibrillation
10 minutes · 10 marks
A 74-year-old man is admitted to HDU with community-acquired pneumonia and septic shock. He is alert and breathing spontaneously on high-flow nasal cannula (60 L/min, FiO2 0.7). He is in fast atrial fibrillation (ventricular rate 115-130). HR 125, BP 84/52 (MAP 62), warm peripheries, lactate 2.9 mmol/L, urine output 0.3 mL/kg/h. A central line shows CVP 6 mmHg. Echocardiography demonstrates a hyperdynamic, small left ventricle; the IVC is 1.4 cm and collapses about 25 per cent with inspiration. The team proposes a 500 mL bolus and asks whether pulse pressure variation can guide it.
SAQ — Conservative versus liberal fluid strategy in septic shock with ARDS
10 minutes · 10 marks
A 62-year-old woman is on day 3 of ICU admission for severe community-acquired pneumonia complicated by septic shock and ARDS (P/F 180, bilateral infiltrates). She is intubated and ventilated (Vt 6 mL/kg PBW, PEEP 12, FiO2 0.6, SpO2 94 per cent). She has received 6.5 L of balanced crystalloid and is now on noradrenaline 0.3 mcg/kg/min to maintain MAP 65. Lactate has fallen from 4.2 to 1.6 mmol/L; urine output is 25 mL/h; cumulative fluid balance is +7 L. She has marked peripheral and sacral oedema. The registrar asks whether she should continue on maintenance fluids and further boluses.
Clinical pearls
Red flags
References
- [1]Monnet X, Marik PE, Teboul JL. Prediction of fluid responsiveness: an update Ann Intensive Care, 2016.PMID 27858374
- [2]Monnet X, Marik P, Teboul JL. Passive leg raising for predicting fluid responsiveness: a systematic review and meta-analysis Intensive Care Med, 2016.PMID 26825952
- [3]Marik PE, Baram M, Vahid B. Does central venous pressure predict fluid responsiveness? A systematic review of the literature and the tale of seven mares Chest, 2008.PMID 18628220
- [4]Marik PE, Cavallazzi R, Vasu T, Hirani A. Dynamic changes in arterial waveform derived variables and fluid responsiveness in mechanically ventilated patients: a systematic review of the literature Crit Care Med, 2009.PMID 19602972
- [5]Meyhoff TS, Hjortrup PB, Wetterslev J, et al. Restriction of Intravenous Fluid in ICU Patients with Septic Shock N Engl J Med, 2022.PMID 35709019
- [6]National Heart, Lung, and Blood Institute ARDS Clinical Trials Network; Wiedemann HP, Wheeler AP, et al. Comparison of two fluid-management strategies in acute lung injury N Engl J Med, 2006.PMID 16714767
- [7]National Heart, Lung, and Blood Institute PETAL Network; Shapiro NI, Douglas IS, et al. Early Restrictive or Liberal Fluid Management for Sepsis-Induced Hypotension N Engl J Med, 2023.PMID 36688507
- [8]Cecconi M, Hofer C, Teboul JL, et al. Fluid challenges in intensive care: the FENICE study: A global inception cohort study Intensive Care Med, 2015.PMID 26162676
- [9]Orso D, Paoli I, Piani T, et al. Accuracy of Ultrasonographic Measurements of Inferior Vena Cava to Determine Fluid Responsiveness: A Systematic Review and Meta-Analysis J Intensive Care Med, 2020.PMID 29343170
- [10]Monnet X, Osman D, Ridel C, et al. Predicting volume responsiveness by using the end-expiratory occlusion in mechanically ventilated intensive care unit patients Crit Care Med, 2009.PMID 19237902