ICU · Statistics & evidence
Statistics & Evidence — Trial Design, Interpretation, Appraisal and the Landmark ICU Trials
Also known as Statistics and evidence · Critical appraisal · Trial design · p-value · Confidence interval · Number needed to treat · Forest plot · GRADE · Landmark ICU trials
The statistics and the evidence for the ICU — the hierarchy of the study design (the case series, the case-control, the cohort, the RCT, the systematic review and the meta-analysis), the RCT design elements (the PICO, the randomisation, the allocation concealment, the blinding, the intention-to-treat), the bias and the confounding, the statistical inference (the null hypothesis, the type-I and the type-II error, the power, the p-value, the confidence interval), the effect sizes (the relative risk, the odds ratio, the absolute risk reduction, the number needed to treat, the hazard ratio), the meta-analysis (the forest plot, the heterogeneity, the I-squared), the critical appraisal (the GRADE), and the landmark ICU trials as the worked examples (the ARMA, the SOAP II, the VASST, the ProCESS and the ARISE, the ACURASYS and the ROSE, the Surviving Sepsis Campaign).
On this page & tools
Your progress
Saved locally on this device.
Target exams
Overview & definition
The statistics and the evidence is the CICM First Part and the Second Part content — the ability to design, to interpret and to critically appraise the clinical research that drives the ICU practice. The intensivist who understands the study design, the bias, the statistical inference and the effect sizes can read a trial and judge whether the result is real, whether it is important, and whether it applies to their patient.[9][10]
The framework rests on four pillars: the study design (the hierarchy, the RCT elements), the bias and the confounding, the statistical inference (the p-value, the confidence interval, the effect sizes), and the critical appraisal (the GRADE), illustrated by the landmark ICU trials.[9]
The hierarchy of the study design
The study designs, in the ascending order of the internal validity:[9]
- The case report and the case series — the descriptive, the hypothesis-generating; the no control group.
- The case-control study — the retrospective, the comparison of the cases (the diseased) and the controls (the not-diseased) for the prior exposure; the efficient for the rare disease, the prone to the recall and the selection bias.
- The cohort study — the prospective (or the retrospective) following of the exposed and the unexposed groups for the outcome; the efficient for the rare exposure, the temporal relationship, but the prone to the confounding and the loss to follow-up.
- The randomised controlled trial (the RCT) — the gold standard for the therapy; the randomisation balances the known and the unknown confounders; the experimental and the control groups.
- The systematic review and the meta-analysis — the highest level; the systematic identification and the synthesis of all the relevant RCTs, the pooled estimate.[9]
The RCT design elements
The well-designed RCT answers a focused clinical question (the PICO — the Population, the Intervention, the Comparator, the Outcome).[9][10]
- The randomisation — the chance allocation, balancing the confounders (the known and the unknown) across the groups. The block and the stratified randomisation for the balance.
- The allocation concealment — the hiding of the allocation from the investigator until the enrolment; the prevention of the selection bias (the no allocation concealment lets the investigator steer the patient to the favoured group). The central, the sealed-opaque-envelope methods.
- The blinding (the masking) — the single (the patient), the double (the patient and the investigator), the triple (the patient, the investigator, the outcome assessor). The prevention of the performance and the detection bias. The sham and the placebo for the credible blinding.
- The intention-to-treat (the ITT) analysis — the patient analysed in the group to which they were randomised, regardless of the treatment received; the preservation of the randomisation, the pragmatic real-world estimate. The per-protocol analysis (the only the completers) is the biased.[9]
The bias and the confounding
The bias is the systematic error; the confounding is the mixing of the effect of the third variable.[9]
- The selection bias — the systematic difference in the enrolment (the no allocation concealment, the loss to follow-up).
- The performance bias — the systematic difference in the care (the no blinding).
- The detection bias — the systematic difference in the outcome assessment (the no blinding).
- The attrition bias — the systematic difference in the withdrawals.
- The reporting bias — the selective reporting of the favourable outcomes (the publication bias, the outcome-reporting bias).
- The confounding — the third variable associated with both the exposure and the outcome (the age, the severity). The controlled by the randomisation (the RCT), the matching, the stratification, the multivariable adjustment.[9]
The statistical inference: the null hypothesis and the error
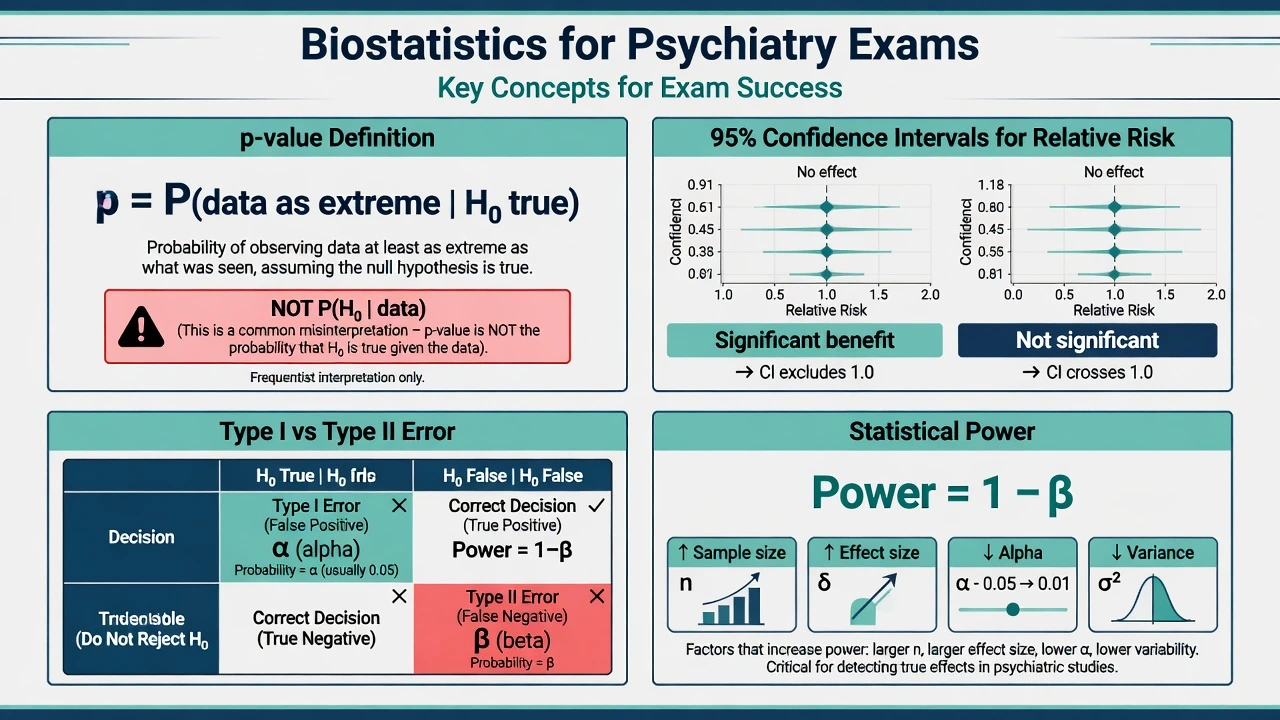
The statistical inference tests the null hypothesis (the no difference between the groups).[9][10]
- The type-I error (the alpha) — the false positive: the rejection of the true null (the conclusion of the difference when there is none). The alpha is the threshold (the conventional 0.05 — the 5 per cent chance of the false positive).
- The type-II error (the beta) — the false negative: the failure to reject the false null (the conclusion of the no difference when there is one). The beta is the conventional 0.2.
- The power (the 1 − beta) — the probability of detecting a true difference. The power of 80 per cent (the 1 − 0.2). The power is driven by the sample size — the underpowered trial fails to detect the real effect.
- The p-value — the probability of the observed (or more extreme) result if the null is true. The p below 0.05 is the conventional significance — but it does NOT measure the magnitude or the importance of the effect, nor the probability that the null is true.[9]
The confidence interval
The confidence interval (the CI) is the range of the plausible values for the true effect — the 95 per cent CI is the range that would contain the true effect 95 per cent of the time over the repeated samples. The CI conveys the precision (the narrow CI = the precise, the wide CI = the imprecise — the small sample) AND the significance (the CI crossing the line of no effect — the 1 for the RR/OR/HR, the 0 for the difference — is the not significant).[9][10]
The CI is preferred over the p-value for it conveys the magnitude, the direction and the precision.[9]
The effect sizes
The effect size quantifies the magnitude of the effect.[9]
- The relative risk (the RR) — the risk in the exposed divided by the risk in the unexposed (the RR of 0.7 = the 30 per cent reduction).
- The odds ratio (the OR) — the odds in the exposed divided by the odds in the unexposed; the approximate of the RR for the rare outcome; the used in the case-control and the logistic regression.
- The absolute risk reduction (the ARR) — the control event rate minus the experimental event rate (the absolute difference). The clinically meaningful.
- The relative risk reduction (the RRR) — the ARR divided by the control event rate (the proportional reduction — the often-inflated, the less-clinically-meaningful).
- The number needed to treat (the NNT) — the 1 / ARR — the number of patients to treat to prevent one event. The clinically intuitive. The number needed to harm (the NNH) for the adverse outcome.
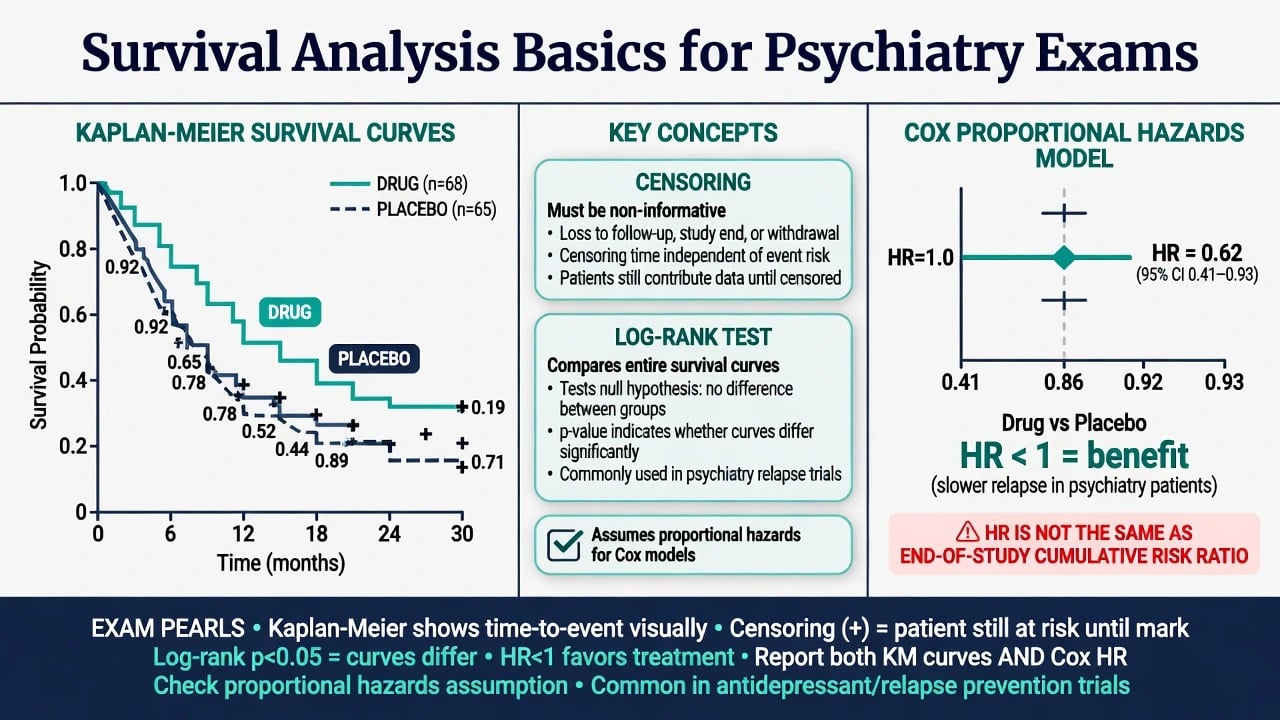
- The hazard ratio (the HR) — the relative risk over the time (the survival analysis); the instantaneous risk in the one group vs the other.
- The mean difference — the continuous outcome (the e.g. the ventilator-free days).[9][10]
The meta-analysis
The meta-analysis pools the results of the multiple RCTs for the single, the more-precise estimate.[9]
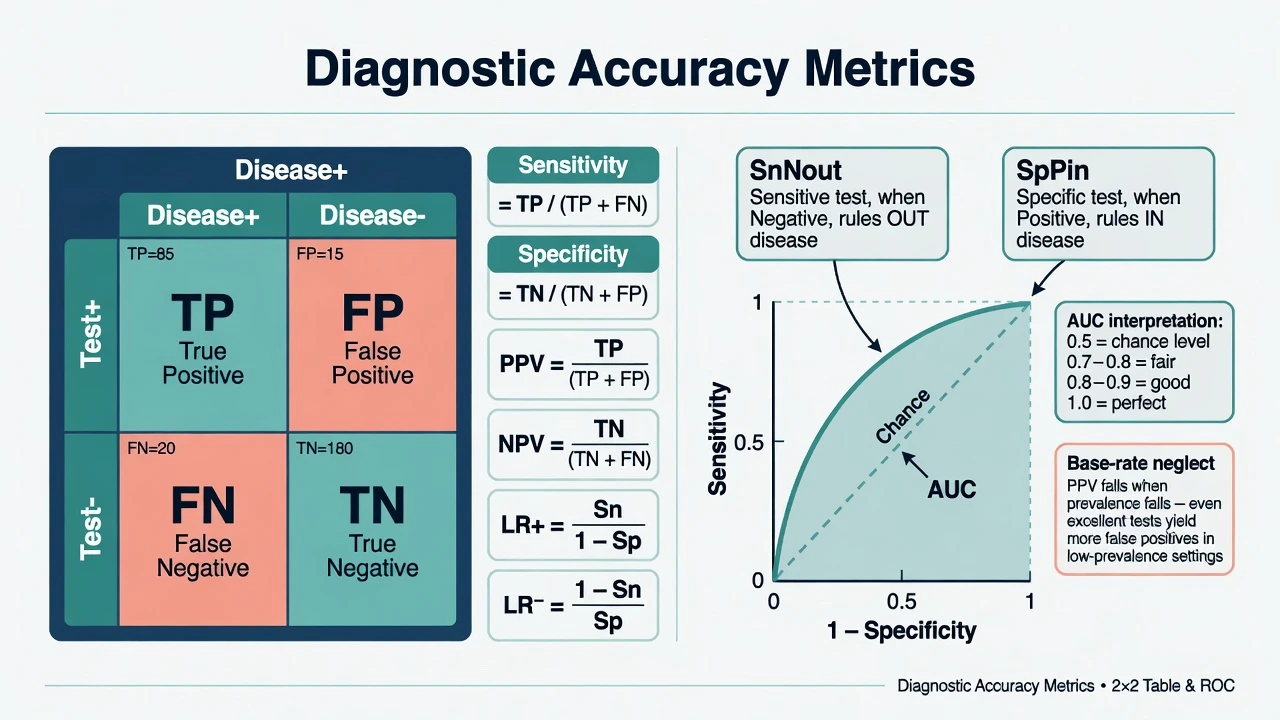
- The forest plot — the graphical display: each study a square (the size = the weight) with the horizontal line (the CI), the pooled estimate a diamond at the bottom; the vertical line of the no effect.
- The heterogeneity (the I-squared) — the variation between the studies beyond the chance. The I-squared of 0 to 40 per cent (the low), 30 to 60 (the moderate), 50 to 90 (the substantial), 75 to 100 (the considerable). The high heterogeneity questions the pooling.
- The fixed vs the random effects — the fixed (the one true effect assumed), the random (the distribution of the effects assumed — the more appropriate for the heterogeneous studies).[9]
The critical appraisal and the GRADE
The critical appraisal is the structured assessment of the validity, the importance and the applicability of the evidence.[9]
The GRADE (the Grading of Recommendations, Assessment, Development and Evaluation) framework rates the certainty of the evidence (the high, the moderate, the low, the very low) and the strength of the recommendation (the strong, the weak/conditional). The downgraded for the risk of bias, the inconsistency, the indirectness, the imprecision, the publication bias. The upgraded for the large effect, the dose-response, the plausible confounding.[9]
The landmark ICU trials (the worked examples)
The landmark trials illustrate the principles.[1][8]
- The ARMA trial (the ARDSNet, NEJM 2000) — the RCT of the low tidal volume (6 mL/kg) vs the traditional (12 mL/kg) in the ARDS; the 22 per cent relative mortality reduction; the practice-defining; the well-conducted, the large, the clear outcome.[1]
- The SOAP II trial (De Backer, NEJM 2010) — the RCT of the dopamine vs the norepinephrine in the shock; the no mortality difference, but the more arrhythmia with the dopamine; the established the norepinephrine as the first-line.[2]
- The VASST trial (Russell, NEJM 2008) — the RCT of the vasopressin vs the norepinephrine in the septic shock; the no overall mortality difference, but the subgroup (the less-severe shock) suggested the benefit; the catecholamine-sparing role.[3]
- The ProCESS and the ARISE trials (NEJM 2014) — the RCTs of the early goal-directed therapy (the EGDT) vs the usual care in the septic shock; the no mortality difference — the EGDT (the Rivers) was the no-superior. The lesson: the protocolised, the early, the adequate care is the key, not the specific CVP/ScvO2 targets.[6][7]
- The ACURASYS and the ROSE trials (NEJM 2010, 2019) — the ACURASYS showed the mortality benefit of the 48-hour cisatracurium in the severe ARDS; the ROSE (the larger, the more-methodologically-rigorous, the routine deep sedation in both arms) showed the no benefit. The lesson: the early, the well-conducted trial overturned the later; the routine NMBA is the not recommended.[4][5]
- The Surviving Sepsis Campaign 2021 (Evans, ICM 2021) — the evidence-based guideline (the GRADE); the bundle of the early antibiotics, the source control, the fluid, the vasopressor, the lactate.[8]
The common pitfalls
The critical reader recognises the pitfalls.[9]
- The surrogate endpoint — the intermediate marker (the CVP, the ScvO2, the cardiac output) substituted for the patient-centred outcome (the mortality, the quality of life); the surrogate may not reflect the benefit (the EGDT improved the CVP/ScvO2 but the not the mortality — the ProCESS/ARISE).[6][7]
- The subgroup analysis — the post-hoc splitting of the data (the VASST less-severe-shock subgroup); the multiple-testing inflation of the false positive; the hypothesis-generating only, the confirmatory trial required.[3]
- The underpowered trial — the small sample, the wide CI, the failure to detect the real effect (the type-II error). The "no difference found" is the not "the no difference exists".
- The external validity (the generalisability) — the trial population (the selected, the strict inclusion) may the not represent the real-world patient. The efficacy (the trial) vs the effectiveness (the real world).
- The conflict of interest and the funding bias — the industry-funded trials more likely to favour the sponsor.[9]
Prognosis
The statistics and the evidence literacy is the foundation of the evidence-based ICU. The intensivist who appraises the trial (the design, the bias, the effect size, the applicability) applies the real benefit and the avoids the harm. The landmark trials (the ARMA, the SOAP II, the ProCESS/ARISE, the ACURASYS/ROSE) shaped the modern ICU — and the understanding of why they did (and why some were overturned) is the mark of the expert.[1][8][9]
SAQ — Critical appraisal of a landmark ICU trial (ROSE overturning ACURASYS)
10 minutes · 10 marks
A journal club discusses the ROSE trial (NEJM 2019), which found no mortality benefit from routine 48-hour cisatracurium infusion in severe ARDS, contradicting the earlier ACURASYS trial (NEJM 2010) that had reported a 90-day mortality reduction. You are asked to critically appraise the ROSE trial using PICO, assess the sources of bias, and explain why the two trials reached different conclusions.
SAQ — Meta-analysis interpretation: forest plots, heterogeneity, and the VASST subgroup
10 minutes · 10 marks
You are shown a Cochrane meta-analysis of vasopressin versus norepinephrine in septic shock. The pooled estimate favours vasopressin but the I-squared is 65%, the confidence interval is wide, and one large trial (VASST) reports a survival benefit only in a pre-specified 'less-severe shock' subgroup. The candidate is asked to interpret the meta-analysis, judge the credibility of the subgroup, and decide whether the result should change practice.
Red flags
The study designs — the detailed comparison
The exam answer requires the candidate to place each design in its correct rung of the hierarchy AND to state when each is the appropriate choice. The case series is hypothesis-generating; the case-control is the choice for the rare disease; the cohort is the choice for the rare exposure and for the question of causation; the RCT is the gold standard for the therapy; the systematic review and the meta-analysis is the highest level for the synthesis.[9][18]
Case report / case series
Lowest rung — descriptive
- Direction: descriptive, no control group
- Best for: novel presentations, rare complications, hypothesis generation (e.g. first description of VATS-confirmed VAP pattern)
- Cannot: estimate incidence, prevalence or causal effect
- Key weakness: extreme selection bias — the published case is the unusual one
Cross-sectional study
Snapshot — prevalence
- Direction: neither — exposure and outcome measured at ONE timepoint
- Best for: prevalence (point, period, lifetime), screening-test properties, health-service audit
- Yields: prevalence ratio (not risk — no follow-up)
- Key weakness: cannot establish temporality — chicken-and-egg between exposure and outcome
- ICU example: point-prevalence of ICU-acquired weakness (the international ICON studies)
Case-control study
Retrospective — rare disease
- Direction: retrospective — start with cases (diseased) and controls, look back at exposure
- Best for: rare diseases, diseases with long latency (e.g. ICU survivorship outcomes years after discharge)
- Yields: odds ratio (OR) — the only valid effect size
- Key weakness: recall bias, control-selection bias, susceptible to confounding
Cohort study
Prospective — rare exposure
- Direction: prospective (or retrospective) — start with exposed and unexposed, follow forward
- Best for: rare exposures, establishing temporality / causation, multiple outcomes from one exposure
- Yields: relative risk (RR), risk difference, hazard ratio
- Key weakness: confounding (no randomisation), loss to follow-up, healthy-worker effect
- ICU example: LUNG SAFE (JAMA 2016) — prospective cohort of ARDS across 50 countries
Before-after (interrupted time series)
Quasi-experimental
- Direction: before vs after an intervention, with the patient as their own control
- Best for: evaluating a unit-wide or hospital-wide intervention (e.g. a sepsis bundle rollout)
- Strength: controls for between-patient differences
- Key weakness: regression to the mean, secular trends, history (a concurrent change explains the result)
- Improved by: an interrupted time series with multiple pre- and post-measurements and a control group
Randomised controlled trial
Gold standard — therapy
- Direction: experimental — random allocation to intervention vs control
- Best for: therapy, harm (when the exposure is iatrogenic), efficacy
- Yields: all effect sizes (RR, OR, ARR, NNT, HR, mean difference)
- Strength: randomisation balances known AND unknown confounders
- Key weakness: external validity (highly selected populations), cost, ethical constraints
Systematic review / meta-analysis
Highest rung — synthesis
- Direction: synthesis — systematic identification and pooled analysis of all relevant studies
- Best for: resolving uncertainty when several trials exist, increasing precision, generating hypotheses for subgroups
- Yields: a pooled estimate with a tighter confidence interval than any single trial
- Key strength: reduces random error and small-study effects; the GRADE framework grades the body of evidence
- Key weakness: garbage-in-garbage-out — a meta-analysis of poor trials is a precise wrong answer
The cross-sectional and the before-after designs — the worked detail
The cross-sectional study is the snapshot — the exposure and the outcome are measured at the same single timepoint, with no follow-up. It answers the questions of the prevalence (the point, the period, the lifetime) and the association, but it CANNOT establish the temporality (the cause and the effect). The classic ICU example is the point-prevalence survey (the prevalence of the ICU-acquired infections, the ventilator-associated events, the ICU-acquired weakness — the ICON and the EU-VAP/CAP studies).[9]
The before-after study (the quasi-experimental) compares the outcome before and after an intervention, with the patient (or the unit) as their own control. It is the practical design for the unit-wide or the hospital-wide change (the sepsis-bundle rollout, the introduction of a checklist). The before-after is the SUSCEPTIBLE to the regression to the mean (the extreme values tend to the average), the secular trend (the natural improvement over time), and the history (the concurrent change). The strengthened by the interrupted time series (the multiple measurements before and after) and the control group (the difference-in-differences).[9]
The RCT design elements — the worked detail
The RCT answers the PICO question (the Population, the Intervention, the Comparator, the Outcome).[9][21]
P — Population
Who is in the trial
- Inclusion criteria define the population (e.g. septic shock within 6 h of presentation, MAP <65 on 1 L crystalloid)
- Exclusion criteria determine external validity — strict exclusions = a trial that does NOT represent real-world ICU patients
- The recruiting-window problem (ARDS) — only patients who still meet criteria after a run-in are randomised
I — Intervention
What is being tested
- Must be precisely defined (drug, dose, route, timing, duration, titration target)
- The cointervention problem — both arms must receive identical background care (the ROSE trial: deep sedation in both arms confounded the NMBA effect)
C — Comparator
What it is tested against
- Standard care, placebo, sham, or active comparator
- Choice of comparator determines the question: EGDT vs usual care (ProCESS/ARISE) is a different question from EGDT vs a different protocol
O — Outcome
What is measured
- Primary outcome must be patient-centred (mortality, quality of life) — NOT a surrogate (CVP, ScvO2, cardiac output)
- Composite outcomes (e.g. death OR renal failure) inflate the event rate but mask which component is driving the result
- Patient-centred vs surrogate is the single most important judgement on the outcome
The effect sizes — the formulas and the worked example
The effect size quantifies the magnitude. The candidate must know the formula, the line of no effect and the worked example.[9][10]
The worked example — a hypothetical RCT of early vs late antibiotics in septic shock:[6]
- The early-antibiotic group: 40 deaths in 1000 patients (CER experimental = 0.04).
- The late-antibiotic group: 80 deaths in 1000 patients (CER control = 0.08).
- The RR = 0.04 / 0.08 = 0.50 (the 50 per cent relative reduction).
- The OR = (40/960) / (80/920) = 0.042 / 0.087 = 0.48.
- The ARR = 0.08 − 0.04 = 0.04 (the 4 per cent absolute reduction).
- The RRR = 0.04 / 0.08 = 0.50 (the 50 per cent — same as the 1 − RR).
- The NNT = 1 / 0.04 = 25 (treat 25 patients early to prevent one death).
- The 95 per cent CI for the ARR of 0.04 (rough): 0.01 to 0.07 — the NNT 25 (the 1/0.07 = 14 to the 1/0.01 = 100).[4]
Relative risk (RR)
Risk ratio
- Formula: risk(exposed) / risk(unexposed)
- Line of no effect: 1.0
- RR <1 = protective; RR >1 = harmful
- Used in: cohort studies, RCTs
- Cannot be used in: case-control studies (no true risk)
Odds ratio (OR)
Odds ratio
- Formula: odds(exposed) / odds(unexposed) = (a/b)/(c/d) = ad/bc
- Line of no effect: 1.0
- Approximates RR when outcome is rare (<10%)
- Used in: case-control studies, logistic regression
- Overestimates RR when outcome is common (ICU mortality is NOT rare — use RR or HR)
Absolute risk reduction (ARR)
Risk difference
- Formula: control event rate − experimental event rate
- Line of no effect: 0
- Clinically meaningful — the ACTUAL difference in events
- Inverse of NNT
Relative risk reduction (RRR)
Proportional reduction
- Formula: ARR / control event rate = 1 − RR
- Often inflated — looks impressive for rare events
- Same RRR for a 2 → 1% and a 20 → 10% mortality — the ARR (1% vs 10%) tells the real story
Number needed to treat (NNT)
1 / ARR
- Formula: 1 / ARR (expressed as a decimal)
- NNT = 25 means treat 25 to prevent one event
- Always report with a confidence interval (from the CI bounds of the ARR)
- NNH (number needed to harm) — the same formula for an adverse outcome
Hazard ratio (HR)
Time-to-event
- Formula: instantaneous hazard(treatment) / instantaneous hazard(control) — from the Cox proportional hazards model
- Line of no effect: 1.0
- Assumes proportional hazards (the HR is constant over time) — check the survival curves do not cross
- Used in: survival analysis, time-to-event outcomes (ventilator-free days, ICU-free days, 90-day mortality)
The number needed to treat — the worked interpretation
The NNT is the clinically-intuitive effect size — the number of patients who must be treated to prevent one event. The exam answer must state the NNT with its CI (the CI is asymmetric and derived from the CI of the ARR).[9][10]
The clinical interpretation of the NNT:[2]
- The NNT of 25 (the early-antibiotic example) — treat 25 patients to prevent one death.
- The NNT must be weighed against the NNH (the number needed to harm from the adverse effect) and the cost (the drug, the monitoring, the ICU bed).
- The baseline risk matters — the same RR (0.5) gives a NNT of 25 at a baseline mortality of 8 per cent but a NNT of 5 at a baseline of 40 per cent. The high-risk subgroup benefits more from the same relative effect.
- The NNT can be calculated for harm — the NNH for the dopamine arrhythmias in SOAP II (the NNH ~ 10 for the arrhythmia, the NNT for mortality = ∞ as the no-mortality-difference).[2]
The sample size and the power
The sample size is calculated BEFORE the trial starts (the a-priori power calculation). The four determinants:[9][10]
- The alpha (the type-I error rate, the conventional 0.05) — the threshold for the false positive.
- The power (the 1 − beta) (the conventional 0.80 or 0.90) — the probability of detecting a true difference.
- The effect size — the minimum clinically important difference the trial is designed to detect (the smaller the difference, the larger the sample).
- The variability (the standard deviation for the continuous outcome, the event rate for the binary outcome) — the more variable, the larger the sample.[15]
The worked logic: to detect a mortality reduction from 40 per cent to 30 per cent (the 10 per cent absolute reduction) with the alpha of 0.05 and the power of 0.80, the trial needs ~700 patients per arm. To detect a reduction from 40 per cent to 35 per cent (the 5 per cent absolute reduction), the trial needs ~2800 patients per arm. The halving of the effect quadruples the sample. This is why the underpowered ICU trials (the small, the single-centre) so often report the "no significant difference" — they were never going to detect a clinically-relevant effect.[12]
The pitfalls of the sample-size calculation:[9]
- The over-optimistic effect size — the trial is powered for a 30 per cent mortality reduction that no real intervention achieves; the trial "fails to meet its primary endpoint" but was underpowered for the realistic 5 per cent reduction.
- The surrogate primary endpoint — the trial is powered for the change in the biomarker (the small sample is sufficient) but underpowered for the patient-centred mortality.
- The interim analysis — the multiple looks at the data inflate the type-I error (the alpha-spending functions, the O'Brien-Fleming boundaries preserve the overall alpha).[20]
The bias — the detailed taxonomy
The bias is the systematic error. The Cochrane Collaboration classifies the bias into the five domains.[9]
Selection bias
Systematic difference in enrolment
- Mechanism: investigator steers patient to favoured arm; differential loss to follow-up
- Prevented by: ALLOCATION CONCEALMENT (central phone/web randomisation, sealed opaque sequentially-numbered envelopes)
- Distinct from randomisation: randomisation is the assignment; concealment is the hiding of the next assignment until enrolment
Performance bias
Systematic difference in care
- Mechanism: investigators provide different care to the arms (more attention, more cointervention) when unblinded
- Prevented by: BLINDING of participants and personnel; standardised care protocols; sham procedures
- Hard to achieve in ICU: deep sedation cannot be blinded; ECMO, RRT, prone positioning cannot be sham
Detection bias
Systematic difference in outcome assessment
- Mechanism: unblinded outcome assessor over- or under-codes the outcome
- Prevented by: BLINDED outcome adjudication; objective outcomes (mortality) more robust than subjective (radiographic ARDS)
- ICU example: blinded adjudication of ventilator-associated pneumonia in the ARMA and the ROSE trials
Attrition bias
Systematic difference in withdrawals
- Mechanism: differential dropout; loss to follow-up
- Prevented by: intention-to-treat (ITT) analysis — analyse every patient in the arm they were randomised to; minimise loss to follow-up
- High loss (>20%) threatens validity; the worst-case scenario analysis tests robustness
Reporting bias
Selective outcome reporting
- Mechanism: only favourable outcomes published (the published protocol vs the published paper mismatch)
- Prevented by: trial REGISTRATION (clinicaltrials.gov, ANZCTR); protocol publication; CONSORT reporting
- Includes publication bias — the published trial is more likely to be positive
Confounding
Third variable
- Mechanism: a variable associated with both exposure and outcome distorts the apparent effect
- Controlled by: randomisation (the RCT), matching, stratification, multivariable regression, propensity-score methods, instrumental variables
- Residual confounding is the irreducible weakness of observational studies
The meta-analysis — the forest plot, the heterogeneity and the funnel plot
The meta-analysis pools the results of the multiple studies for the single, the more-precise estimate. The exam answer must explain the forest plot, the heterogeneity and the funnel plot.[9][15][16][22]
The forest plot is the graphical display:[15]
- Each study is a SQUARE (the size = the weight in the pooled estimate — the inverse-variance weight).
- Each study has a HORIZONTAL LINE (the 95 per cent CI).
- The VERTICAL LINE is the line of no effect (the 1 for the RR/OR/HR, the 0 for the difference).
- The DIAMOND at the bottom is the pooled estimate (the centre = the point estimate, the width = the CI).
- If the diamond does NOT cross the line of no effect, the pooled result is statistically significant.[15]
The heterogeneity (the I-squared) is the variation between the studies beyond the chance. The I-squared (Higgins 2003) is the proportion of the total variation that is due to the between-study heterogeneity rather than the within-study sampling error.[16]
- The I-squared of 0 to 40 per cent (the low — the pooling is reasonable).
- The I-squared of 30 to 60 per cent (the moderate).
- The I-squared of 50 to 90 per cent (the substantial — the pooling is questionable).
- The I-squared of 75 to 100 per cent (the considerable — the pooling is inappropriate; explore the source — the subgroup analysis, the sensitivity analysis).
- The Cochran Q (the chi-square test of the homogeneity) — the p <0.10 suggests the heterogeneity (the low power of the test in the small number of studies).[15]
The fixed vs the random effects:[15]
- The fixed-effect model assumes the one true effect is shared by all the studies; the weighting is by the inverse of the within-study variance; appropriate when the studies are homogeneous.
- The random-effects model (the DerSimonian-Laird) assumes a distribution of the effects across the studies; the weighting includes the between-study variance (tau-squared); appropriate when the heterogeneity is present; the CI is wider; the estimate is more conservative.[22]
- The default choice for the ICU meta-analysis is the random-effects (the heterogeneity is the rule, not the exception, in the critical-care trials).
The funnel plot is the scatter plot of the effect size (x-axis) against the precision (the standard error or the sample size) (y-axis). The symmetric inverted-funnel shape is expected; the asymmetry suggests the publication bias (the small, the negative, the unfunded trials are not published).[15]
- The Egger test is the formal statistical test of the funnel-plot asymmetry (the regression of the standard normal deviate against the precision; the intercept significantly different from the zero indicates the asymmetry).[15]
- The trim-and-fill is the method of imputing the missing studies to estimate the unbiased pooled effect.
- The funnel-plot asymmetry is NOT synonymous with the publication bias — the other causes (the true heterogeneity, the poor methodology of the small studies, the chance) must be considered.
The critical appraisal — the CASP and the GRADE
The critical appraisal is the structured assessment of the validity, the importance and the applicability of the evidence.[9]
The CASP (the Critical Appraisal Skills Programme) is the checklist-based approach, with the separate checklists for the RCT, the systematic review, the cohort, the case-control and the qualitative study. The 11-question RCT checklist covers the validity (the randomisation, the blinding, the similarity of the groups, the ITT), the importance (the effect size, the CI, the clinical significance) and the applicability (the local population, the benefits/harms/costs).[9]
The GRADE (the Grading of Recommendations, Assessment, Development and Evaluation) is the most widely-adopted framework for the certainty of the evidence and the strength of the recommendation.[11][23]
High
We are very confident
- Definition: further research is VERY UNLIKELY to change our confidence in the estimate of effect
- Starting point: randomised trials (begin at HIGH)
- The body of evidence from several high-quality RCTs (e.g. low-tidal-volume ventilation in ARDS) is rated HIGH
Moderate
We are moderately confident
- Definition: further research is LIKELY to have an important impact on our confidence and may change the estimate
- Typically: RCTs downgraded by ONE level for a serious limitation (e.g. risk of bias, inconsistency)
- Many Surviving Sepsis Campaign recommendations sit at MODERATE
Low
Confidence is limited
- Definition: further research is VERY LIKELY to have an important impact and likely to change the estimate
- Typically: RCTs downgraded by TWO levels, or observational studies with no upgrading
- Example: vasopressin as first-line vasopressor (the VASST subgroup signal, the VANISH mixed results)
Very low
Any estimate is very uncertain
- Definition: the estimate is VERY UNCERTAIN
- Typically: observational studies downgraded for serious limitations, or small underpowered trials
- Many classical ICU interventions (e.g. stress-ulcer prophylaxis in low-risk patients) rest on VERY LOW certainty
The GRADE domains — the downgrade:[11]
- The risk of bias — the serious risk across the body of the evidence downgrades by one level; the very serious by two.
- The inconsistency — the unexplained heterogeneity of the results across the studies.
- The indirectness — the population, the intervention, the comparator or the outcome of the evidence differs from the question (the surrogate outcomes, the animal studies).
- The imprecision — the wide CI (the optimal information size not reached).
- The publication bias — the strong suspicion of the unpublished negative studies (the funnel-plot asymmetry).[9]
The GRADE domains — the upgrade (the observational studies only):[18]
- The large effect — the RR >2 or <0.5 with no plausible confounders.
- The dose-response gradient — the effect increases with the dose or the duration.
- The plausible confounding that would reduce the observed effect — the confounder that, if controlled, would make the effect LARGER (e.g. the sicker patients received the intervention and still did better).[11]
The strength of the recommendation (the strong vs the weak/conditional):[11]
- The STRONG — the desirable consequences clearly outweigh the undesirable (the "we recommend"). The patient-clinician discussion in the typical setting is straightforward; the clinicians can present the intervention as the standard of care.
- The WEAK / CONDITIONAL — the balance is more uncertain (the "we suggest"). The patient's values and preferences should drive the decision; the alternative is reasonable.
- The strength is determined by the certainty of the evidence, the balance of the benefits and harms, the values and preferences, and the resources.[23]
The reporting guidelines — the CONSORT, the PRISMA, the STROBE, the TRIPOD
The reporting guidelines standardise the reporting of the research — the higher-quality reporting reduces the bias and improves the critical appraisal.[12][13][14][18][19]
CONSORT 2010
RCT reporting
- Schulz, Altman, Moher (BMJ 2010) — the 25-item checklist for the parallel-group RCT
- Key items: registration, sample-size calculation, randomisation sequence, allocation concealment, blinding, ITT, the flow diagram (enrolled → randomised → analysed)
- The 2010 update added the registration and the protocol; the CONSORT extensions cover cluster, pragmatic, non-inferiority and N-of-1 trials
PRISMA 2009 / 2020
Systematic review reporting
- Moher 2009 (PLoS Med); Page 2021 (BMJ) — the 27-item checklist for the systematic review and the meta-analysis
- Key items: the search strategy (the databases, the dates, the search terms), the PRISMA flow diagram (identification → screening → eligibility → included), the risk-of-bias assessment (the RoB 2), the publication-bias assessment
- The 2020 update added the registration, the protocol, the data-sharing, the RoB 2
STROBE
Observational study reporting
- von Elm 2007 (Ann Intern Med) — the 22-item checklist for the cohort, the case-control and the cross-sectional study
- Key items: the study design, the setting, the participants, the variables, the data sources, the statistical methods, the confounders, the generalisability
TRIPOD
Prediction-model reporting
- Collins 2015 (Ann Intern Med) — the 22-item checklist for the multivariable prediction model
- Key items: the development vs the validation, the missing data, the model performance (calibration, discrimination, the C-statistic), the clinical usefulness
- Relevant to ICU scoring systems (APACHE, SOFA, SAPS) — TRIPOD ensures the model is transparent and usable
The ICU-specific evidence interpretation
The ICU trials have the particular features that shape the interpretation.[1][8][20]
The subgroup analysis is the post-hoc splitting of the trial data. The VASST suggested the vasopressin benefit only in the less-severe-shock subgroup; the ACURASYS suggested the NMBA benefit only in the PaO2/FiO2 <150 subgroup. The post-hoc subgroup inflates the false-positive rate by the multiple testing (the 20 subgroups → the 1 expected by the chance alone).[3][4][20]
The credibility of the subgroup effect (Sun 2010, BMJ):[20]
- The subgroup specified a-priori (in the protocol) — more credible than the post-hoc.
- The subgroup hypothesis based on the prior biological rationale.
- The effect size of the subgroup interaction statistically significant (the p for interaction, not the p for the within-subgroup effect).
- The consistent direction across the related studies.
- The subgroup is one of the few tested (not the many splits).[20]
The VASST less-severe-shock subgroup fails the test (the post-hoc, the no significant interaction, the not replicated) — the practice does NOT change on the subgroup alone.[3]
The external validity (the generalisability) is the applicability of the trial to the real-world patient. The trial population is selected — the strict inclusion criteria (the age limits, the comorbidity exclusions, the recruited-window problem) exclude the sickest, the oldest and the most-comorbid patients who dominate the real ICU.[9]
- The efficacy (the trial) vs the effectiveness (the real world) — the trial demonstrates what the intervention can achieve in the ideal; the real-world question is what it achieves in the routine.
- The ARMA trial (the strict P/F <300 within the 36-hour window, the young, the few comorbidities) demonstrated the efficacy of the low-tidal-volume ventilation; the LUNG SAFE cohort showed the under-implementation in the real world.[1]
The pragmatic vs the explanatory trial (the PRECIS):[17]
Explanatory trial
Can it work? (efficacy)
- Question: can the intervention work under ideal conditions?
- Population: highly selected, strict inclusion/exclusion; recruited-window design
- Intervention: tightly protocolised, expert clinicians, mandatory adherence
- Comparator: placebo or sham; no cointervention allowed
- Outcome: surrogate or short-term; blinding maximal
- Example: ACURASYS — strict early ARDS, fixed cisatracurium regimen, deep sedation mandated
Pragmatic trial
Does it work? (effectiveness)
- Question: does the intervention work in routine practice?
- Population: broad inclusion (the real ICU patients); minimal exclusion
- Intervention: flexible, clinician-discretion; real-world delivery
- Comparator: usual care; cointerventions at clinician discretion
- Outcome: patient-centred (mortality, quality of life); often unblinded
- Example: ProCESS / ARISE — broad septic-shock population, EGDT vs usual care, 90-day mortality
The PRECIS-2 tool (Thorpe 2009, updated Loudon 2015) scores the trial across 9 domains (eligibility, recruitment, setting, organisation, flexibility of delivery, flexibility of adherence, follow-up, primary outcome, primary analysis) on a 1–5 scale (the 1 = very explanatory, the 5 = very pragmatic). The pragmatic trial is the design of choice for the policy question (does the bundle work in the real ICU); the explanatory trial is the design for the mechanistic question (does the drug work in the ideal).[17]
The critical appraisal — the step-by-step workflow
How to critically appraise an ICU RCT in 5 steps
Step 1 — Validity: was the trial properly designed?
Was the randomisation adequate (computer-generated sequence)? Was allocation concealed (central web/phone, sealed opaque envelope)? Was there blinding (patient, clinician, outcome assessor)? Was the ITT analysis used (every patient analysed in the arm to which they were randomised)? Are the groups similar at baseline? If any of these is "no", the trial is at high risk of bias and the result may be unreliable.
Step 2 — Importance: what is the effect size?
What is the ARR (the absolute difference)? What is the NNT? Is the 95% CI narrow (precise) or wide (imprecise)? Does the CI cross the line of no effect (not significant)? Does the CI exclude the clinically-important effect (decisive)? Remember: a p-value of 0.001 with an ARR of 0.5% is statistically significant but clinically trivial.
Step 3 — Outcome: is it patient-centred?
Is the primary outcome mortality / quality of life / functional status, or is it a surrogate (CVP, ScvO2, cardiac output, biomarker)? A surrogate outcome that improves without a patient-centred benefit is the EGDT lesson (ProCESS, ARISE, ProMISe — the surrogate improved, the mortality did not).
Step 4 — Applicability: does it apply to my patient?
Is my patient in the trial population (age, severity, comorbidities)? Were my kind of patients excluded (the strict criteria)? Is the intervention deliverable in my unit (drug availability, monitoring, expertise)? Is the comparator my usual care? A trial of EGDT in a US tertiary ED may not apply to a rural Australian ICU.
Step 5 — Synthesis: how does it fit the body of evidence?
Is there a systematic review / meta-analysis? Does the GRADE certainty of the body of evidence warrant a practice change? Was the trial overturned by a later trial (ACURASYS by ROSE)? Is there a guideline (SSC, NICE) that has integrated the body of evidence? The single trial is rarely enough to change practice.
How to interpret a meta-analysis forest plot
1. Identify the comparison and the outcome
Read the column headers: the comparison (e.g. corticosteroids vs placebo), the outcome (e.g. 28-day mortality), the effect measure (RR, OR, HR, mean difference).
2. Read each individual study
Each row is one study. The square = the point estimate; the size of the square = the weight in the pooled estimate (inverse-variance); the horizontal line = the 95% CI. Note whether the line crosses the vertical line of no effect (1 for RR/OR/HR, 0 for difference).
3. Read the heterogeneity
Look at the I² statistic (0-40% low, 30-60% moderate, 50-90% substantial, 75-100% considerable) and the Cochran Q p-value (p<0.10 suggests heterogeneity). High heterogeneity → the pooled estimate is questionable → examine the source (subgroup, sensitivity analysis).
4. Read the pooled estimate (the diamond)
The diamond is the pooled estimate: the centre = the point estimate, the width = the 95% CI. If the diamond does not cross the line of no effect, the pooled result is statistically significant. Read the text below the plot for the point estimate and the CI.
5. Choose the model and examine the funnel plot
If heterogeneity is present, the random-effects model (DerSimonian-Laird) is preferred. Examine the funnel plot for asymmetry (publication bias). Apply the Egger test if >10 studies. Trim-and-fill to estimate the unbiased pooled effect.
6. Apply GRADE to the body of evidence
Downgrade for risk of bias, inconsistency, indirectness, imprecision, publication bias. Upgrade (observational only) for large effect, dose-response, plausible confounding. State the certainty (high, moderate, low, very low) and the strength of recommendation (strong, weak).
The landmark methodological papers — the worked examples
GRADE — Guyatt 2008 (BMJ)
Methodology framework — the consensus of the GRADE Working Group
Population: All clinical questions (therapy, harm, diagnosis, prognosis)
Comparator: Prior frameworks (the Cochrane, the USPSTF)
Key finding
GRADE is now the international standard for the evidence-based guidelines (the WHO, the SSC, the NICE, the ESICM). The certainty is rated the high, the moderate, the low, the very low; the recommendation is the strong or the weak.
CONSORT 2010 — Schulz (BMJ)
Reporting guideline — the 25-item checklist and the flow diagram for the parallel-group RCT
Population: All randomised trials
Comparator: Pre-2010 reporting (the inconsistent, the incomplete)
Key finding
The CONSORT 2010 is the international standard for the RCT reporting. The 2010 update added the trial registration, the protocol, the sample-size calculation, the ITT and the flow diagram.
PRISMA 2020 — Page (BMJ)
Reporting guideline — the 27-item checklist and the flow diagram for the systematic review
Population: All systematic reviews and meta-analyses
Comparator: PRISMA 2009 (Moher, PLoS Med)
Key finding
The PRISMA 2020 added the registration, the protocol, the data-sharing, the RoB 2 (the risk-of-bias tool for the RCT), the publication-bias assessment, the certainty of the evidence (GRADE).
I² heterogeneity — Higgins (BMJ 2003)
Statistical methodology — the derivation of the I-squared statistic
Population: All meta-analyses
Comparator: The Cochran Q (the low power in the small number of studies)
Key finding
The I-squared (0-100%) is the proportion of the total variation that is due to the between-study heterogeneity. The thresholds: 0-40% low, 30-60% moderate, 50-90% substantial, 75-100% considerable.
Egger funnel-plot test — Egger (BMJ 1997)
Statistical methodology — the regression-based test of the funnel-plot asymmetry
Population: Meta-analyses of >10 studies
Comparator: The visual inspection of the funnel plot (the subjective)
Key finding
The intercept significantly different from the zero indicates the asymmetry (the publication bias or the small-study effect). The trim-and-fill method estimates the unbiased pooled effect.
PRECIS — Thorpe (J Clin Epidemiol 2009)
Methodology tool — the pragmatic-explanatory continuum indicator summary
Population: Trial designers and the critical appraisers
Comparator: The unstructured judgement of the pragmatism
Key finding
The PRECIS-2 (Loudon 2015) rates the trial across 9 domains on the 1-5 scale (1 = very explanatory, 5 = very pragmatic). The pragmatic trial is the design for the policy question; the explanatory for the mechanistic.
Sun subgroup credibility — Sun (BMJ 2010)
Methodology framework — the criteria for the credibility of the subgroup analyses
Population: All RCT subgroup analyses
Comparator: The unstructured judgement of the subgroup
Key finding
The credible subgroup: the a-priori specification, the biological rationale, the statistically significant interaction (not the within-subgroup p), the consistency across the studies, the small number of the tested subgroups.
High-yield pearls for the CICM/FFICM/EDIC exam
Additional red flags
References
- [1]The Acute Respiratory Distress Syndrome Network (Brower RG, et al.) Ventilation with lower tidal volumes as compared with traditional tidal volumes for acute lung injury and the acute respiratory distress syndrome (ARMA). New England Journal of Medicine, 2000.PMID 10793162
- [2]De Backer D, Biston P, Devriendt J, et al.; SOAP II Investigators. Comparison of dopamine and norepinephrine in the treatment of shock (SOAP II). New England Journal of Medicine, 2010.PMID 20200382
- [3]Russell JA, Walley KR, Singer J, et al.; VASST Investigators. Vasopressin versus norepinephrine infusion in patients with septic shock (VASST). New England Journal of Medicine, 2008.PMID 18305265
- [4]Papazian L, Forel JM, Gacouin A, et al.; ACURASYS Study Investigators. Neuromuscular blockers in early acute respiratory distress syndrome (ACURASYS). New England Journal of Medicine, 2010.PMID 20843245
- [5]Moss M, Huang DT, Brower RG, et al.; ROSE Trial Investigators. Early Neuromuscular Blockade in the Acute Respiratory Distress Syndrome (ROSE). New England Journal of Medicine, 2019.PMID 31112383
- [6]The ProCESS Investigators (Yealy DM, et al.) A randomized trial of protocol-based care for early septic shock (ProCESS). New England Journal of Medicine, 2014.PMID 24635773
- [7]The ARISE Investigators and ANZICS Clinical Trials Group (Peake SL, et al.) Goal-directed resuscitation for patients with early septic shock (ARISE). New England Journal of Medicine, 2014.PMID 25272316
- [8]Evans L, Rhodes A, Alhazzani W, et al. Surviving sepsis campaign: international guidelines for management of sepsis and septic shock 2021. Intensive Care Medicine, 2021.PMID 34599691
- [9]Karnad DR, Nor MBM, Richards GA, et al. Intensive care in severe malaria: Report from the task force on tropical diseases by the World Federation of Societies of Intensive and Critical Care Medicine. Journal of critical care, 2018.PMID 29132978
- [10]Kazma JM, van den Anker J, Allegaert K, et al. Anatomical and physiological alterations of pregnancy. Journal of pharmacokinetics and pharmacodynamics, 2020.PMID 32026239
- [11]Guyatt GH, Oxman AD, Vist GE, et al. GRADE: an emerging consensus on rating quality of evidence and strength of recommendations. BMJ, 2008.PMID 18436948
- [12]Schulz KF, Altman DG, Moher D; CONSORT Group. CONSORT 2010 statement: updated guidelines for reporting parallel group randomised trials. BMJ, 2010.PMID 20332509
- [13]Moher D, Liberati A, Tetzlaff J, Altman DG; PRISMA Group. Preferred reporting items for systematic reviews and meta-analyses: the PRISMA statement. PLoS Medicine, 2009.PMID 19621072
- [14]Page MJ, McKenzie JE, Bossuyt PM, et al. The PRISMA 2020 statement: an updated guideline for reporting systematic reviews. BMJ, 2021.PMID 33782057
- [15]Egger M, Davey Smith G, Schneider M, Minder C. Bias in meta-analysis detected by a simple, graphical test. BMJ, 1997.PMID 9310563
- [16]Higgins JP, Thompson SG, Deeks JJ, Altman DG. Measuring inconsistency in meta-analyses. BMJ, 2003.PMID 12958120
- [17]Thorpe KE, Zwarenstein M, Oxman AD, et al. A pragmatic-explanatory continuum indicator summary (PRECIS): a tool to help trial designers. Journal of Clinical Epidemiology, 2009.PMID 19348971
- [18]von Elm E, Altman DG, Egger M, Pocock SJ, Gotzsche PC, Vandenbroucke JP; STROBE Initiative. The Strengthening the Reporting of Observational Studies in Epidemiology (STROBE) statement. Annals of Internal Medicine, 2007.PMID 17938396
- [19]Collins GS, Reitsma JB, Altman DG, Moons KG. Transparent reporting of a multivariable prediction model for individual prognosis or diagnosis (TRIPOD): the TRIPOD statement. Annals of Internal Medicine, 2015.PMID 25560714
- [20]Sun X, Briel M, Walter SD, Guyatt GH. Is a subgroup effect believable? Updating criteria to evaluate the credibility of subgroup analyses. BMJ, 2010.PMID 20354011
- [21]Richardson WS, Wilson MC, Nishikawa J, Hayward RS. The well-built clinical question: a key to evidence-based decisions. ACP Journal Club, 1995.PMID 7582737
- [22]DerSimonian R, Laird N. Meta-analysis in clinical trials. Controlled Clinical Trials, 1986.PMID 3802833
- [23]Andrews J, Guyatt G, Oxman AD, et al. GRADE guidelines: 14. Going from evidence to recommendations: the significance and presentation of recommendations. Journal of Clinical Epidemiology, 2013.PMID 23312392