Paeds · professional-practice-and-evidence
Biostatistics for paediatric exams
Also known as Medical statistics for paediatric fellowship · Descriptive and inferential statistics in child health · Confidence intervals, p-values and hypothesis testing · Choosing the right statistical test · Correlation, regression and survival analysis
Fellowship guide to the biostatistics a paediatric candidate must read, calculate and defend: classifying data, summarising with mean, median, standard deviation and interquartile range, the normal distribution and the standard error, confidence intervals and p-values, Type I and Type II errors, power and sample size, choosing the correct comparison and association test, correlation and regression, survival analysis, multiple comparisons, and paediatric-specific issues of growth centiles, z-scores and clustering — with ANZ, UK, US and Canada teaching anchors.
On this page & tools
Your progress
Saved locally on this device.
Practise this topic
Target exams
Red flags
Life stages
Care settings
Clinical exam formats
Board mappings
Read any statistical result in the right order
Overview & Definition
A registrar hands you a trial abstract claiming a new therapy reduces the length of a child's hospital stay, and you must decide whether the result is real, large enough to matter, and applicable to your patient. The abstract reports a p-value and a confidence interval, a mean difference and a test you half remember. Before you can use the number, you must read it correctly. [4]
Biostatistics is the branch of statistics applied to health and biology. Descriptive statistics summarise the data you collected, while inferential statistics use a sample to reason about the population it came from, always carrying an explicit measure of uncertainty. A confidence interval quantifies that uncertainty around an estimate, and a p-value measures the strength of evidence against a null hypothesis. The two together — an effect size with its interval, read against a p-value — are the engine of quantitative inference. [5] [9]
This page owns the descriptive and inferential methods a fellowship candidate must read, calculate and defend in paediatric exams. The measures of risk and benefit — relative risk, absolute risk reduction, number needed to treat — belong to the clinical epidemiology leaf, the test characteristics of sensitivity and specificity belong to the diagnostic accuracy leaf, and the pooling of studies into a forest plot belongs to the systematic reviews leaf. Read this page as the statistical foundation beneath all of them. [6]
Classification
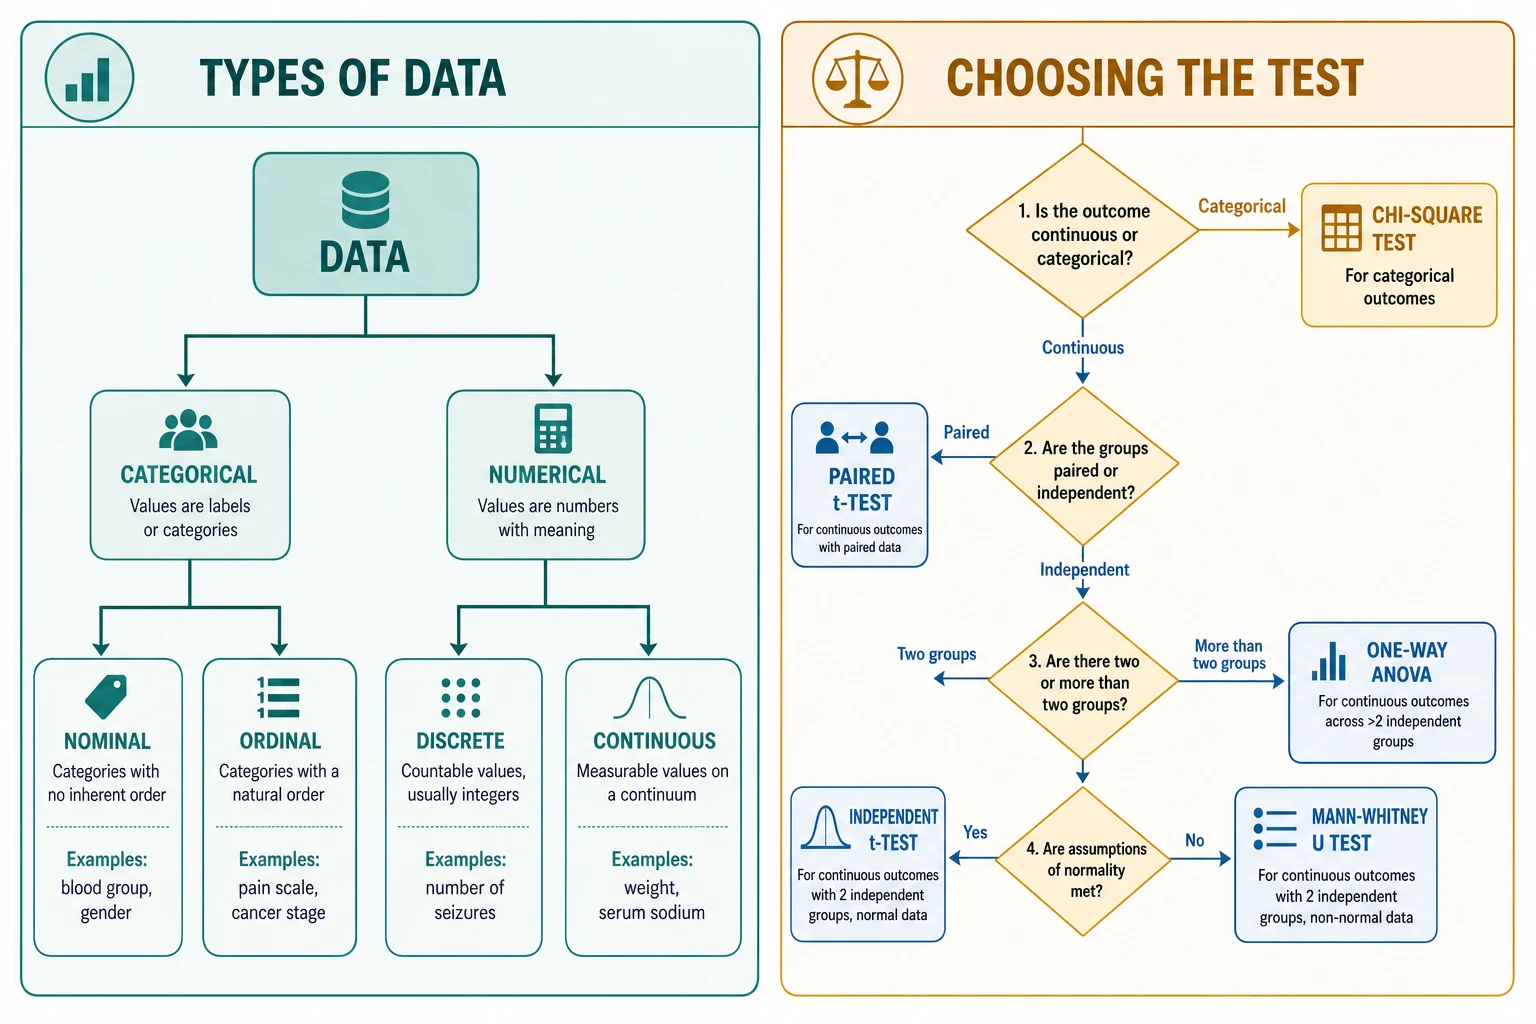
Sort the data in front of you by its type, because the type of data chooses the test you may use. [6] [4]
Categorical data place each child in a named group. Nominal groups have no natural order, such as blood group or sex, while ordinal groups carry an order without equal spacing, such as a pain score or a cancer stage. The summary statistic for categorical data is a count or a proportion, and the matching tests compare proportions — the chi-square test for large samples and Fisher's exact test when counts are small. [6]
Numerical data carry a meaningful magnitude. Discrete numbers are whole counts, such as the number of seizures in a month, while continuous numbers can take any value in a range, such as weight or serum sodium. For numerical data that follow a roughly symmetric, bell-shaped distribution, the mean and standard deviation describe the centre and spread, and parametric tests compare them. For skewed numerical data, the median and interquartile range are the honest measures, and non-parametric, rank-based tests take over. [5] [8]
Paired or independent, and how many groups finish the classification. If the same child is measured twice, as in a before-and-after weight, the comparison is paired. If two separate groups of children are compared, the comparison is independent. Two groups use a t-test or its non-parametric counterpart, while more than two groups use analysis of variance or its rank-based equivalent. Getting the data type, the pairing, and the number of groups right is the whole of choosing a test. [3]
Epidemiology & Risk Factors
Every sample is a fragment of a population, and every estimate carries the error of that sampling. Sampling error is the unavoidable gap between a sample statistic and the true population value, and it shrinks as the sample grows. The standard error of the mean, equal to the standard deviation divided by the square root of the sample size, quantifies how far a sample mean is likely to wander from the truth, and it is the seed from which a confidence interval grows. [9] [10]
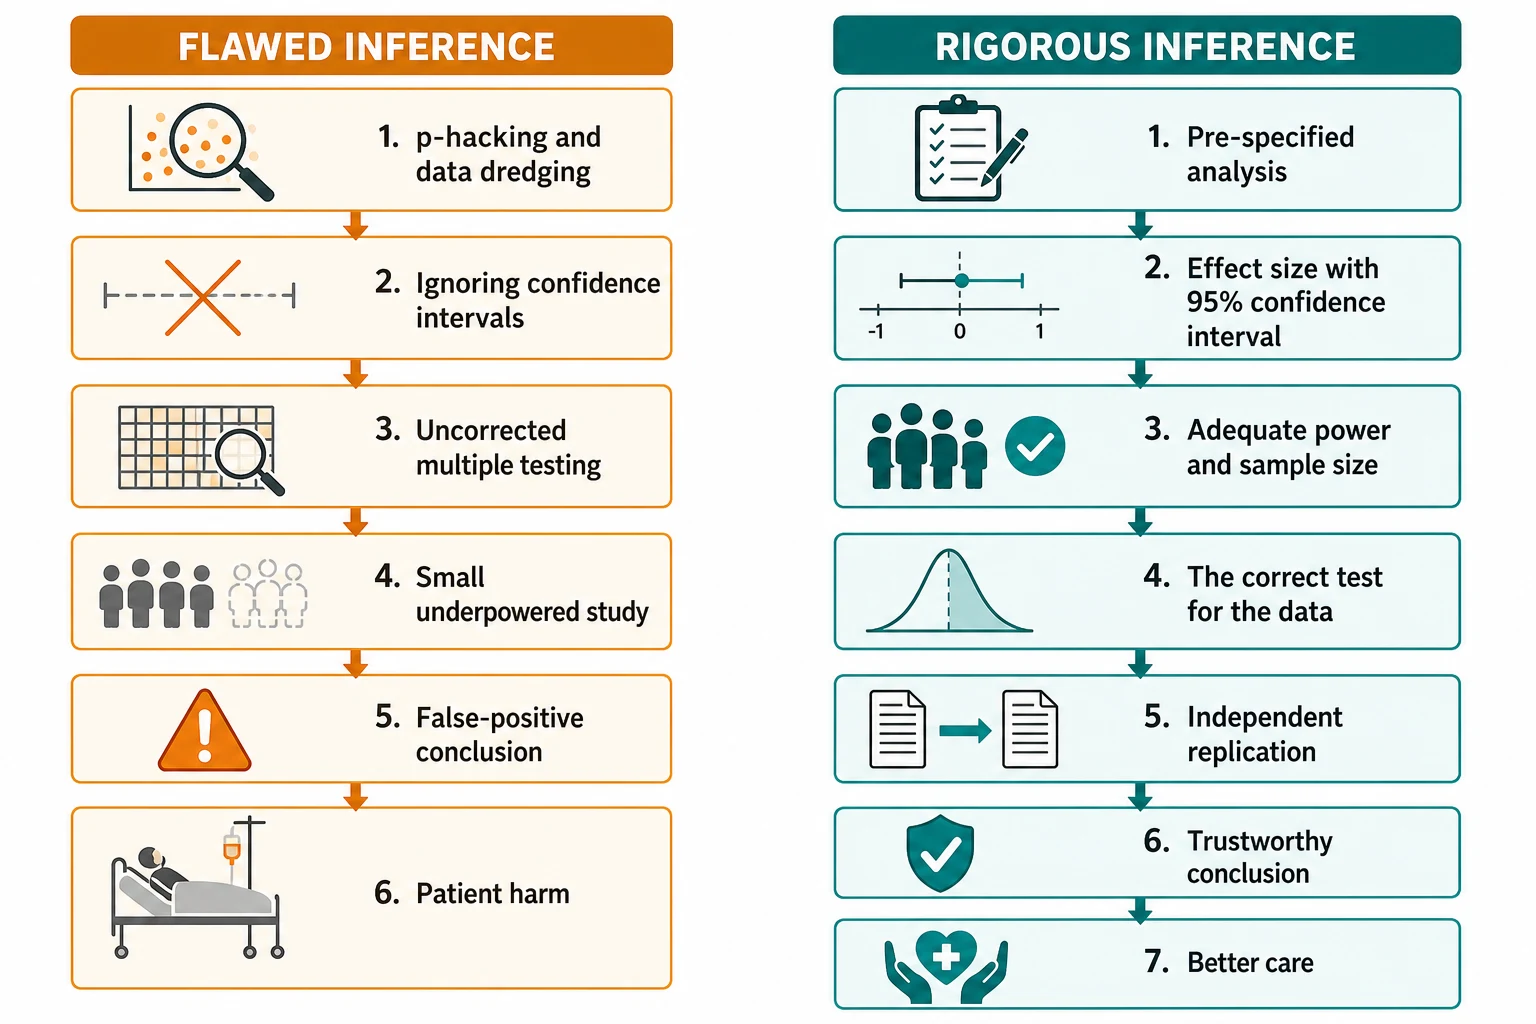
Several features of a study raise the chance of a wrong conclusion. A small sample starves the analysis of power and widens the confidence interval, so a true effect can hide inside it. Running many tests, or many subgroup analyses, inflates the chance of a false positive, because each extra test adds another opportunity for chance to masquerade as discovery. Selective reporting of the significant result among many compounds the harm. Naming these pressures is the first defence against them. [2] [3]
Paediatric data carry an extra structural fragility. Trials in children are smaller and shorter than their adult counterparts, outcomes are often surrogates, and children are frequently clustered in schools, wards or practices so that their measurements are not independent of one another. The paediatric candidate reads a paediatric result, then, with particular attention to the width of its confidence interval and to whether the design respected that clustering. [3] [13]
Pathophysiology
Three ideas carry the mechanism of statistical inference, and a candidate who holds them reads any result with confidence. [9] [5]
The normal distribution and the empirical rule. Many biological measurements, and crucially the distribution of sample means, follow the familiar bell curve. The empirical, or 68-95-99.7, rule states that about 68 percent of values lie within one standard deviation of the mean, 95 percent within two, and almost all within three. The 95 percent figure is the quiet origin of the 95 percent confidence interval, and the two- and three-standard-deviation thresholds are exactly the lines paediatricians use to flag abnormal growth. [9] [13]
The central limit theorem and the standard error. The central limit theorem says that sample means tend toward a normal distribution as the sample grows, even when the underlying data are not normal — which is why the normal approximation underpins so many tests. The standard error, the standard deviation of those sample means, shrinks with the square root of the sample size, so bigger samples give tighter intervals and more precise estimates. [9] [10]
Confidence intervals, p-values, and errors. A 95 percent confidence interval is the range that would, over many samples, capture the true value 95 times in 100; it expresses both the size and the precision of an estimate in one band. The p-value is the probability of seeing a result at least as extreme as the one observed if the null hypothesis were true, so a small p-value is evidence against the null, never proof of it. Two errors shadow every test: a Type I error rejects a true null, a false positive, governed by alpha; a Type II error fails to reject a false null, a false negative, governed by beta. [3] [6]
Clinical Presentation
You will meet statistical results in several recognisable shapes across paediatric exams. [4] [6]
The abstract with a lone p-value. A journal abstract reports p less than 0.05 and concludes a therapy works. Your job is to ask for the effect size and its confidence interval, judge whether the difference is clinically meaningful, and check the test matched the data. A p-value alone never carries that weight. [4]
The confidence interval that crosses the null. A result reports a mean difference whose 95 percent confidence interval spans zero, or a ratio whose interval spans one. That interval is compatible with both a benefit and a harm, so the result is not statistically significant at the 0.05 level, however much its point estimate glitters. [9] [5]
The growth-chart and z-score question. A child's weight sits below the second centile, and you must explain what that means. The centile lines map to standard deviations: about two standard deviations below the mean flags faltering growth, and three flags severity, and a z-score expresses the same thing as a number. [13]
The survival curve or regression output. A paediatric oncology abstract reports a hazard ratio and a Kaplan-Meier curve, or a logistic regression model reports an odds ratio for intensive-care mortality. You must read the ratio with its confidence interval, ask whether the crossing of the curves is real, and judge whether the model controlled for the right confounders. [7] [12]
Differential Diagnosis
Name the true problem before you act on a number. [4] [9]
| You see | Prefer this framing | Trap |
|---|---|---|
| Small p-value | Is the effect large and clinically important, or just very precisely null? | Reading significance as importance |
| Confidence interval crossing the null | Is the result truly inconclusive, or underpowered? | Calling a null-crossing interval a positive result |
| Strong correlation | Is the association causal, or driven by a confounder? | Equating correlation with causation |
| Significant subgroup | Was it pre-specified, or data-dredged from many tests? | Trusting an uncorrected subgroup find |
Significance versus importance. A statistically significant result is one unlikely under the null hypothesis; it says nothing about whether the effect is large enough to matter to a child. A tiny, precisely estimated difference can be highly significant and clinically trivial, so always read the effect size before you act on the p-value. [4] [5]
Correlation versus causation. A correlation coefficient measures the strength and direction of an association, but an association can arise from a confounder, from chance, or from reverse causation, none of which is a causal effect. Causation is a judgement that rests on design, biology, dose-response, and the control of confounders, not on a correlation coefficient alone. [8] [11]
Clinical & Bedside Assessment
Choose the measure of centre and spread for the distribution. For numerical data that follow a roughly symmetric distribution, the mean and standard deviation describe the centre and spread honestly. For skewed data, the median and interquartile range are the truthful measures, because extreme values pull the mean away from where most children sit. Reporting a mean for a skewed variable, such as length of stay, hides the skew and misleads the reader. [10] [5]
Read a confidence interval for the null. A 95 percent confidence interval is a band of plausible values for the true effect. For a difference, the null is zero, and an interval that crosses zero is compatible with no effect. For a ratio, such as an odds ratio or a hazard ratio, the null is one, and an interval that crosses one is likewise not significant. The width of the interval is the precision of the estimate, and a wide interval around a striking point estimate is a fragile result. [9] [7]
Read a regression or survival output. A linear regression coefficient is the change in the outcome for each unit change in the predictor; a logistic regression reports an odds ratio; and a Cox proportional hazards model reports a hazard ratio. Each comes with its confidence interval, and the question is always whether the interval excludes the null and whether the model adjusted for the confounders that matter. A Kaplan-Meier curve plots survival over time, and the log-rank test asks whether two curves truly differ. [7] [11]
Investigations
The investigations here are checks and calculations, not blood tests. [3] [5]
Check the assumptions before you trust a parametric test. The t-test and analysis of variance assume the data are roughly normal and that the groups have similar spread. Plot the data, consider a test of normality for small samples, and if the assumptions fail, fall back to the rank-based non-parametric test — the Mann-Whitney U for two independent groups, the Wilcoxon signed-rank for paired data, and the Kruskal-Wallis for more than two groups. [6] [8]
Calculate the standard error and the confidence interval. The standard error of the mean is the standard deviation divided by the square root of the sample size, and a 95 percent confidence interval runs roughly two standard errors either side of the estimate. From summary data alone, you can judge whether an interval is wide and the result fragile, or narrow and the result precise. [9] [10]
Estimate the sample size from power. The sample size a study needs depends on the size of the effect it hopes to detect, the alpha it sets, and the power it wants, where power is one minus beta. An underpowered study is one set to miss a real effect, so a non-significant result in a small study is not evidence of no effect — it is evidence of insufficient evidence. [3] [5]
Correct for multiple comparisons. When a study runs many tests or many subgroup analyses, the chance of at least one false positive rises with each test. The Bonferroni correction divides alpha by the number of tests to keep the family-wise error rate under control, and a pre-specified analysis plan prevents the data-dredging that inflates false positives. Treat a lone significant subgroup among many tested with the suspicion it deserves. [2] [6]
Management — Resuscitation
Some moments are statistical emergencies, where a misread number is about to drive the wrong decision. [4] [6]
A significant but trivial result. A large trial reports a tiny, precisely estimated difference that is statistically significant but clinically meaningless. Resist the pull of the p-value, report the absolute effect size, and do not change practice for a difference no child would feel. [4] [5]
An important result that is underpowered. A small paediatric study reports a clinically large effect whose wide confidence interval crosses the null. The point estimate may be real, but the study was too small to be sure, so do not declare the therapy useless and do not declare it proven — call the result inconclusive and seek a larger or replicated study. [3] [10]
A result presented as a lone p-value. A colleague quotes p less than 0.05 with no effect size and no confidence interval. Ask for both before you act, because a p-value without its estimate and its interval is a number stripped of the information that makes it usable. [4] [9]
Management — Definitive & Stepwise
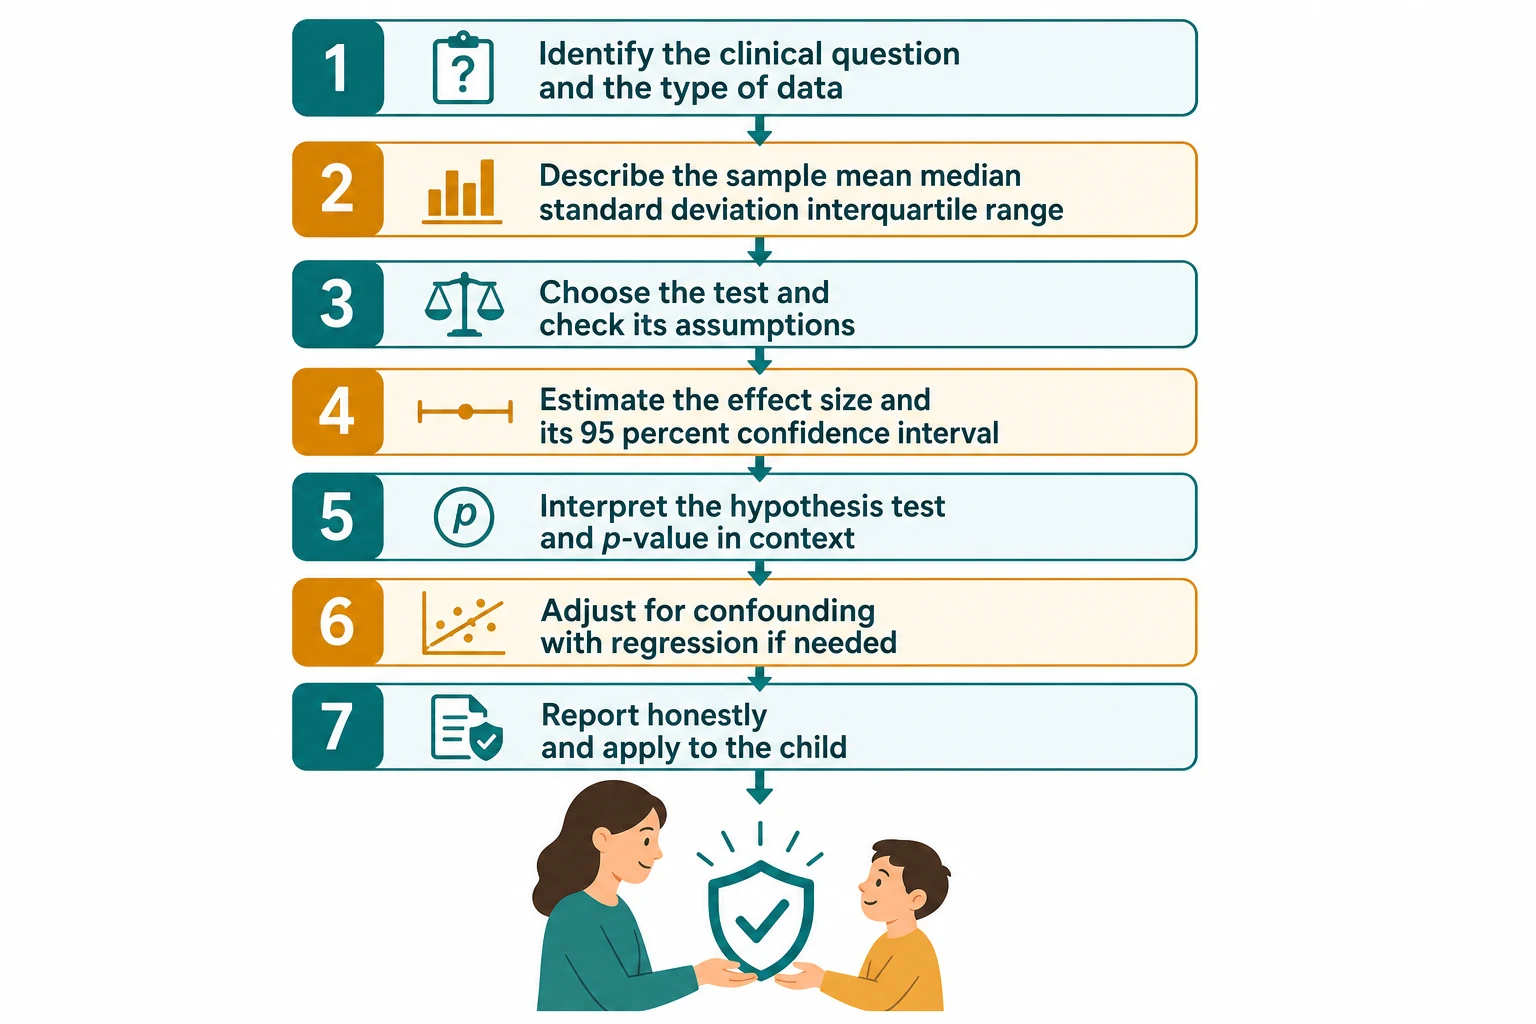
Work through any statistical result in a fixed order, and you will read it correctly every time. [4] [3]
Step one — identify the question and the data type. Ask what was measured, on whom, and how. Classify the outcome as categorical or numerical, note whether the comparison is paired or independent, and count the groups. The data type, the pairing, and the number of groups together decide the test. [6]
Step two — describe the sample. Summarise the data with the honest measure of centre and spread: mean and standard deviation for symmetric numerical data, median and interquartile range for skewed data, and counts and proportions for categorical data. A good description is half the analysis. [10] [5]
Step three — choose the test and check its assumptions. Match the test to the data: the paired t-test for paired numerical data, the independent t-test for two groups, one-way analysis of variance for more than two, the chi-square or Fisher's exact test for proportions, and their non-parametric counterparts when assumptions fail. Check normality and equal variance before you trust a parametric test. [3] [8]
Step four — estimate the effect size with its 95 percent confidence interval. Report how big the difference is and how precisely it was measured, in absolute terms a family can understand. The effect size and its interval are the heart of the result, far more than the p-value that follows. [4] [9]
Step five — interpret the hypothesis test in context. Read the p-value as the strength of evidence against the null, not as a measure of importance, and never let it override a clinical judgement. If the analysis explored many subgroups, apply a correction and lower your confidence in the lone significant find. [2] [6]
Step six — account for confounding and association. Where a third variable distorts the relationship, use regression to adjust: linear regression for a continuous outcome, logistic regression for a binary outcome reported as an odds ratio, and Cox regression for time-to-event data reported as a hazard ratio. Check the model controlled for the confounders that matter. [11] [7]
Specific Subtypes & Scenarios
Growth centiles and z-scores. A child's growth is judged against age- and sex-specific reference curves, such as the WHO or UK 1990 standards. The centile lines correspond to standard deviations: a weight about two standard deviations below the mean flags faltering growth, and three flags severity. A z-score expresses the same thing as a signed number of standard deviations from the reference mean, which lets you follow change over time even as the child crosses centile lines. [13]
Cluster-randomised and nested designs. When children are grouped in schools, wards or practices, their outcomes are not independent of one another, so a naive analysis overstates the precision of the result. The design effect and the intracluster correlation correct for this clustering, and the paediatric candidate checks whether a cluster-randomised trial reported its analysis at the right level. Ignoring clustering inflates the apparent significance of a result. [3] [11]
Survival analysis in paediatric oncology. Time-to-event outcomes, such as relapse-free survival, are plotted as a Kaplan-Meier curve and compared with the log-rank test. The Cox proportional hazards model estimates a hazard ratio — the relative rate of the event between groups — and the assumption that the hazard ratio stays constant over time must hold. A hazard ratio is a relative rate of events, not a ratio of median survival times, and its confidence interval carries the precision. [7]
Repeated measures and longitudinal data. When the same child is measured many times, as in a developmental follow-up study, the measurements are correlated within the child. Methods such as repeated-measures analysis of variance or mixed-effects models respect that non-independence, where a naive test would treat each visit as a separate child and overstate the sample size. [11] [3]
Logistic regression for a binary outcome. When the outcome is binary, such as intensive-care mortality or the presence of a complication, logistic regression estimates the odds ratio for each predictor while adjusting for the others. The candidate reads the odds ratio with its confidence interval, checks the model had enough events for the number of predictors, and remembers that an odds ratio overstates the relative risk when the outcome is common. [12] [11]
Complications & Pitfalls
- Equating a small p-value with a large or clinically important effect. [4] [5]
- Reading a null-crossing confidence interval as a positive result. [9] [10]
- Using a parametric test when the assumptions of normality or equal variance are not met. [6] [8]
- Ignoring the problem of multiple comparisons and trusting a data-dredged subgroup. [2]
- Conflating correlation with causation, or a confounder with a true predictor. [8] [11]
- Applying an adult-derived threshold or centile to a child without age- and sex-standardisation. [13]
- Treating a non-significant result in a small, underpowered study as proof of no effect. [3] [5]
Prognosis & Disposition
A good statistical reading is measured by the decision it supports, not by the elegance of its arithmetic. [4] [9]
Markers of a robust result. The study was adequately powered, the analysis was pre-specified, the effect size is clinically meaningful, and its confidence interval is narrow and excludes the null. Where these hold, the conclusion is likely to endure; where they do not, expect revision when a larger or better study arrives. [5] [3]
When to defer. Where a result is underpowered or exploratory, defer judgement, seek a larger or replicated study, and choose the reversible option while the evidence matures. A non-significant result in a small study is a reason to keep gathering evidence, not a reason to declare no effect. [3] [10]
When to escalate. Where the stakes are high and the evidence thin, seek specialist or methodological input, consult a statistician for a complex design, and share the residual uncertainty with the family in plain absolute language before deciding together. [4] [11]
Disposition includes communication. Report the effect size and its confidence interval, translate the result into absolute terms a family can weigh, document the conclusion and its uncertainty, and set a plan to revisit the decision as evidence accumulates. [4] [9]
Special Populations
Neonates and infants. Correct for gestational age and use sex-specific weight z-scores rather than raw birthweight. Samples are small and outcomes are surrogates, so demand the effect size and its confidence interval rather than a lone p-value, and treat extrapolated adult thresholds with caution. [13] [3]
Children with chronic disease. Use disease-specific growth references where they exist, because population centiles misrepresent a child whose condition shapes their growth. Check that risk models were derived in a comparable population rather than extrapolated from well children. [13] [11]
Adolescents. Standardise growth and risk by age, sex and pubertal stage, and confirm that any risk model actually included adolescents rather than borrowing adult coefficients. Apply the result with the young person through shared decision-making that respects their emerging autonomy. [13] [4]
Children in cluster designs. When children are nested in schools, wards or practices, their measurements are correlated, which inflates apparent precision unless corrected. Check that the analysis respected the clustering, read the design-adjusted confidence interval, and discount any result that ignored the design. [3] [11]
Evidence, Guidelines & Regional Differences
Core anchors are the Bland and Altman series of Statistics Notes for the foundations of medical statistics, the Akobeng paper on errors, power and sample size written for paediatricians, the Sullivan and Feinn paper on effect size and the limits of the p-value, the Nakagawa and Cuthill guide to effect sizes and confidence intervals, the Sedgwick papers on null hypothesis testing, the Bonferroni method, Spearman correlation and odds ratios, the Altman and Bland papers on confidence intervals and uncertainty, the Concato paper on events per variable in regression, the Cortés paper on hazard ratios, and the Freeman paper on the UK 1990 growth reference curves. [1] [2] [3] [4] [5] [6] [7] [8] [9] [10] [11] [12] [13]
The RACP curriculum frames biostatistics and critical appraisal as a core scholarly skill, and the Akobeng series in Acta Paediatrica is written directly for paediatric trainees. Growth is assessed against WHO standards for infants and national references for older children, with z-scores used to follow change over time. Use locally endorsed growth references and report results in absolute terms a family can weigh. [3] [13]
The RCPCH Progress+ curriculum embeds evidence-based practice and research methodology as a core professional skill, and the UK 1990 and subsequent growth references are the standard for centile plotting. The Bland and Altman Statistics Notes in the BMJ are a freely available foundation, and the customary cutoff of two standard deviations flags faltering growth. [13] [1]
The American Board of Pediatrics content outline names evidence-based medicine, biostatistics and critical appraisal as tested material, and the CDC clinical growth charts and z-score computation are the standard for paediatric growth. The Sullivan and Feinn paper on effect size, published in the Journal of Graduate Medical Education, speaks directly to the US training context. [4] [13]
The CanMEDS Scholar role maps directly onto locating, appraising and applying quantitative evidence, and Canadian growth monitoring uses WHO standards. Use locally endorsed references, document the effect size and its confidence interval behind each decision, and apply the result to the child through shared decision-making. [4] [9]
Controversies: the reproducibility crisis and an over-reliance on the p less than 0.05 threshold, the move toward effect sizes and confidence intervals, pre-registration of analyses, and the persistent misuse of subgroup analyses. Exam answers show a structured reading of the effect size with its interval, an honest account of uncertainty, and local humility. [6] [2] [4]
Exam Pearls
- The standard error equals the standard deviation divided by the square root of the sample size. [9] [10]
- A 95 percent confidence interval that crosses the null (zero for a difference, one for a ratio) is not statistically significant at the 0.05 level. [9] [5]
- Type I error is alpha, a false positive; Type II error is beta, a false negative; power is one minus beta. [3]
- Pearson r measures linear association in normally distributed data; Spearman rho uses ranks and needs no normality assumption. [8]
- Logistic regression reports an odds ratio; Cox regression reports a hazard ratio; linear regression reports a coefficient. [11] [7]
- Growth z-scores: about two standard deviations below the mean flags faltering growth; three indicates severe. [13]
- The Bonferroni correction divides alpha by the number of tests to control the family-wise error rate. [2]
Read any statistical result and apply it to a child
Identify the clinical question and classify the data type, pairing, and number of groups
Describe the sample with the honest measure of centre and spread
Choose the test that matches the data and check its assumptions
Estimate the effect size with its 95 percent confidence interval
Interpret the hypothesis test and p-value in context, correcting for multiple comparisons
Account for confounding with regression where a third variable distorts the relationship
Report the result in absolute terms and apply it to the child through shared decision-making
References
- [1]Bland JM, Altman DG Statistical methods for assessing agreement between two methods of clinical measurement. Lancet, 1986.PMID 2868172
- [2]Bland JM, Altman DG Multiple significance tests: the Bonferroni method. BMJ, 1995.PMID 7833759
- [3]Akobeng AK Understanding type I and type II errors, statistical power and sample size. Acta Paediatr, 2016.PMID 26935977
- [4]Sullivan GM, Feinn R Using Effect Size-or Why the P Value Is Not Enough. J Grad Med Educ, 2012.PMID 23997866
- [5]Nakagawa S, Cuthill IC Effect size, confidence interval and statistical significance: a practical guide for biologists. Biol Rev Camb Philos Soc, 2007.PMID 17944619
- [6]Sedgwick PM, Hammer A, Kesmodel US, Pedersen LH Current controversies: Null hypothesis significance testing. Acta Obstet Gynecol Scand, 2022.PMID 35451497
- [7]Cortés J, González JA, Campbell MJ, Cobo E A hazard ratio was estimated by a ratio of median survival times, but with considerable uncertainty. J Clin Epidemiol, 2014.PMID 25063554
- [8]Sedgwick P Spearman's rank correlation coefficient. BMJ, 2014.PMID 25432873
- [9]Altman DG, Bland JM How to obtain the confidence interval from a P value. BMJ, 2011.PMID 21824904
- [10]Altman DG, Bland JM Uncertainty beyond sampling error. BMJ, 2014.PMID 25424583
- [11]Concato J, Peduzzi P, Holford TR, Feinstein AR Importance of events per independent variable in proportional hazards analysis. I. Background, goals, and general strategy. J Clin Epidemiol, 1995.PMID 8543963
- [12]Sedgwick P What are the odds? BMJ, 2015.PMID 25934660
- [13]Freeman JV, Cole TJ, Chinn S, Jones PR, White EM, Preece MA Cross sectional stature and weight reference curves for the UK, 1990. Arch Dis Child, 1995.PMID 7639543