Paeds · professional-practice-and-evidence
Clinical epidemiology and measures of effect
Also known as Measures of effect in paediatric research · Relative risk, odds ratio and hazard ratio · Absolute risk reduction and number needed to treat · Attributable risk and population attributable fraction · Interpreting effect estimates and confidence intervals
Fellowship guide to clinical epidemiology and measures of effect in paediatrics: incidence and prevalence, the 2x2 contingency table, relative risk, odds ratio and hazard ratio, risk difference, absolute and relative risk reduction, number needed to treat and harm, attributable risk and population attributable fraction, interpretation of confidence intervals, effect modification and confounding, with worked examples and ANZ, UK, US and Canada guidance.
On this page & tools
Your progress
Saved locally on this device.
Practise this topic
Target exams
Red flags
Life stages
Care settings
Clinical exam formats
Board mappings
Overview & Definition
A parent hands you an abstract claiming a therapy halves their child's risk of a complication, and you must decide whether to start it. The word "halves" is a relative risk reduction, and on its own it tells you almost nothing useful, because the same 50 percent reduction means a very different absolute benefit when the baseline risk is 2 in 100 than when it is 20 in 100. Clinical epidemiology is the set of methods that turns a study's raw counts into the numbers that drive that decision, and its measures of effect are the vocabulary in which the answer must be given. [1] [8]
Clinical epidemiology applies epidemiological methods to the questions clinicians ask at the bedside — therapy, harm, prognosis, and aetiology. Its currency is the measure of effect, the statistic that quantifies the strength of the link between an exposure (or a treatment) and an outcome. Two facts about any outcome anchor everything else: incidence counts new cases over time, while prevalence counts existing cases at a single point. A risk is a probability of the outcome, between 0 and 1, while an odds is a ratio of the probability of the event to the probability of no event, which can run from 0 to infinity. [8]
The central distinction you must hold is between relative and absolute measures. A relative measure tells you how many times more likely the outcome is in one group than another, while an absolute measure tells you how many extra or fewer events the exposure actually produces. They answer different questions, they can disagree about whether an effect is large, and a report that gives only the relative figure is hiding the more useful number. This page owns the computation and interpretation of these measures; the appraisal process and hierarchy of evidence belong to the evidence-based medicine leaf, and sensitivity, specificity, and likelihood ratios belong to the diagnostic accuracy leaf. [1] [14]
Classification
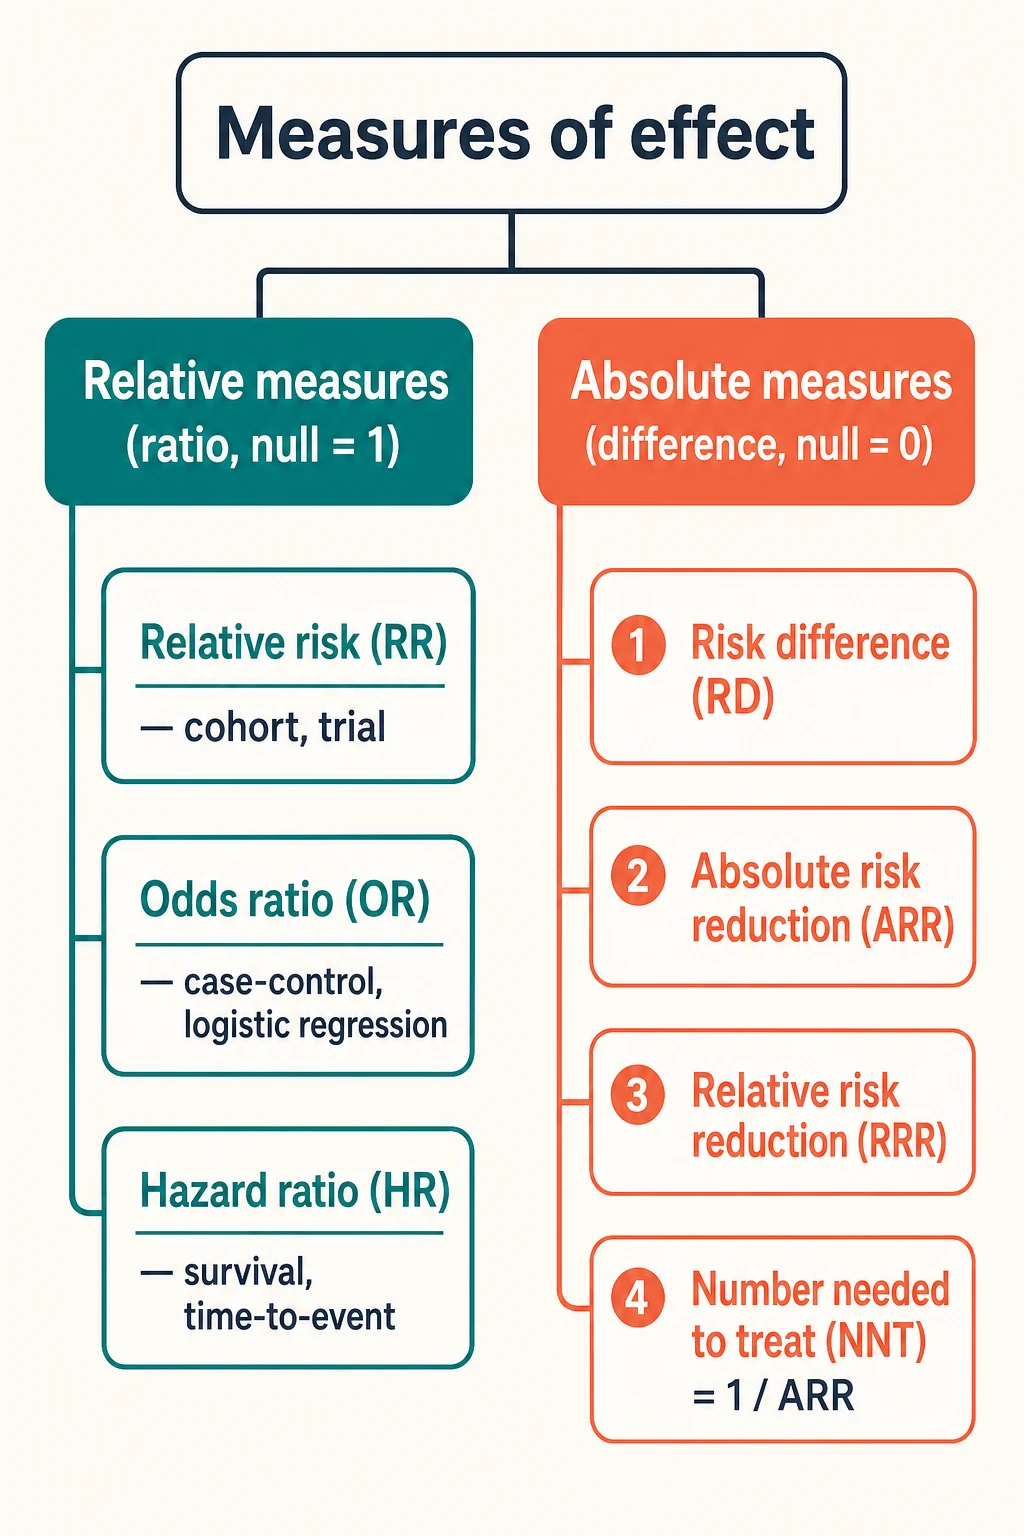
Sort each measure you meet by the question it answers, because the right measure depends on both the question and the study design that produced it. [8] [2]
Ratio measures compare two chances as a multiplier. Relative risk divides the risk in the exposed by the risk in the unexposed, and it suits prospective designs where you follow defined groups forward in time, namely cohort studies and randomised trials. The odds ratio divides the odds of the outcome in the exposed by the odds in the unexposed, and it is the only measure available from a case-control study, because that design samples by outcome and cannot compute a true risk. The hazard ratio compares the instantaneous event rates of two survival curves over time and is the correct measure whenever the outcome is time-to-event and censoring matters. [5] [7]
Difference measures compare two chances as a gap. The risk difference subtracts the risk in one group from the risk in the other and answers the question of how many extra or fewer events the exposure causes. When the exposure is a treatment that reduces harm, the risk difference is the absolute risk reduction, and its reciprocal is the number needed to treat — the count of patients you must treat to prevent one event. The relative risk reduction, by contrast, is one minus the relative risk, expressed as a percentage, and it is the figure a marketing abstract prefers because it always looks larger. [3] [4]
Association is not the same as impact. A measure of association, such as a relative risk or odds ratio, tells you whether a link exists and how strong it is. A measure of impact, such as the attributable risk or the population attributable fraction, tells you how much of the disease burden in a population the exposure actually explains. You reach for impact measures when the question is the public-health or preventive priority of removing an exposure, not merely whether the exposure is linked to the outcome. [12]
Epidemiology & Risk Factors
Measures of effect appear in almost every piece of evidence a clinician reads, from the abstract of a randomised trial to the pooled estimate of a meta-analysis and the recommendation of a guideline. Understanding where they come from, and how readily they mislead, is therefore a core literacy, not a specialist skill. [1] [14]
Relative measures dominate abstracts, headlines, and marketing because a ratio looks more impressive than the gap it rests on. A therapy that halves a risk sounds transformative, yet if that risk was already small the absolute benefit may be negligible and the number needed to treat large. The systematic preference for relative figures in published summaries biases clinical perception toward inflated benefit, and the defence is to demand the absolute baseline and the number needed to treat every time. [3] [8]
Several conditions distort an effect estimate and create the common pitfalls examiners test. A common outcome inflates the odds ratio away from the relative risk, so reading the odds ratio as a relative risk overstates the effect. A small baseline risk inflates the relative risk reduction while leaving the absolute benefit small, which is exactly the combination that misleads. Effect modification hides inside a single pooled estimate, so the average effect may describe no real subgroup, and confounding can manufacture a spurious association that vanishes on adjustment. [5] [12]
Children are especially vulnerable to a misread effect, for three reasons. Much of the paediatric evidence is extrapolated from adults, so the population that generated the estimate is not the child in the bed. Paediatric outcomes are often rare, which makes individual studies small, confidence intervals wide, and pooled estimates built on disparate baseline risks. And therapies are frequently promoted on surrogate endpoints, where a large effect on an intermediate measure hides an unproven effect on the outcome the family actually cares about. [1] [14]
Pathophysiology
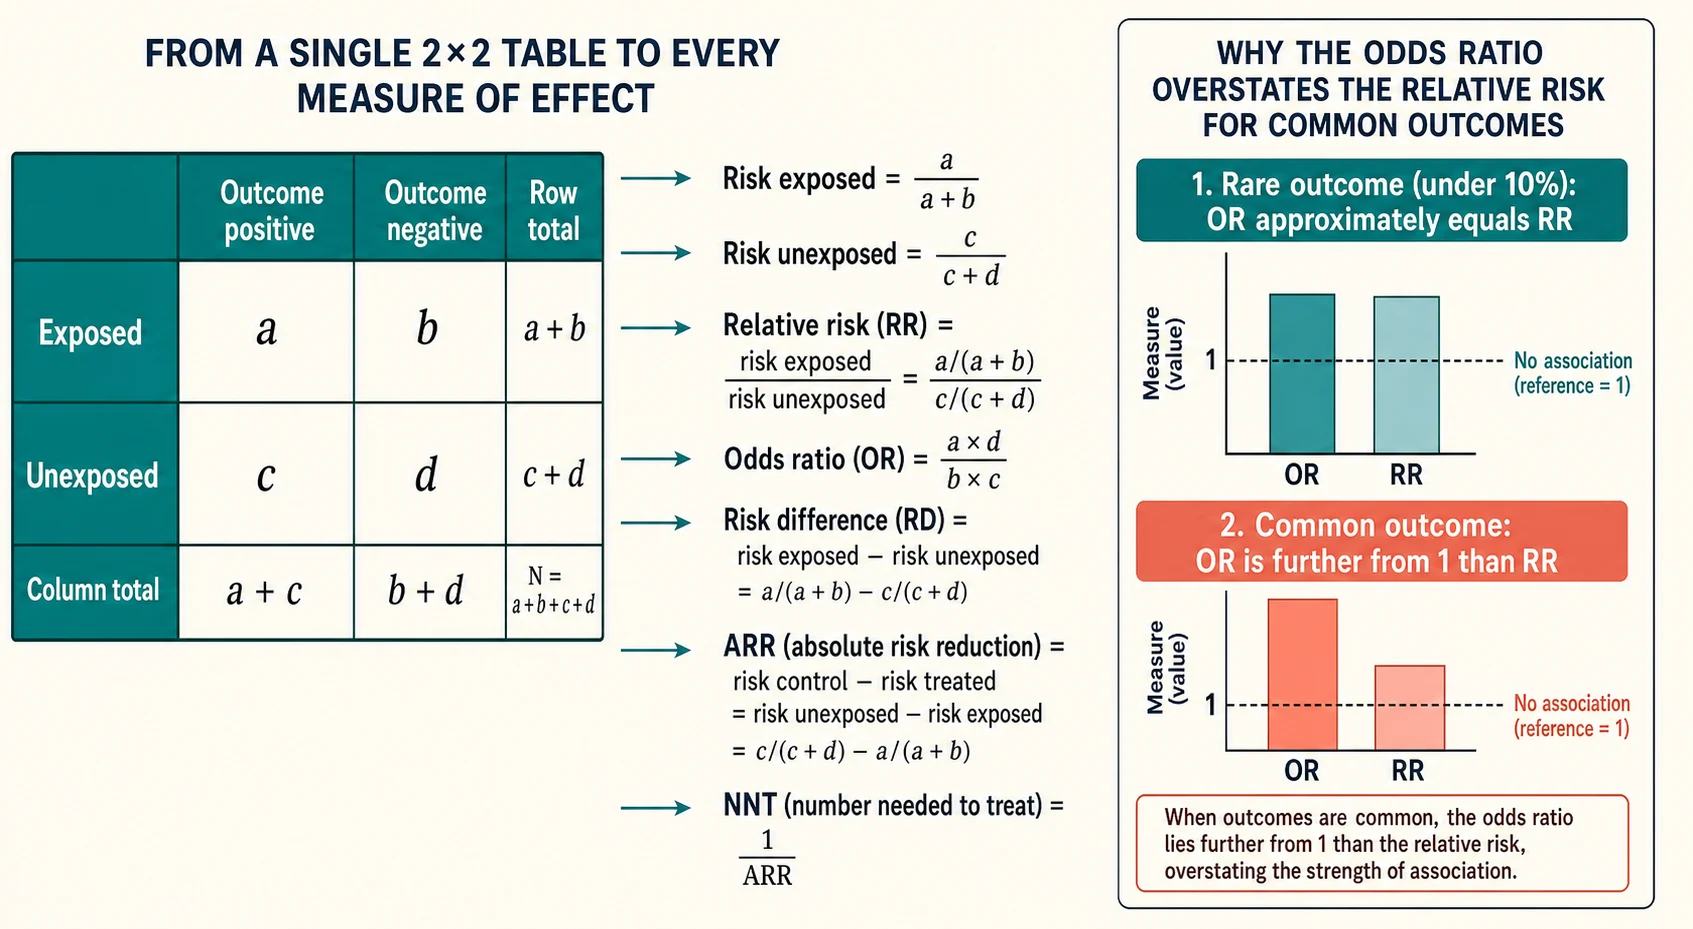
Every measure of effect flows from one object, the 2x2 contingency table, so learn to build it before you trust any summary. Lay the exposure across the rows and the outcome across the columns, label the four cells a, b, c, and d, and add the marginal totals. The single table then generates the relative risk, the odds ratio, the risk difference, the absolute risk reduction, and the number needed to treat. [2] [8]
Relative risk divides the risk in the exposed by the risk in the unexposed, so a relative risk of 2 means the outcome is twice as likely in the exposed group and a relative risk of 0.5 means it is half as likely. The null value, meaning no association, is 1. You can compute a relative risk only from a prospective design in which both groups are defined at the start and followed forward, which is why cohort studies and randomised trials report it. [5] [2]
The odds ratio divides the odds of the outcome in the exposed by the odds in the unexposed, which algebraically reduces to a times d divided by b times c. The null value is again 1. The odds ratio is the measure forced on you by a case-control study, because that design selects participants by their outcome status and so cannot count a true risk in a defined population. Logistic regression also produces odds ratios by default, which is why they appear so often even in prospective data. [5] [6]
Why the odds ratio overstates the relative risk for common outcomes is the single most examinable idea on this page. When the outcome is rare, under about 10 percent, the odds and the risk are close, so the odds ratio and the relative risk agree. When the outcome is common, the odds grow much faster than the risk, so the odds ratio moves further from 1 than the relative risk does, overstating the strength of the association. Reading an odds ratio as a relative risk for a common outcome is therefore a systematic error that inflates the apparent benefit or harm, and the correction is to report the relative risk whenever the design and the data allow it. [5] [6]
The hazard ratio compares the event rates of two groups across the whole follow-up period rather than at a single time point, so it uses the full survival curve and respects censoring. A hazard ratio of 0.7 means the treated group experiences events at 70 percent of the rate of the control group at every point along the curve. It is the correct measure for time-to-event outcomes, but it is an average over time and can hide curves that cross, which is why you should always inspect the Kaplan-Meier plot alongside it. [7]
Clinical Presentation
You will meet effect measures in a handful of recognisable shapes, and naming the shape tells you which trap to defend against. [8] [14]
The relative-only abstract. A trial reports that a therapy reduces a complication by 50 percent but never states the baseline risk or the absolute benefit. The trap is the inflation of perceived benefit, and your move is to extract the two event rates and compute the absolute risk reduction and the number needed to treat yourself. [3] [4]
The common-outcome odds ratio. A case-control study reports an odds ratio and is being read as if it were a relative risk for an outcome that affects a third of the population. The trap is overstatement, and your move is to note that the true relative risk is closer to 1 than the odds ratio suggests, and to restate the magnitude honestly. [5] [6]
The pooled odds ratio across disparate baselines. A meta-analysis combines odds ratios from trials whose baseline risks range from 2 to 30 percent and offers a single summary. The trap is believing the summary describes a real effect in any one patient, because the same odds ratio maps onto very different absolute effects at different baseline risks. Your move is to look for heterogeneity and to read the absolute effects in the relevant subgroup. [14] [9]
The hazard ratio without the curve. A survival study reports a hazard ratio of 0.7 but shows no Kaplan-Meier plot. The trap is treating the average rate ratio as the whole story, when the curves may separate late, converge, or cross. Your move is to demand the curves and to judge whether the proportional-hazards assumption holds. [7]
The small relative risk on a rare outcome. A harm study reports a relative risk of 2 for an adverse event that occurs once in 10,000 children. The trap is alarm at the doubling, when the absolute risk increase is one extra event per 10,000 and the number needed to harm is 10,000. Your move is to translate the relative figure into the absolute increase and weigh it against the benefit. [4] [8]
Differential Diagnosis
Before you act on a number, name the problem it actually describes, because the common confusions each carry a different fix. [8] [12]
| You see | The real question | Trap |
|---|---|---|
| An odds ratio in a case-control study | What is the true magnitude for a common outcome? | Read the OR as an RR and overstate the effect |
| A 50 percent relative risk reduction | How many events does the therapy actually prevent? | Forget the absolute baseline and the NNT |
| A confidence interval crossing the null | Is the result positive? | Call a non-positive result a positive one |
| A hazard ratio of 0.7 with no curve | Is the benefit spread evenly over time? | Assume proportional hazards without checking |
| A pooled odds ratio across baselines | Does the summary fit my patient? | Believe one number fits every baseline risk |
Relative risk versus odds ratio. Both share the null value of 1, but they answer different questions and suit different designs. Use the relative risk for cohort and trial data, where the risk in each group is known, and the odds ratio for case-control data, where it is not. When a prospective study reports an odds ratio, ask whether the outcome was common enough to make that choice misleading. [5] [6]
Absolute risk reduction versus relative risk reduction. The relative risk reduction is always the larger and more flattering figure, which is why it dominates marketing. The absolute risk reduction is the figure that drives the number needed to treat and that the family can actually feel, so report it beside every relative figure. [3] [4]
A confidence interval crossing the null versus a precise trivial effect. An interval that crosses the null value, 1 for a ratio or 0 for a difference, is compatible with both benefit and harm and is not a positive result, however large the point estimate. A narrow interval around a tiny effect is precise but clinically unimportant. Read the interval against the null first, then against the threshold of clinical importance. [10] [8]
Effect modification versus confounding. Effect modification means the true effect genuinely differs across subgroups — the treatment works better in one age band than another — and the honest report stratifies by it rather than averaging it away. Confounding means the apparent effect is a distortion by a third variable, and adjustment shrinks or removes it. The two need opposite responses: effect modification is reported, confounding is removed. [11] [12]
Clinical & Bedside Assessment
Read every effect estimate in a fixed order, so that no step is skipped under pressure. [2] [8]
Identify the design first. Name whether the study is a randomised trial, a cohort study, a case-control study, or a survival analysis. The design dictates which measure is even computable, so this step prevents the common error of reading a case-control odds ratio as a cohort relative risk. [5] [2]
Name the correct measure for that design. Match relative risk to cohort and trial, odds ratio to case-control and logistic regression, and hazard ratio to time-to-event. Choosing the wrong measure does not just change the number; it can change the conclusion. [7] [6]
Read the point estimate with its confidence interval. State the magnitude of the effect, then state the range of values compatible with the data by reading the 95 percent confidence interval against the null. A relative risk of 0.6 with an interval from 0.4 to 0.9 excludes the null and supports a real effect; the same point estimate with an interval from 0.3 to 1.2 does not. [10] [8]
Translate the effect into the absolute benefit for this child. Convert the relative risk reduction into an absolute risk reduction using the child's own baseline risk, and then into a number needed to treat. The number needed to treat is only as honest as the baseline risk that produced it, so never borrow the trial's average when the child's risk differs. [3] [4]
State the certainty of the whole body of evidence. A single estimate, however precise, sits inside a body of evidence whose certainty you rate with GRADE, downgrading for risk of bias, inconsistency, indirectness, imprecision, and publication bias. The certainty tells the family how firmly to lean on the number. [14] [11]
Investigations
The investigation here is the computation: extract the cells, build the table, and check the arithmetic and the interval before you believe the headline. [2] [8]
Extract the four cells. From the paper, pull the count in each cell of the 2x2 table, plus the total, before you trust any derived figure. A surprising number of abstracts report a relative risk or an odds ratio that the published counts do not reproduce, so this step catches transcription and rounding errors. [8]
Compute the relative measures. Divide the risk in the exposed by the risk in the unexposed for the relative risk, and compute a times d divided by b times c for the odds ratio. Confirm the result against the paper's headline; a discrepancy means the paper used adjusted values, a different referent, or an error. [5] [2]
Compute the absolute measures. Subtract the risk in the treated group from the risk in the control group for the absolute risk reduction, and take its reciprocal for the number needed to treat, rounding up to the next whole person. A negative absolute risk reduction signals harm, and its reciprocal is the number needed to harm. [3] [4]
Compute the impact measures when the question is prevention. The attributable risk among the exposed is the risk in the exposed minus the risk in the unexposed, and it answers how much of the exposed group's disease the exposure actually causes. The population attributable fraction estimates the share of all cases in the population that would disappear if the exposure were removed, and it weighs the public-health priority of an intervention. [12]
Read the confidence interval for precision and null-crossing. A wide interval means the study was too small to be precise, even if the point estimate looks impressive. Always state whether the interval crosses the null, because that single fact decides whether the result is positive, negative, or indeterminate. [10] [8]
Management — Resuscitation
Some moments are emergencies of a different kind, where a misquoted or misread measure is about to drive an expensive or harmful decision. [1] [8]
Imminent treatment on a relative figure alone. A child is about to receive a costly therapy on the strength of a 50 percent relative risk reduction quoted without the baseline. Stop the decision, extract the two event rates, and compute the absolute risk reduction and the number needed to treat before proceeding, because a large relative reduction can hide a clinically trivial absolute benefit. [3] [4]
The common-outcome odds ratio read as a relative risk. A team is planning care around an odds ratio from a case-control study of a common outcome, treating it as a relative risk. Correct the overstatement before it changes practice, restate the true magnitude, and reach for a relative risk or an absolute measure wherever the data allow. [5] [6]
The null-crossing confidence interval called positive. A guideline or a colleague is acting on an estimate whose interval crosses the null as though it were a proven benefit. State plainly that the result is compatible with both benefit and harm, and do not let momentum carry a decision the data do not support. [10] [8]
The borrowed number needed to treat. A family is being counselled with a number needed to treat drawn from a trial whose average baseline risk differs from their child's. Recompute the number needed to treat from the child's own baseline risk, because the same relative effect produces very different absolute benefits at different baselines. [3] [4]
Management — Definitive & Stepwise
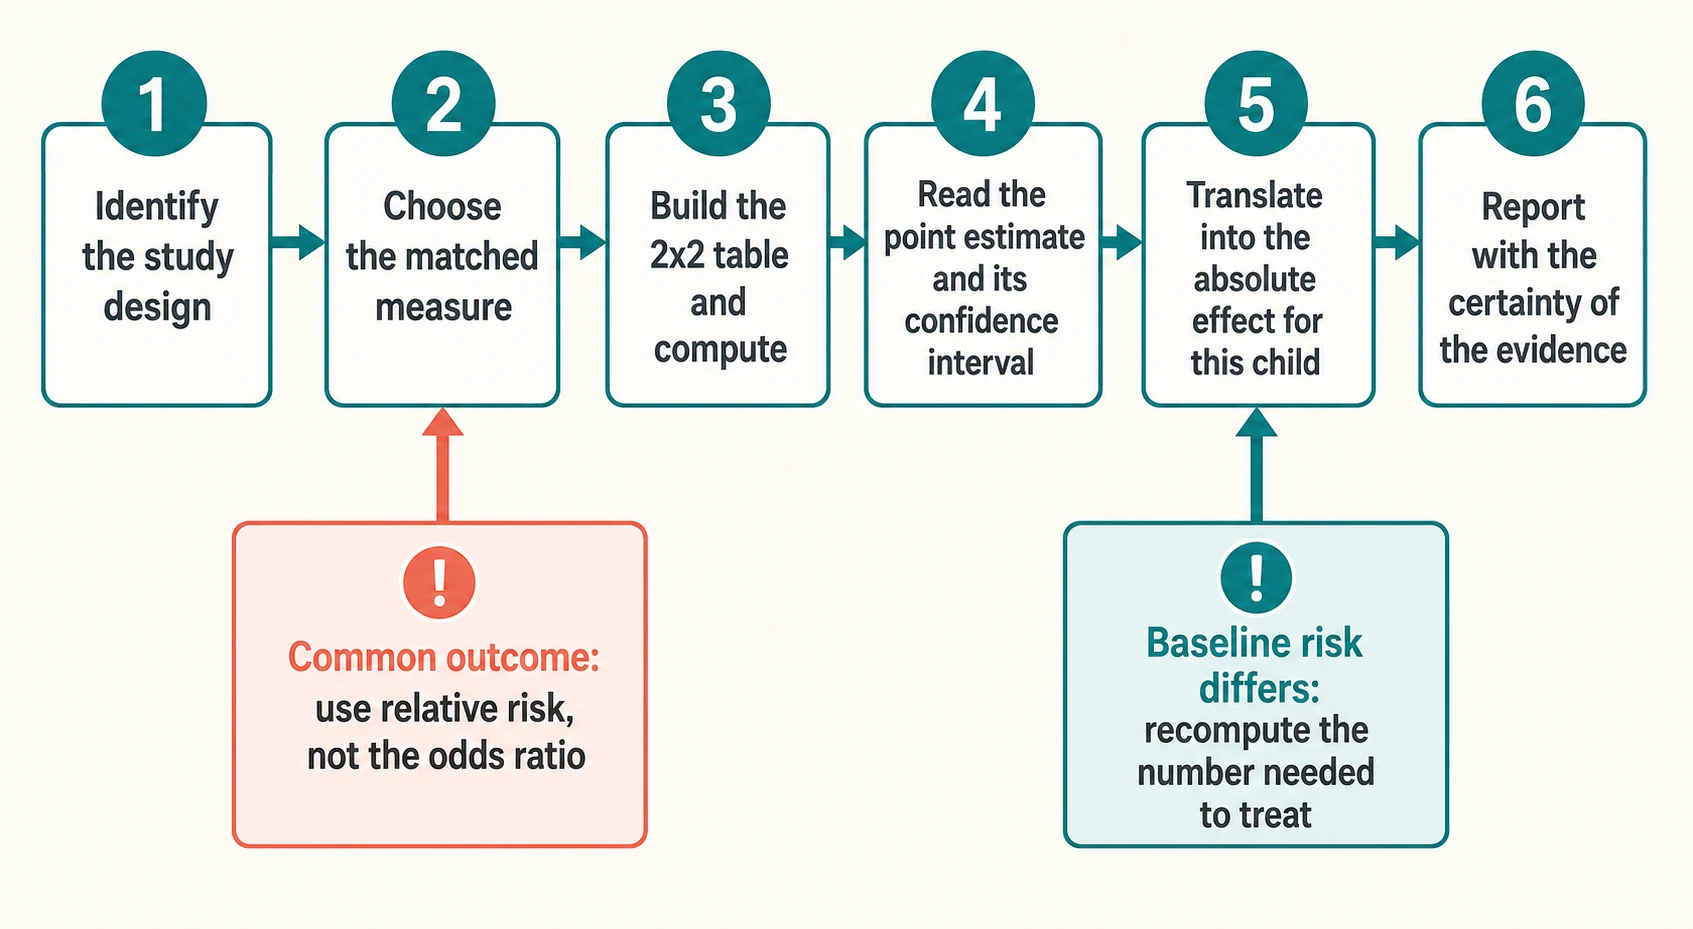
Work through the choice and reporting of an effect measure in a fixed sequence, so that the family receives the honest magnitude of the effect. [2] [8]
- Identify the study design. Name the design, because it dictates which measure is computable and which is misleading. [5]
- Choose the matched measure. Relative risk for cohort and trial, odds ratio for case-control and logistic regression, hazard ratio for time-to-event. [7] [6]
- Build the 2x2 table and compute. Extract the four cells and derive the measure yourself, confirming the paper's headline. [2]
- Read the point estimate with its confidence interval. State the magnitude and the range, and note whether the interval crosses the null. [10]
- Translate into the absolute effect for this child. Convert to an absolute risk reduction and a number needed to treat using the child's own baseline risk. [3] [4]
- Report with the certainty of the evidence. Combine the estimate with its GRADE certainty and the family's values through shared decision-making. [14]
Report relative and absolute together. A relative measure is stable across baseline risks and good for pooling, while an absolute measure carries the benefit the family feels, so quote at least one of each. A report that gives only the relative figure is incomplete, however large or precise it appears. [3] [8]
Tailor the number needed to treat to the child. The number needed to treat is the reciprocal of the absolute risk reduction, so it inherits the baseline risk. A child at lower baseline risk than the trial average will have a larger number needed to treat and a smaller absolute benefit, and a child at higher risk will have the opposite. State the baseline risk you used and recompute, rather than borrowing the trial's figure. [4] [3]
Use impact measures when the question is prevention. When the question is whether removing an exposure would reduce the disease burden in a population, report the attributable risk and the population attributable fraction rather than a relative risk alone. The population attributable fraction rises with both the strength of the association and the prevalence of the exposure, so a modest relative risk on a widespread exposure can carry a large population burden. [12]
Specific Subtypes & Scenarios
A worked example fixes each measure in memory better than any definition, so work through these until the arithmetic is automatic. [2] [8]
Relative risk and absolute risk reduction from a trial. Suppose a randomised trial of a preventive therapy enrolls 1,000 children and reports the outcome in 200 of 1,000 controls and 100 of 1,000 treated children. The risk in controls is 200 per 1,000, or 20 percent, and the risk in the treated group is 10 percent, so the relative risk is 0.5 and the relative risk reduction is 50 percent. The absolute risk reduction is 10 percent, or 100 events per 1,000, and the number needed to treat is 10. The 50 percent relative figure sounds dramatic, but the honest number for the family is that you treat 10 children to prevent one event. [3] [4]
The odds ratio from a case-control study. A case-control study of a common outcome finds an odds ratio of 4. Because the outcome is common, the relative risk is closer to 1 than the odds ratio, so reporting the odds ratio as a relative risk overstates the association. The lesson is that an odds ratio from a common-outcome case-control study is a measure of association, not a measure of the risk a family will face, and should be reported with that caveat or converted where possible. [5] [6]
The hazard ratio from a survival analysis. A time-to-event study reports a hazard ratio of 0.7 for a therapy, meaning the treated group experiences events at 70 percent of the rate of the control group across the follow-up period. Because the hazard ratio is an average over time, you inspect the Kaplan-Meier curves to confirm the benefit is spread evenly and that the curves do not cross. A hazard ratio hides information a single risk at a fixed time would also miss, so the curve is part of the result. [7]
Number needed to treat and baseline risk. Take the relative risk reduction of 50 percent from the trial above and apply it to two children. A child whose baseline risk is 20 percent has an absolute risk reduction of 10 percent and a number needed to treat of 10, exactly as in the trial. A child whose baseline risk is only 2 percent has an absolute risk reduction of 1 percent and a number needed to treat of 100, because the same relative effect produces a tenth of the absolute benefit at a tenth of the baseline risk. The number needed to treat is meaningless without the baseline risk that generated it. [3] [4]
Attributable risk and population attributable fraction. Suppose an exposure raises the risk of an outcome from 10 percent in the unexposed to 30 percent in the exposed. The attributable risk among the exposed is 20 percent, the excess disease the exposure causes. If half the population is exposed, the population attributable fraction rises with both the strength of the link and the prevalence of the exposure, quantifying how much of the population's disease would vanish if the exposure were removed. This is the measure that sets a prevention priority, not the relative risk alone. [12] [8]
Complications & Pitfalls
- Reading an odds ratio as a relative risk when the outcome is common, which overstates the apparent effect. [5]
- Quoting a relative risk reduction without the absolute baseline risk or the number needed to treat. [3]
- Treating a confidence interval that crosses the null as a positive result, however large the point estimate. [10]
- Applying a number needed to treat from a trial to a child whose baseline risk differs, without recomputing it. [4]
- Pooling odds ratios across trials with disparate baseline risks and believing the summary describes a real effect in one patient. [14]
- Reporting a hazard ratio without the Kaplan-Meier curves, hiding curves that separate late or cross. [7]
- Confusing effect modification with confounding, or hiding a true subgroup difference inside a single pooled estimate. [11]
- Using a relative measure to answer a question of impact, when the attributable risk or population attributable fraction is what the decision needs. [12]
Prognosis & Disposition
A well-reported effect estimate is measured by the decision it supports, not by how large or impressive it looks. [1] [14]
Markers of success. The report names the design, uses the matched measure, gives the point estimate with its confidence interval, translates the effect into an absolute benefit tailored to the child, and rates the certainty of the body of evidence. The clinician can state the question, the measure, the magnitude, the precision, and the reasoning in plain terms the family can follow. [2] [3]
When to defer. Where the confidence interval is too wide to be precise, or the baseline risk is too uncertain to compute a reliable number needed to treat, defer the decision until better evidence arrives or choose the reversible option and reassess. A wide interval around a large point estimate is not a green light. [10] [8]
When to escalate. Sparse evidence combined with high stakes warrants a second opinion, specialist input, or a multidisciplinary discussion, especially where the effect estimate is indirect or the family's values pull against the average recommendation. [14] [1]
Disposition includes documentation. Record the design, the measure, the point estimate and confidence interval, the absolute effect and number needed to treat you used, the certainty rating, and the shared decision, so the reasoning survives the moment and teaches the next clinician. [14] [2]
Special Populations
Neonates and infants. Most effect estimates are extrapolated from older children or adults, so read them down for indirectness and recompute the number needed to treat for the infant's baseline risk, which is often very different from the trial average. [1] [14]
Children with rare disease. Outcomes are rare and studies are small, so the odds ratio may be the only available measure but the confidence intervals are wide and the number needed to treat is imprecise. Lean on shared decision-making, patient registries, and networks that pool the few cases that exist. [14] [5]
Aboriginal and Torres Strait Islander, Maori, and other Indigenous children. Check whether the effect was generated with the community and is epidemiologically applicable to the population, and privilege locally generated data and Indigenous data sovereignty over extrapolated estimates. [1]
Adolescents. Confirm that the estimate's population actually includes adolescents, and apply the measure with the young person through shared decision-making that respects their emerging autonomy. [14]
Children with medical complexity. Trial populations often exclude these children, so weigh applicability carefully and prioritise patient-centred outcomes such as quality of life and family burden alongside the headline effect. [14] [12]
Evidence, Guidelines & Regional Differences
The core anchors for measures of effect are the Guyatt and Sackett Users' Guides for therapy results, the Laupacis and Cook work on clinically useful measures and the number needed to treat, Davies on when odds ratios mislead, Zhang and Yu on correcting the odds ratio for common outcomes, Spruance on the hazard ratio, the Greenhalgh statistics series, the Egger test for meta-analysis bias, the Altman and Bland notes on absence of evidence and on interaction, Grimes and Schulz on bias and causal association in observational research, the Jaeschke Users' Guides for diagnostic results, and the Murad guide for reading a systematic review. [2] [3] [4] [5] [6] [7] [8] [9] [10] [11] [12] [13] [14]
The RACP curriculum frames clinical epidemiology and measures of effect within evidence-based practice and critical appraisal as core professional skills, and Cochrane Australasia publishes appraised syntheses that report both relative and absolute effects. Use locally endorsed guidelines and registries, and where the evidence is sparse for Aboriginal and Torres Strait Islander and Maori children, seek community-generated data and culturally safe pathways before applying an extrapolated estimate. [1] [14]
The RCPCH Progress+ curriculum frames evidence-based practice and research methodology as a core professional skill, and the National Institute for Health and Care Excellence publishes guidelines that carry graded, certainty-rated recommendations built on reported effect estimates. Use NICE and Cochrane syntheses, and report the absolute effect alongside any relative figure when counselling a family. [9] [14]
The American Academy of Pediatrics issues clinical practice guidelines built on graded evidence, and the United States Preventive Services Task Force grades recommendations on a transparent scale of certainty and benefit that turns on the magnitude and precision of the effect estimate. Apply these alongside Cochrane reviews, and convert relative effects into absolute benefits tailored to the child. [3] [14]
The CanMEDS Scholar role maps directly onto locating, appraising, and applying evidence, and Canadian guideline bodies publish recommendations whose strength rests on the certainty of the underlying effect estimates. Use locally endorsed guidance and appraised syntheses, and document the measure, its confidence interval, and the certainty behind each decision. [14] [2]
Controversies remain live in three places: whether the odds ratio or the relative risk should headline a meta-analysis of common outcomes; how to present the number needed to treat honestly when baseline risk varies widely across a population; and how to communicate effect modification without losing the family in subgroup arithmetic. Exam answers show the right measure for the design, the absolute effect beside the relative one, an honest reading of the confidence interval, and local humility. [5] [4] [11]
Exam Pearls
- Ratio measures (relative risk, odds ratio, hazard ratio) share the null value of 1; difference measures (risk difference, absolute risk reduction) share the null value of 0. [8]
- Number needed to treat is the reciprocal of the absolute risk reduction, rounded up to the next whole person. [4]
- The odds ratio overstates the relative risk for common outcomes; they agree only when the outcome is rare, under about 10 percent. [5]
- The hazard ratio is the ratio of event rates over time and respects censoring; it is not the same as a relative risk at an arbitrary time point. [7]
- Relative risk reduction is always larger in magnitude than absolute risk reduction, which is why abstracts prefer it. [3]
- Attributable risk is the excess risk in the exposed; population attributable fraction is the share of all population cases the exposure explains. [12]
- A confidence interval that crosses the null is a negative or indeterminate result, not a positive one, no matter how large the point estimate. [10]
Choose the measure by the design
Compute and report an effect estimate at the bedside
Identify the study design and name the measure it allows
Build the 2x2 table and extract the four cells
Compute the relative measure for the design
Compute the absolute risk reduction and number needed to treat
Read the point estimate with its 95 percent confidence interval against the null
Tailor the number needed to treat to the child's baseline risk and report both
References
- [1]Sackett DL, Rosenberg WM, Gray JA, Haynes RB, Richardson WS Evidence based medicine: what it is and what it isn't BMJ, 1996.PMID 8555924
- [2]Guyatt GH, Sackett DL, Cook DJ Users' guides to the medical literature. II. How to use an article about therapy or prevention. B. What were the results and will they help me in caring for my patients? Evidence-Based Medicine Working Group JAMA, 1994.PMID 8258890
- [3]Laupacis A, Sackett DL, Roberts RS An assessment of clinically useful measures of the consequences of treatment N Engl J Med, 1988.PMID 3374545
- [4]Cook RJ, Sackett DL The number needed to treat: a clinically useful measure of treatment effect BMJ, 1995.PMID 7873954
- [5]Davies HT, Crombie IK, Tavakoli M When can odds ratios mislead? BMJ, 1998.PMID 9550961
- [6]Zhang J, Yu KF What's the relative risk? A method of correcting the odds ratio in cohort studies of common outcomes JAMA, 1998.PMID 9832001
- [7]Spruance SL, Reid JE, Grace M, Samore M Hazard ratio in clinical trials Antimicrob Agents Chemother, 2004.PMID 15273082
- [8]Greenhalgh T How to read a paper. Statistics for the non-statistician. II: Significant relations and their pitfalls BMJ, 1997.PMID 9277611
- [9]Egger M, Davey Smith G, Schneider M, Minder C Bias in meta-analysis detected by a simple, graphical test BMJ, 1997.PMID 9310563
- [10]Altman DG, Bland JM Absence of evidence is not evidence of absence BMJ, 1995.PMID 7647644
- [11]Altman DG, Bland JM Interaction revisited: the difference between two estimates BMJ, 2003.PMID 12543843
- [12]Grimes DA, Schulz KF Bias and causal associations in observational research Lancet, 2002.PMID 11812579
- [13]Jaeschke R, Guyatt GH, Sackett DL Users' guides to the medical literature. III. How to use an article about a diagnostic test. B. What are the results and will they help me in caring for my patients? The Evidence-Based Medicine Working Group JAMA, 1994.PMID 8309035
- [14]Murad MH, Montori VM, Ioannidis JP, et al. How to read a systematic review and meta-analysis and apply the results to patient care: users' guides to the medical literature JAMA, 2014.PMID 25005654