Paeds · professional-practice-and-evidence
Quality improvement methods in child health
Also known as Quality improvement paediatrics · Model for Improvement child health · PDSA cycles children · Statistical process control paediatrics · QI collaboratives neonatal
Fellowship guide to leading quality improvement in child health: the Model for Improvement, aim and measure design, PDSA cycles, driver diagrams, run charts and statistical process control, collaboratives, evidence appraisal and exam defence.
On this page & tools
Your progress
Saved locally on this device.
Practise this topic
Target exams
Red flags
Life stages
Care settings
Clinical exam formats
Board mappings
Overview & Definition
A ward has too many children receiving antibiotics they do not need. A neonatal unit wants fewer central-line infections. An asthma service is tired of repeat admissions. These are not research questions and they are not single incident reports — they are quality problems, and they are solved with quality improvement methods. This leaf teaches you how to design, lead and judge a QI project in child health. Deep human-factors theory lives on the patient-safety page; research appraisal on the evidence-based-medicine page. [1] [2]
Quality improvement (QI) is the combined and unceasing efforts to make changes that lead to better patient outcomes, better system performance and better professional development. Berwick framed improvement as a system we lead deliberately, not an accident we wait for. [1] [2]
The key distinction the viva tests: QI is not research. Research generates generalisable new knowledge for a population; QI improves care here, now, for these children, using methods designed for fast local learning. QI is not clinical audit. Audit measures practice against an external standard at a point in time; QI actively tests changes to move practice toward a better state, iteratively. QI is not innovation. Innovation invents something new; QI usually adapts and tests changes that are already known to work. [1] [8]
Classification
Classify a QI effort by the method family the team reaches for. The Model for Improvement is the dominant frame in child health, but it is not the only one, and examiners expect you to know what each is good at. Lean removes waste from a value stream. Six Sigma reduces defects using data and a structured DMAIC sequence. Collaboratives spread a method across many teams at once. [1] [4]
You also classify by the level of the aim. The Triple Aim — better individual care, better population health, lower per-capita cost — sets the strategic horizon; the Quintuple Aim adds health equity and clinician well-being. A ward-level project aims lower and faster. Knowing the level prevents a project that promises population health from a single unit. [3]
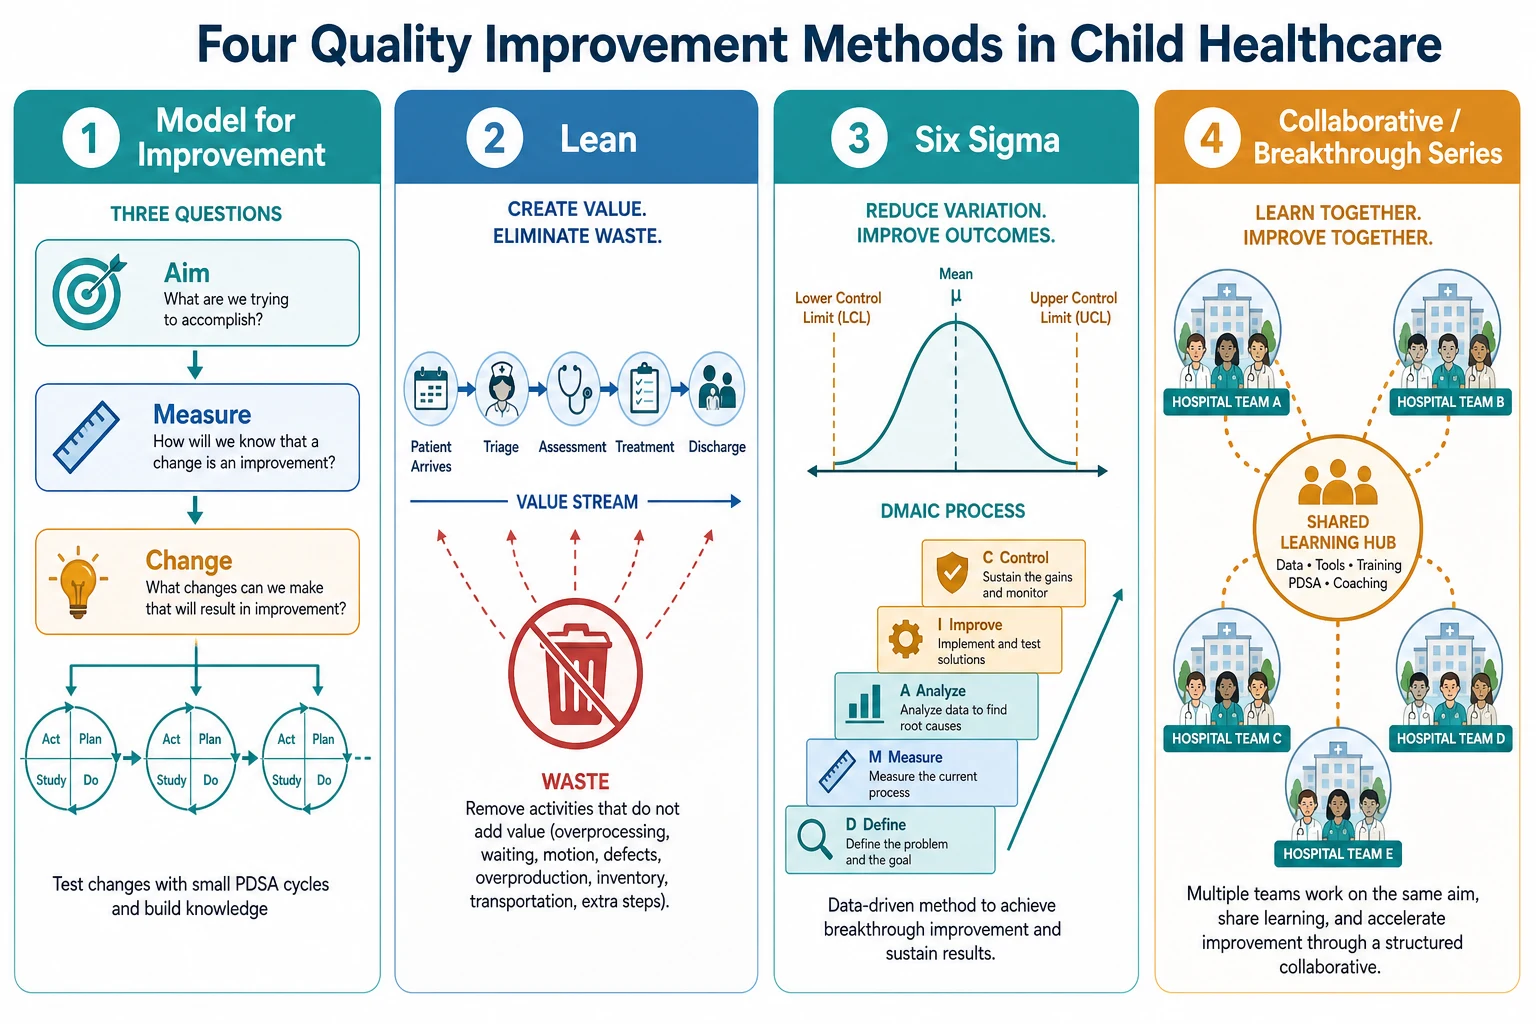
QI method families at a glance
- Three questions plus PDSA cycles
- Best for testing change ideas fast
- Dominant frame in child health
- Remove waste, smooth the value stream
- Maps the flow a family actually experiences
- Visual, front-line focused
- Reduce defects and variation
- Uses DMAIC and statistical tools
- Strong for high-volume, defect-prone processes
- Many teams learn together over months
- Spread a known method fast
- Vermont Oxford Network is the paediatric exemplar
Epidemiology & Risk Factors
Unwarranted variation is the raw material of QI. Children receive different care for the same condition depending on where they present — antibiotic duration for neonatal sepsis, time to first fluid in shock, inhaler technique review before discharge. Some variation is clinical judgement; much is not. These gaps are where improvement lives. [13]
Risk that a quality gap will exist or persist clusters in recognisable places. Neonates and PICU patients concentrate in paediatric collaboratives because their care is high-acuity, device-intensive and weight-based. Children with medical complexity carry polypharmacy, devices and multi-team fragmentation that multiply opportunities for harm. Small rural and remote units face low volumes and few staff, which makes both problems and measurement harder. [5] [13]
The structural barriers to doing QI are also examinable: poor data infrastructure, no protected improvement time, high staff turnover, and a culture that punishes honest failure of a small test. Equity gaps are the sharpest epidemiology point — Indigenous, migrant and socioeconomically disadvantaged children often improve less than the average unless the project measures and targets them explicitly. [3] [8]
Pathophysiology
How does a vague wish become a tested, sustained improvement? Through a theory of change made explicit. The Model for Improvement works because it forces the team to state what they believe will happen and then measure whether it does. Vague aims drift. Explicit aims, paired with measurement and small tests, converge. [1] [2]
A driver diagram is the working theory. At the top sits the global aim — the outcome the families and clinicians care about. Beneath it sit the primary drivers: the few system factors that must move for the aim to move. Beneath those sit secondary drivers and specific change ideas — the things you actually test with PDSA. This is why the diagram matters: it turns "we should do better" into a testable, prioritised set of experiments. [8]
The PDSA cycle reduces risk deliberately. You test a change on one patient, one shift, one unit before rolling it out. If it fails, it fails small and cheaply. This is the opposite of a big-bang rollout, where an untested change is imposed on everyone and harm is discovered late. Iteration also copes with context: what works in one ward may need adaptation in another, and the cycle finds that out. [2] [8]
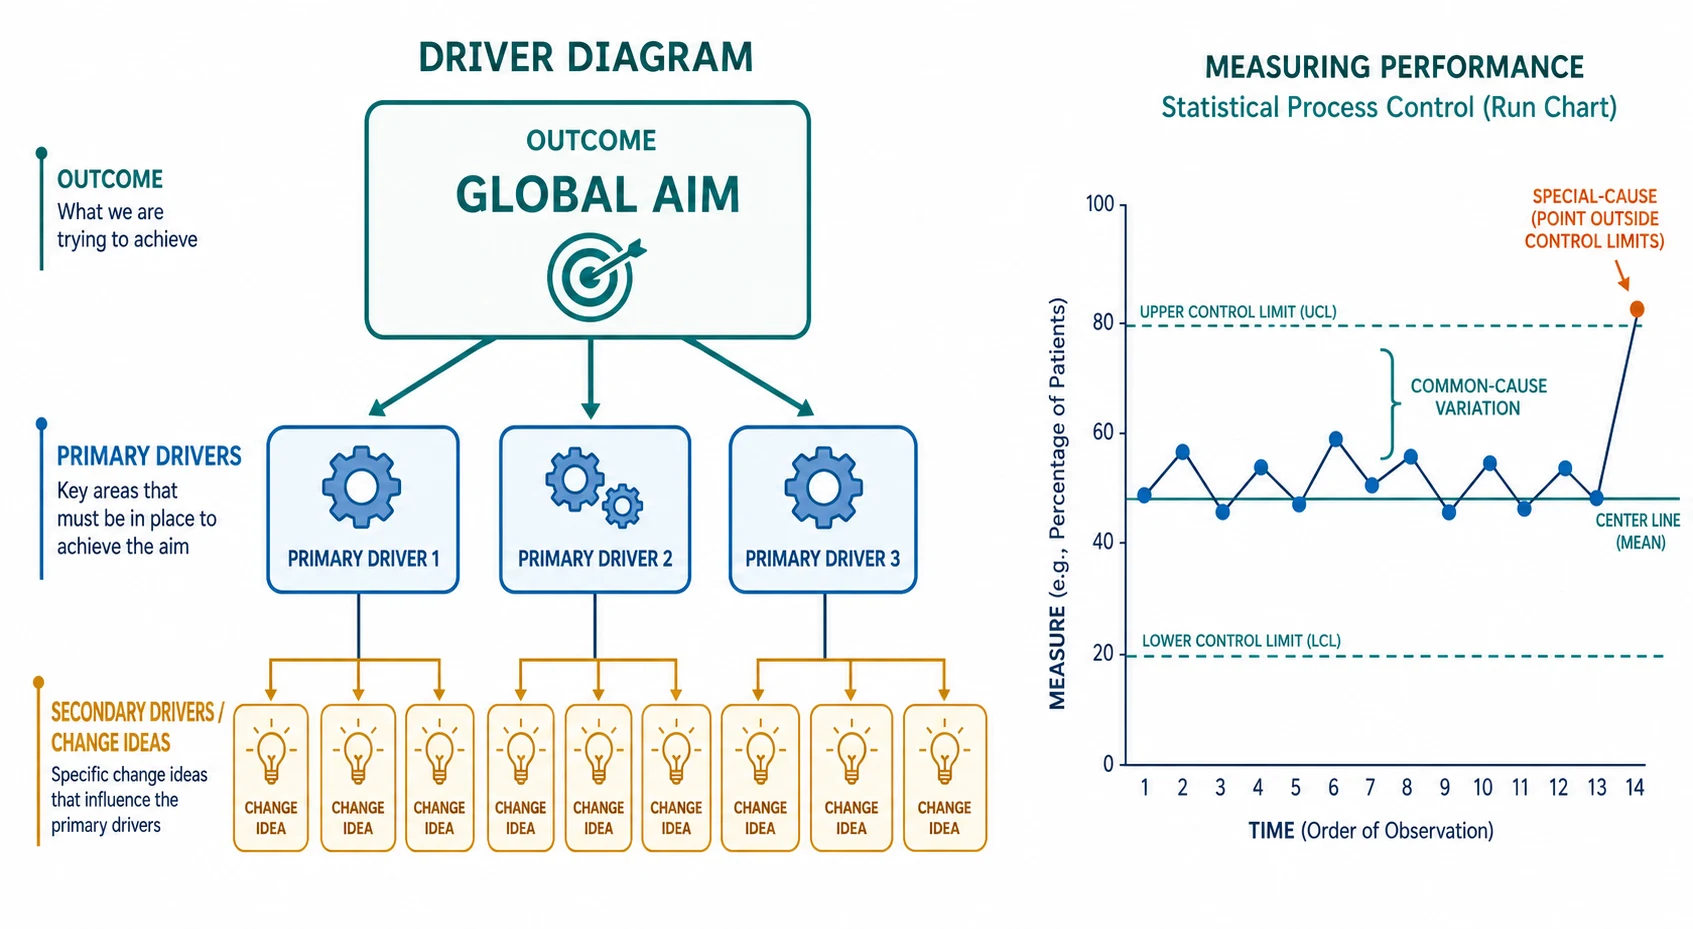
Variation is the pathophysiology of measurement. A run chart plots data over time against a median. Common-cause variation is the noise inherent in the process — chasing it makes things worse. Special-cause variation is a signal that something genuinely changed — a sustained shift, a trend, a run, or an astronomical outlier. The discipline is to detect special cause and not react to common cause. The systematic review by Thor established how statistical process control is applied to do exactly this across healthcare settings. [9]
Clinical Presentation
A quality problem announces itself in several ways. A child is harmed and the analysis shows a recurring system gap. An audit shows a care process is inconsistent. A complaint arrives. A clinician notices that outcomes differ from a benchmark. The presentation is rarely "please run a PDSA cycle" — it is a signal that something in the system is not reliable. [8]
A poorly-run QI project also has a recognisable presentation. There is no written aim. The team measures whether the change was done (process) but never whether it helped (outcome). A new protocol is launched unit-wide with no test. A poster exhorts people to "be more careful". The data live on one enthusiastic registrar's laptop and die when they rotate. Recognising these failure modes is half the viva. [8]
A successful project presents differently. It has a specific, time-bound aim on a charter. It shows a run chart with a baseline, a change point, and a sustained improvement. It has a balancing measure proving no harm elsewhere. It is reported with SQUIRE so others can appraise and adopt it. [10]
Differential Diagnosis
- QI versus clinical audit. Audit measures practice against a standard at one point; QI tests changes to move practice. Audit finds the gap; QI closes it. [8]
- QI versus research. Research seeks generalisable knowledge and needs ethics oversight for human-subjects risk; QI improves local care. The boundary matters for ethics committees and publication. [8]
- QI versus innovation. Innovation invents a new intervention; QI usually adapts and tests a known change. [1]
- Outcome versus process versus balancing measure. Outcome asks "did we help?"; process asks "did we do it?"; balancing asks "did we harm elsewhere?"
- Common-cause versus special-cause variation. Common cause lives within limits; special cause breaks a rule. [9]
- Run chart versus Shewhart control chart. A run chart uses a median; a control chart adds calculated upper and lower limits for tighter special-cause detection. [9]
- Model for Improvement versus Lean versus Six Sigma. Choose by the problem: testing ideas (Model), removing waste (Lean), reducing defects (Six Sigma). [1]
- Improvement versus regression to the mean. A single before-after gap may revert; only time-series data protect you. [8]
Clinical & Bedside Assessment
Before launching anything, assess whether the problem is amenable to a QI approach. Is there a measurable process or outcome? Is the gap actionable at the front line? Is there a senior sponsor who will protect the team's time? If the answer to any is no, you are looking at a problem that needs different work first. [1] [8]
Walk the team through forming the aim. A good aim is specific, measurable and time-bound: "Reduce the proportion of neonates receiving antibiotics beyond 48 hours without a proven infection from 40% to 20% on our unit within 6 months." Vague aims — "improve antibiotic use" — produce vague projects. Name the population, the metric, the target and the deadline. [8]
Choose the measure you can collect reliably. The best measure is the one the team will actually gather consistently: numerator, denominator, data source and frequency defined. In a small unit, sampling a few cases a week beats a perfect measure that nobody has time to collect. Engage families and children as partners — a family-reported outcome often reveals what a clinical metric hides. [13]
Assess local context and readiness. Does the unit have the data, the staffing and the culture to sustain a change? Walk the ward and observe whether a bundle is actually being followed before you try to improve it. A change that ignores the local workflow will not sustain no matter how good the evidence. [8] [11]
Investigations
In QI, "investigations" means building the measurement system. The balanced measure set has three families. The outcome measure answers whether children are better off (e.g. central-line infection rate). The process measure answers whether the team is doing the thing believed to cause improvement (e.g. proportion of lines inserted with full bundle compliance). The balancing measure answers whether the change caused harm elsewhere (e.g. line occlusion rate after a new dressing protocol). Missing the balancing measure is a classic viva trap. [1]
Operationalise each measure precisely: numerator, denominator, inclusion and exclusion, data source, who collects it, how often. Vague measures produce noise. Audit data quality the way you audit clinical data — completeness, accuracy, timeliness. [9]
Build and read a run chart. Plot the measure over time. Draw the median of the baseline phase. Then apply the standard rules for special cause. A shift is six or more consecutive points on one side of the median. A trend is five or more points all rising or all falling. A run is five or more consecutive identical values (off the median). An astronomical point is an obvious outlier no one would call normal. Any one of these is special-cause variation — a signal that the system changed. Points that wander without breaking a rule are common cause. [9]
A Shewhart control chart adds calculated upper and lower control limits (a centre line plus or minus three standard deviations) for tighter detection. Thor's systematic review established how these charts are applied across healthcare to distinguish signal from noise. The cardinal rule: do not chase common-cause variation; investigate special cause. [9]
Management — Resuscitation
- Define the problem and the safety case. State why this gap matters for children now. [2]
- Secure a sponsor and protected time. A project with no senior owner dies. [1]
- Form the multidisciplinary team. Include nursing, pharmacy, a family partner and a data person — not only doctors. [4]
- Establish a reliable baseline. You cannot claim improvement without a baseline run chart. [9]
- Write a specific, time-bound aim. Population, metric, target, deadline. [8]
- Choose a balancing measure from day one. Watch for harm elsewhere before it surprises you. [1]
Management — Definitive & Stepwise
The Model for Improvement runs on three questions and a cycle. First, what are we trying to accomplish? — the aim. Second, how will we know a change is an improvement? — the measures. Third, what change can we test? — the ideas. Then you run PDSA: Plan the test (who, what, where, when, what data), Do it, Study the result against prediction, and Act — adopt, adapt, or abandon. [1] [2]
Build the driver diagram to organise change ideas under primary drivers. Test changes in sequence: start small (one patient, one shift), then scale to a unit, then to several units. Move from testing to implementation only when a change reliably produces improvement, then standardise it into policy, order sets and education. [8]
Sustainability is planned, not hoped for. Assign an owner, keep the data flowing, and build a simple audit so gains do not decay when the champion rotates. Spread a successful change to other units or hospitals, and report it using SQUIRE so others can appraise and adopt it. The SQUIRE standards exist precisely because too many QI reports cannot be evaluated or reproduced. [10]
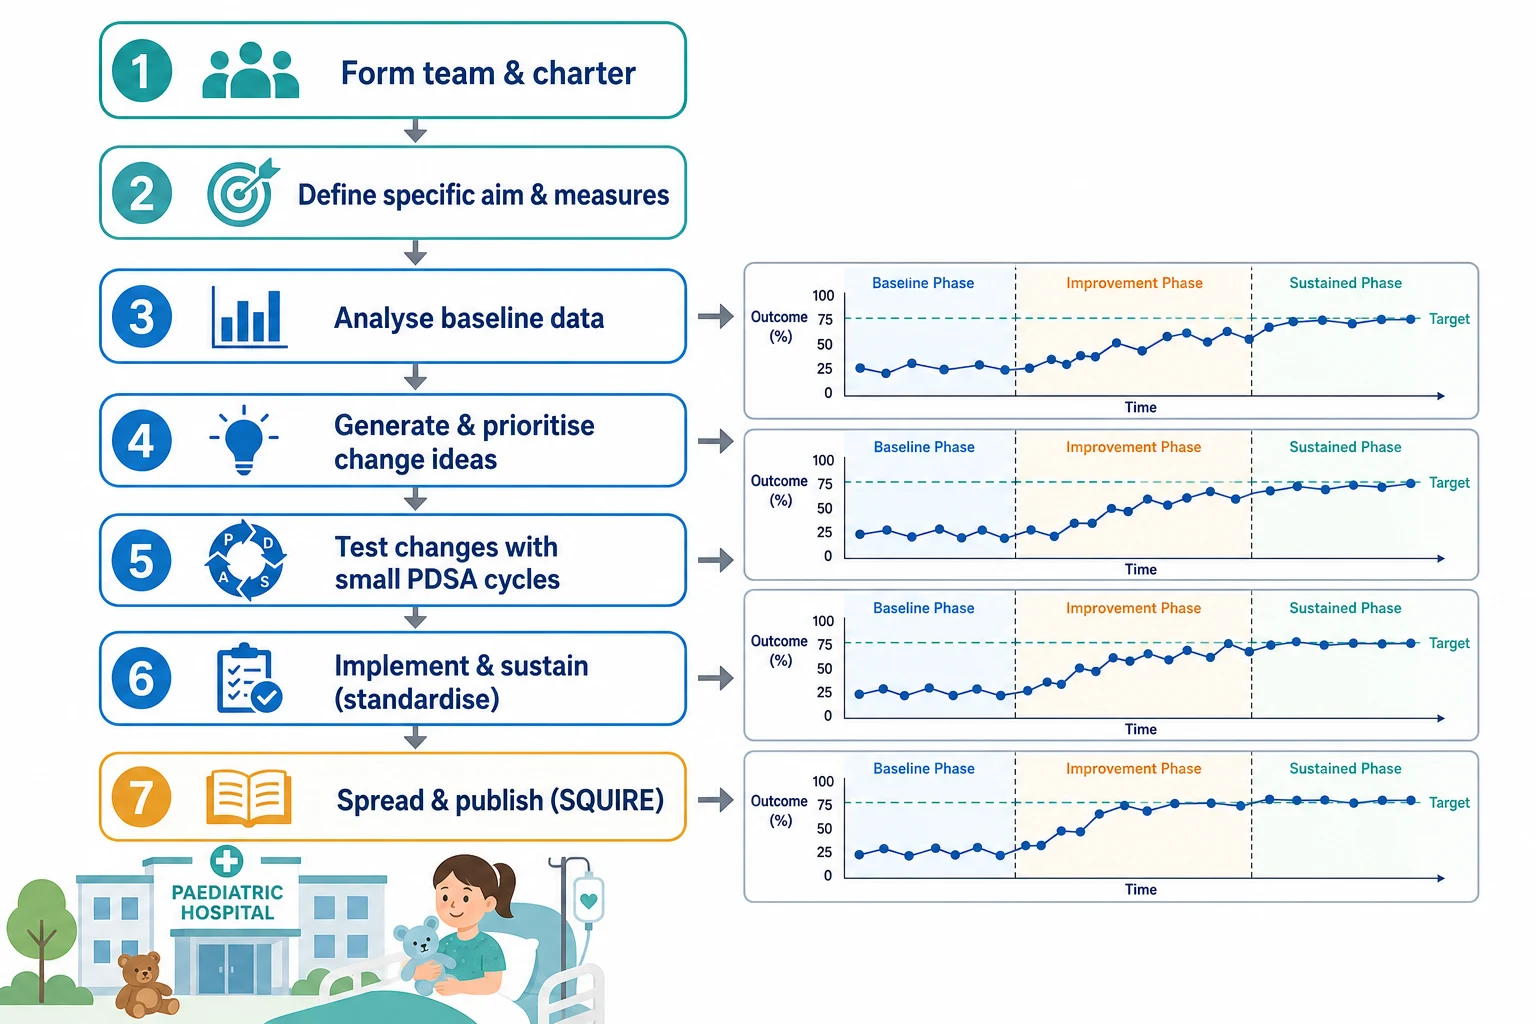
Running a QI project — practical sequence
Form the team and write a charter with a sponsor
Define a specific, measurable, time-bound aim
Build the balanced measure set and baseline run chart
Generate and prioritise change ideas in a driver diagram
Test ideas with small PDSA cycles, scaling what works
Implement, standardise, sustain and spread; report with SQUIRE
Specific Subtypes & Scenarios
Neonatal network collaborative. The Vermont Oxford Network NIC/Q projects are the paediatric exemplar of the collaborative model. Many neonatal units learn together over months, sharing data and methods, to improve outcomes such as infection and surfactant timing. Horbar showed that multi-centre collaboratives can move neonatal outcomes, and Rogowski showed the economic case for doing so. [4] [5] [6]
Central-line bloodstream infection bundle. Pronovost's landmark work showed that a standardised five-element bundle, spread across many ICUs, dramatically reduced catheter-related bloodstream infections. The lesson is portable: standardise a known-effective process and measure relentlessly. [11]
Paediatric rapid response team. Sharek demonstrated that a hospital-wide rapid response team in a children's hospital was associated with reduced mortality and code rates outside the ICU — a QI intervention measured at the system level. [7]
Structured handoff. Starmer's I-PASS work showed that a standardised handoff programme reduced medical errors across nine North American training programmes — communication redesign as an improvement lever. [12]
Antibiotic stewardship in newborns. The Dukhovny multicentre QI initiative showed collaboratives can reduce unnecessary antibiotic exposure in newborns — a stewardship aim that protects every infant exposed. [13]
Small or rural unit. Low volumes make run-chart interpretation hard and rare-event measurement noisy. The remedy is longer time series, sharing data across sites, and telehealth-enabled collaboration. [9]
Equity-focused QI. Disaggregate your data. If the average improves but an Indigenous or disadvantaged subgroup does not, the project has widened a gap. Make equity an explicit aim and measure, not an afterthought. [3]
Complications & Pitfalls
- Confusing QI with research and triggering unnecessary ethics delay — or, worse, running a risky change with no oversight. [8]
- No clear aim: a project that drifts and never finishes. [8]
- Measuring process but not outcome: "we did the change" without "did it help".
- Reacting to common-cause variation as if it were special cause. [9]
- Attributing improvement to the intervention when it is regression to the mean or a secular trend. [8]
- No balancing measure: improvement in one area silently harming another. [1]
- Big-bang rollout without small PDSA testing.
- No sustainability plan: gains decay when the champion leaves.
- Publication bias: only positive QI projects are shared, so others repeat avoidable failures. [10]
- Equity blind spot: the average improves while a disadvantaged subgroup does not. [3]
Prognosis & Disposition
A QI intervention sustains when four things hold: leadership ownership, continuing data, embedded standard work, and a culture that expects improvement. When any one weakens, gains decay. A project is "done" when the aim is met and sustained over time, and the balancing measures are safe — not when the team presents at a conference. [1] [8]
When a project shows no improvement, the discipline is to learn, not to hide. Examine the theory (was the driver diagram right?), the execution (was the change actually done?), the measurement (was the data reliable?), and the context (was the unit ready?). Re-aim, re-test, or abandon honestly. [8]
Spread and scale follow local success. The collaborative model exists to accelerate this. Reporting with SQUIRE lets other teams appraise whether your improvement is worth adopting and how to adapt it to their context. [10]
Special Populations
Neonates benefit most from network collaboratives because single-centre volumes are too small; family-integrated care adds a family-centred measure. Children with medical complexity concentrate risk through polypharmacy, devices and fragmented teams. Indigenous children need equity-focused, culturally safe aims and measures, not aggregate averages that hide gaps. Rural and remote children face low volumes where run charts need longer series and shared data. Migrant and refugee families need interpreter-dependent data collection. Adolescents raise confidentiality-sensitive and transition quality measures. Children with disability and neurodiversity need accessible processes and family-reported outcomes. [3] [5] [13]
Evidence, Guidelines & Regional Differences
The evidence base is real but carries caveats the viva expects. Berwick's foundational writing established improvement as a system we lead. The Triple Aim set the strategic horizon. Horbar and the Vermont Oxford Network proved multi-centre neonatal collaboratives can move outcomes. Pronovost's central-line bundle is the most cited example of standardised measurement reducing harm. Sharek and Starmer showed system-level interventions reduce mortality and errors in children. [1] [2] [3] [5] [7] [11] [12]
The methods literature is more cautious. Taylor's systematic review found that PDSA is widely used but often poorly applied — underpowered, undocumented, or misclassified. Thor's review of statistical process control showed how SPC is used but flagged inconsistency. Both tell you to be a critical consumer of QI evidence: before-after designs are weak, regression to the mean and secular trends confound, and sustainability is rarely measured. [8] [9]
Apply local QI frameworks from the Australian Commission on Safety and Quality in Health Care and the Health Quality & Safety Commission (Aotearoa New Zealand). Cite the principle of standardised, measurable, sustained improvement rather than inventing local mandated targets. [1]
Controversies: how much QI needs research-grade ethics oversight; whether collaboratives genuinely cause improvement or ride secular trends; how to publish negative QI so others learn. Answer with principles and honest caveats, not slogans. [8] [10]
Exam Pearls
- Model for Improvement = three questions (aim, measure, change) plus PDSA. [1]
- PDSA: Plan, Do, Study, Act — test small, scale fast, fail safe. [2]
- Driver diagram: global aim to primary drivers to change ideas. [8]
- Measures: outcome (did we help?), process (did we do it?), balancing (did we harm?). [1]
- Run-chart special cause: shift (6+ one side of median), trend (5+ up or down), run (5+ identical off median), astronomical point. [9]
- Common cause lives within limits; special cause breaks a rule — do not chase noise. [9]
- Triple Aim: better care, better health, lower cost; Quintuple Aim adds equity and clinician well-being. [3]
- SQUIRE = Standards for QUality Improvement Reporting Excellence. [10]
- Before-after designs are weak; regression to the mean and secular trends confound. [8]
- Sustainability needs ownership, data and audit — a poster alone does not sustain.
References
- [1]Berwick DM A primer on leading the improvement of systems. BMJ, 1996.PMID 8595340
- [2]Berwick DM Developing and testing changes in delivery of care. Annals of internal medicine, 1998.PMID 9537939
- [3]Berwick DM, Nolan TW, Whittington J The triple aim: care, health, and cost. Health affairs (Project Hope), 2008.PMID 18474969
- [4]Kilo CM Improving care through collaboration. Pediatrics, 1999.PMID 9917480
- [5]Horbar JD, Rogowski J, Plsek PE, Delmore P Collaborative quality improvement for neonatal intensive care. NIC/Q Project Investigators of the Vermont Oxford Network. Pediatrics, 2001.PMID 11134428
- [6]Rogowski JA, Horbar JD, Plsek PE, Baker LS Economic implications of neonatal intensive care unit collaborative quality improvement. Pediatrics, 2001.PMID 11134429
- [7]Sharek PJ, Parast LM, Leong K, Coombs J Effect of a rapid response team on hospital-wide mortality and code rates outside the ICU in a Children's Hospital. JAMA, 2007.PMID 18029830
- [8]Taylor MJ, McNicholas C, Nicolay C, Darzi A Systematic review of the application of the plan-do-study-act method to improve quality in healthcare. BMJ quality & safety, 2014.PMID 24025320
- [9]Thor J, Lundberg J, Ask J, Olsson J Application of statistical process control in healthcare improvement: systematic review. Quality & safety in health care, 2007.PMID 17913782
- [10]Ogrinc G, Armstrong GE, Dolansky MA, Singh MK SQUIRE-EDU (Standards for QUality Improvement Reporting Excellence in Education): Publication Guidelines for Educational Improvement. Academic medicine, 2019.PMID 30998575
- [11]Pronovost P, Needham D, Berenholtz S, Sinopoli D An intervention to decrease catheter-related bloodstream infections in the ICU. The New England journal of medicine, 2006.PMID 17192537
- [12]Starmer AJ, Spector ND, Srivastava R, West DC Changes in medical errors after implementation of a handoff program. The New England journal of medicine, 2014.PMID 25372088
- [13]Dukhovny D, Buus-Frank ME, Edwards EM, Ho T A Collaborative Multicenter QI Initiative to Improve Antibiotic Stewardship in Newborns. Pediatrics, 2019.PMID 31676682