Phys · general-medicine
Evidence-Based Medicine and Critical Appraisal
Also known as evidence-based medicine · EBM · critical appraisal · CASP · CONSORT · STROBE · PRISMA · QUADAS-2 · GRADE · PICO · number needed to treat · NNT · number needed to harm · NNH · absolute risk reduction · ARR · relative risk · odds ratio · confidence interval · intention-to-treat · forest plot · I-squared · heterogeneity · publication bias · funnel plot · Type I error · Type II error · statistical power · hierarchy of evidence · external validity · internal validity
Consultant-physician-depth guide to evidence-based medicine and critical appraisal for FRACP DWE and DCE — the Sackett definition of EBM (integration of best research evidence, clinical expertise and patient values), the hierarchy of evidence (case reports through to systematic reviews and meta-analyses), the study designs (cross-sectional for prevalence, case-control for rare diseases reporting odds ratios and prone to recall bias, cohort for common diseases reporting relative risk and establishing temporality, RCT as the gold standard for therapy with randomisation, allocation concealment, blinding and intention-to-treat analysis), the critical-appraisal frameworks (CASP checklists, CONSORT for RCTs, STROBE for observational studies, PRISMA for systematic reviews, QUADAS-2 for diagnostic accuracy), the PICO framework, effect sizes (relative risk, odds ratio, absolute risk reduction, NNT, NNH), confidence intervals (95 per cent CI, crossing 1 for a ratio means non-significant), p-values and the distinction between statistical and clinical significance, Type I and Type II errors and power, intention-to-treat versus per-protocol analysis, subgroup analyses and the hazard of multiple comparisons, the bias types (selection, information or recall, publication detected by funnel plot, confounding, lead-time, length-time, spectrum), internal versus external validity, forest plots and meta-analysis with I-squared heterogeneity and fixed versus random effects, applying evidence to the individual patient, and the GRADE system for guideline development (high, moderate, low, very low quality; strong versus weak recommendations).
On this page & tools
Your progress
Saved locally on this device.
Practise this topic
Target exams
Red flags
Evidence-Based Medicine and Critical Appraisal

The answer first
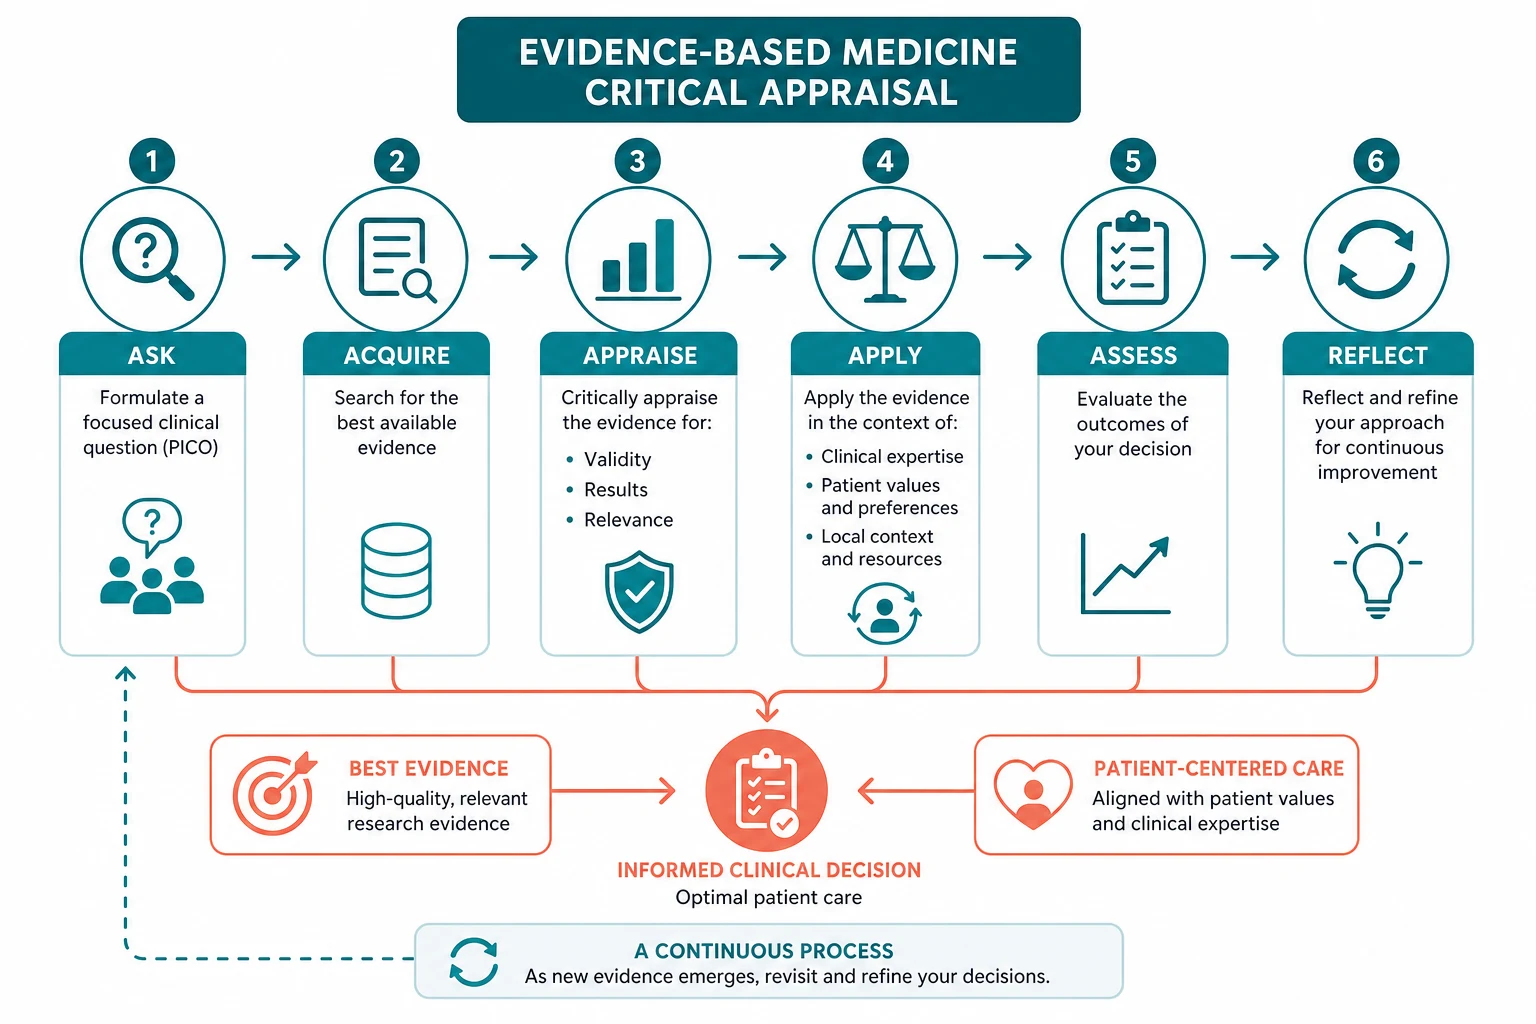
Evidence-based medicine is the structured reasoning a physician applies when deciding whether to act on a piece of evidence. Sackett defined it as the conscientious, explicit and judicious use of current best evidence in making decisions about individual patients, integrating three components: the best research evidence (from patient-centred clinical research, especially randomised controlled trials and systematic reviews), the clinician's individual clinical expertise (the proficiency and judgement acquired through experience), and the patient's values and preferences (their unique predicaments, rights and expectations) [1]. EBM is explicitly not a cookbook that ignores clinical judgement, and not a cost-cutting device that ignores patient preference.
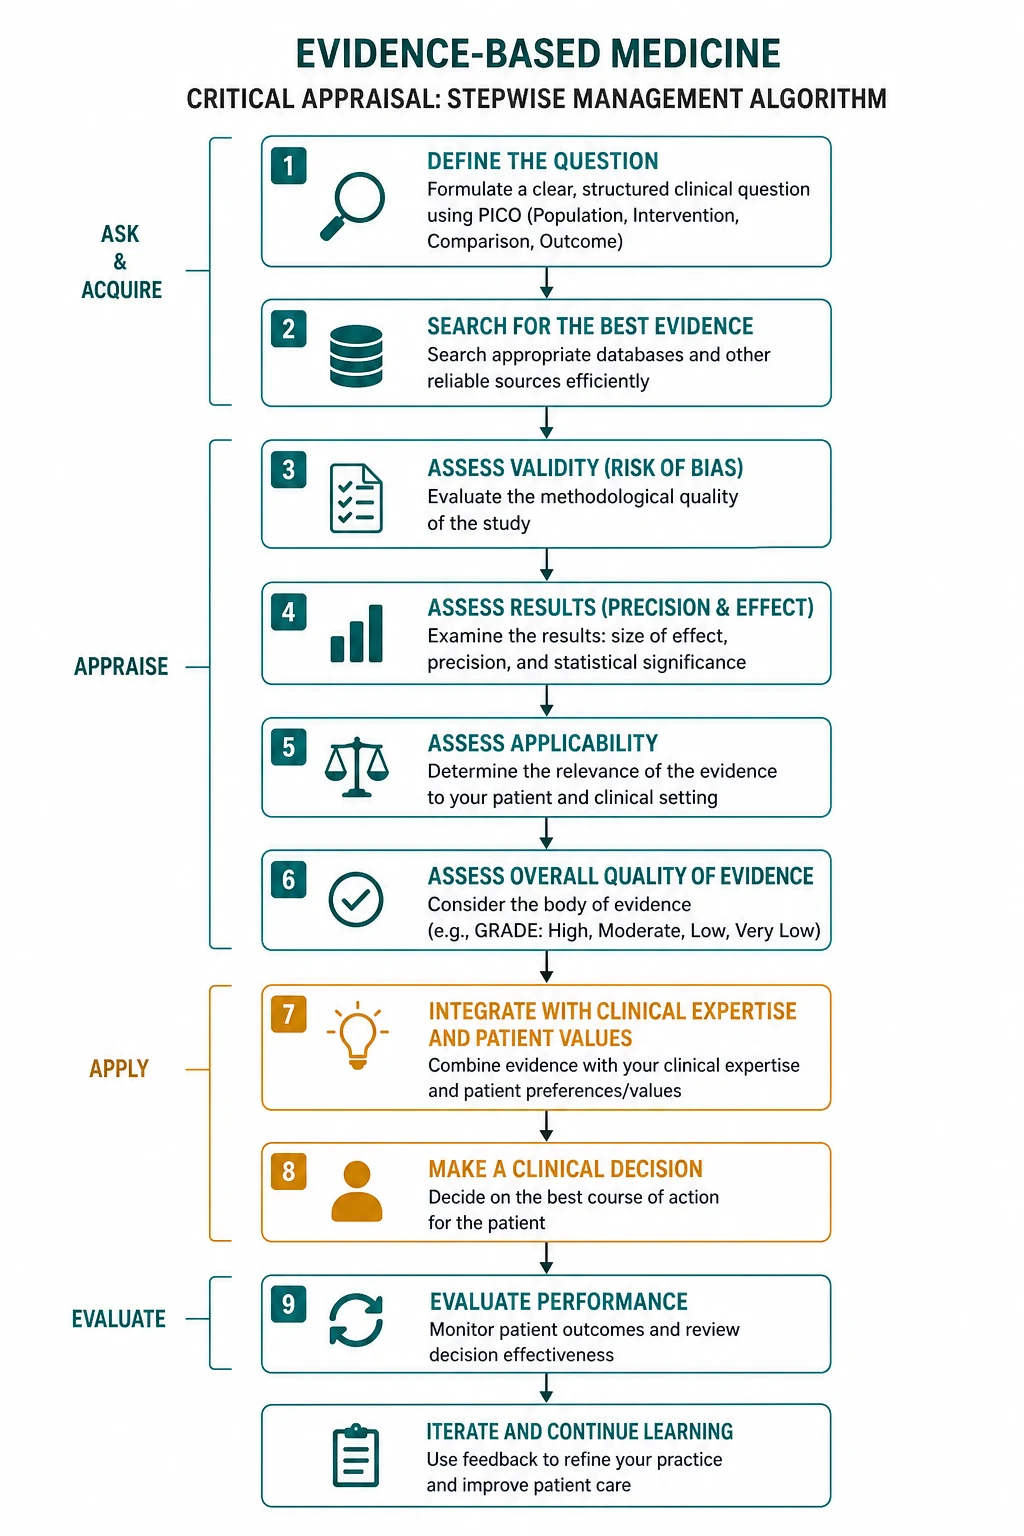
The five-step EBM process is ask, acquire, appraise, apply, assess. You ask a focused question using PICO (Population, Intervention, Comparator, Outcome). You acquire the best evidence by searching the literature efficiently, matching the study type to the question (therapy — RCT; harm — cohort or case-control; prognosis — cohort; diagnosis — cross-sectional study with a reference standard). You appraise the evidence for validity (are the methods free of bias), importance (is the effect size large enough to matter) and applicability (does the result apply to my patient). You apply the evidence by integrating it with your clinical expertise and the patient's values. You assess the outcome and feed the learning back into the next decision. [1]
The two most examinable skills beneath the definition are critical appraisal (the structured assessment of a study's validity, results and applicability using named checklists — CASP for each study type, CONSORT for RCT reporting, STROBE for observational studies, PRISMA for systematic reviews, QUADAS-2 for diagnostic accuracy) and the interpretation of effect sizes and their uncertainty (the relative risk, odds ratio, absolute risk reduction, number needed to treat, confidence interval and p-value). [1]
DWE high-yield: The single most tested concept is that statistical significance is not clinical significance — a large trial can find a statistically significant but clinically trivial difference, and the confidence interval, not the p-value, tells you the precision of the estimate. The second is that a confidence interval crossing 1 for a ratio measure (RR, OR, HR) means the result is not statistically significant, however impressive the point estimate. The third is that the relative risk reduction can be misleading in a low-risk patient — always compute the absolute risk reduction and the NNT for the patient's own baseline risk. [1]
1. What evidence-based medicine is, and what it is not

EBM was articulated in 1996 in response to two misconceptions: that EBM was a dangerous innovation that ignored clinical judgement, and that it was old hat [1]. Sackett and colleagues insisted that EBM is the integration of evidence and expertise, never the substitution of evidence for expertise. External clinical evidence can inform, but never replace, individual clinical judgement, and any guidance that ignores the patient's values is not EBM. The phrase to carry into the exam is that EBM is a triangulation of three streams: the research, the clinician, and the patient.
Why the definition matters clinically
A registrar who applies a trial result to a patient without judging applicability is practising algorithm-driven medicine, not EBM. A consultant who dismisses the trial because "my patient is different" without quantifying how different is practising eminence-based medicine, not EBM. The discipline of EBM is to do both — to extract the best estimate of effect from the evidence, and then to adjust it explicitly for the patient in front of you, naming the uncertainty and sharing the decision. [1]
Registrar teaching point: EBM does not say "do what the trial says". It says "use the trial to inform your estimate of the effect, then use your judgement to adjust that estimate for this patient, then use the conversation to align the decision with the patient's values". The trial is one input; it is never the whole decision. [1]
2. The hierarchy of evidence
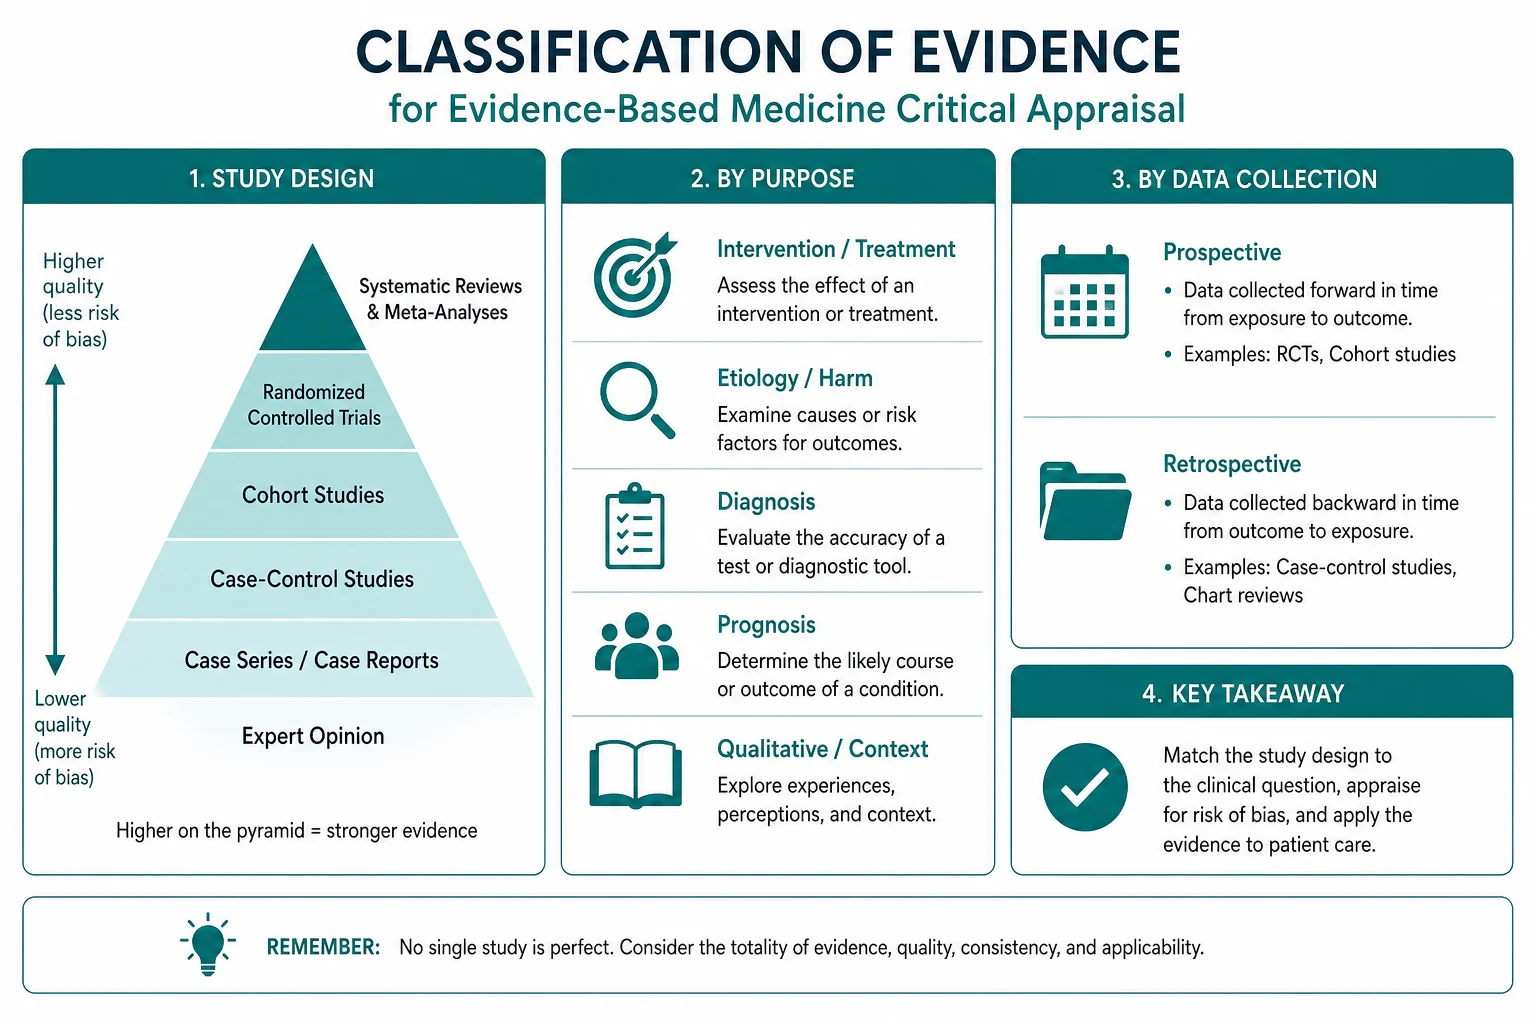
The hierarchy ranks study designs by their resistance to bias when inferring causation. At the base is expert opinion and mechanistic reasoning, then case reports and case series (which generate hypotheses but cannot test them), then the analytical observational designs, then randomised controlled trials, and at the apex the systematic review and meta-analysis. [1]
| Level | Study type | What it best answers | Principal measure |
|---|---|---|---|
| Weakest | Expert opinion, mechanistic reasoning | — | — |
| Case report, case series | Frequency of a rare presentation | — | |
| Cross-sectional study | Prevalence, point-in-time association | Prevalence, OR | |
| Case-control study | Rare disease, rare exposure | Odds ratio | |
| Cohort study | Common disease, temporality, prognosis | Relative risk | |
| Randomised controlled trial | Therapy, harm (efficacy) | RRR, ARR, NNT | |
| Strongest | Systematic review and meta-analysis | Synthesis of all eligible evidence | Pooled estimate |
The hierarchy is a guide, not a rule. A single, large, well-conducted RCT can outweigh a meta-analysis of small, biased trials (garbage in, garbage out). A well-conducted meta-analysis of all relevant RCTs is, however, the most precise and least biased estimate of an effect available. [1]
Why randomisation is the cornerstone
Randomisation balances both known and unknown confounders between the intervention and control groups at baseline. Because the groups are, in expectation, prognostically identical at the start, any difference in outcome is attributable to the intervention rather than to a pre-existing difference. This is the property that observational designs cannot replicate — however sophisticated the statistical adjustment, residual confounding can never be fully excluded. That is why the RCT is the gold standard for therapy. [1]
The protection randomisation gives is destroyed if allocation is not concealed. If the clinician enrolling the patient can see the next assignment (an open sequence, or a sealed but translucent envelope), they can steer sicker or more suitable patients into one arm, and the prognostic balance is lost. Allocation concealment (the assignment is hidden until the patient is irreversibly enrolled) is therefore as important as randomisation itself, and is one of the first items on the CASP and CONSORT checklists [3].
3. Study designs — when to use each, and what each measures
Cross-sectional study
A cross-sectional study takes a snapshot of a defined population at one time point and measures the proportion with the condition (the prevalence) and the association between an exposure and the condition. It cannot establish temporality (you do not know whether the exposure preceded the disease) and so cannot establish causation. Its strength is efficiency: a single survey answers the prevalence question. It is also the appropriate design for diagnostic accuracy when the index test and the reference standard are applied to the same consecutive patients at the same time. [1]
Case-control study
A case-control study compares people with the outcome (the cases) to people without (the controls) and looks back at the exposure. It is efficient for rare diseases (where a cohort would need to be enormous to capture enough cases) and for rare exposures with a long latency. It yields an odds ratio — the ratio of the odds of exposure in the cases to the odds of exposure in the controls. Its two characteristic biases are recall bias (cases, knowing they are ill, search harder for past exposures and remember them differently from controls) and selection bias (the controls must come from the same source population as the cases, or the comparison is invalid). The odds ratio approximates the relative risk only when the outcome is rare (the rare-disease assumption, below about 10 per cent prevalence); for common outcomes the odds ratio overestimates the relative risk and can mislead. [1]
Cohort study
A cohort study follows a defined population forward in time, comparing those exposed to those unexposed, and measures the incidence of the outcome in each group. It yields a relative risk (the risk in the exposed divided by the risk in the unexposed) and, because exposure is measured before outcome, it establishes temporality. It is the strongest observational design for harm (where an RCT would be unethical — smoking, asbestos, a drug suspected of causing harm) and for prognosis. Its principal weakness is residual confounding: however carefully you measure and adjust for confounders, an unmeasured or imperfectly measured factor can leave a spurious association. This is why a well-conducted RCT is superior for therapy, and why observational associations should be interpreted with the Bradford Hill criteria (strength, consistency, temporality, biological gradient, plausibility, coherence, experiment, analogy) in mind. [1]
Randomised controlled trial
The RCT assigns participants to intervention or control by chance, controlling for confounders, and measures the effect on predefined outcomes. The quality features that the examiner expects you to name are: randomisation with an unpredictable sequence; allocation concealment (the assignment is hidden until the patient is enrolled); blinding of the participant, the clinician and the outcome assessor (especially important when the outcome is subjective — pain, functional status); complete follow-up (every randomised patient is accounted for, and loss to follow-up is minimised and reported); and intention-to-treat analysis (every patient is analysed in the group to which they were randomised, regardless of adherence) [8]. RCTs are reported according to the CONSORT 2010 statement — a 25-item checklist and a participant-flow diagram [3].
Systematic review and meta-analysis
A systematic review is a structured, reproducible synthesis of all eligible studies using a pre-specified protocol (the question, the search, the eligibility criteria, the quality assessment and the synthesis plan are all declared in advance). A meta-analysis pools the results statistically to increase precision and power. The quality of a systematic review depends on the underlying studies (garbage in, garbage out), on the completeness of the search (publication bias), on the heterogeneity of the included studies, and on the choice of fixed-effects versus random-effects model. Systematic reviews are reported according to the PRISMA statement — a 27-item checklist and a four-phase flow diagram (identification, screening, eligibility, inclusion) [4].
4. The PICO framework — ask a focused question
A focused clinical question has four elements: the Population (the patient and their defining features — age, sex, the condition, the comorbidities that matter), the Intervention (the diagnostic test or treatment under consideration), the Comparator (the current standard of care or an alternative), and the Outcome (the patient-centred endpoint that matters — mortality, morbidity, quality of life, not a surrogate). The framework was articulated by Richardson and colleagues at McMaster and published in ACP Journal Club in 1995, and it is the foundation of the "ask" step of the EBM process. [1]
A precise PICO makes the question answerable and the search tractable. An unfocused question ("is this drug good for heart failure?") yields an unsearchable literature and an uninterpretable answer. A focused question ("in a 75-year-old woman with heart failure with reduced ejection fraction and stage 3 chronic kidney disease, does sacubitril-valsartan compared with enalapril reduce the composite of cardiovascular death or heart-failure hospitalisation over a median of 27 months?") maps directly to a search strategy, to the eligibility criteria of a systematic review, and to the applicability judgement for an individual patient. [1]
DWE discriminator: When a stem asks "what is the best next investigation" or "what is the correct management", the distractors often differ in the population, the intervention or the outcome. The PICO framework is the way to identify which option actually answers the question being asked. [1]
5. Effect sizes — what the numbers mean
Relative risk and relative risk reduction
The relative risk (RR) is the risk of the outcome in the intervention group divided by the risk in the control group. The relative risk reduction (RRR) is one minus the RR, expressed as a proportionate reduction. A 50 per cent RRR sounds impressive, but it is a proportion of the baseline risk — if the baseline risk is 2 per cent, the absolute reduction is 1 per cent, and the number needed to treat is 100. RRR is the figure favoured by pharmaceutical marketing because it is always larger and more impressive than the absolute figure; it is the figure most likely to mislead. [1]
Absolute risk reduction and number needed to treat
The absolute risk reduction (ARR) is the absolute difference in risk between the control and intervention groups (control risk minus intervention risk). The number needed to treat (NNT) is one divided by the ARR (expressed as a decimal) — the number of patients who must be treated for one to benefit. The NNT is the most clinically intuitive measure of absolute benefit, because it tells you directly how much treatment you must deliver to achieve one good outcome, and it allows a direct comparison with the number needed to harm (NNH). [1]
Registrar teaching point: Always recompute the NNT for your patient's baseline risk, not the trial's average baseline risk. A trial may report an NNT of 30, but if your patient's baseline risk is half the trial's, your patient's NNT is 60; if their baseline risk is double, their NNT is 15. The NNT is not a property of the drug; it is a property of the drug in a patient with a defined baseline risk. [1]
Number needed to harm
The number needed to harm (NNH) is one divided by the absolute risk increase for an adverse outcome — the number of patients who must be treated for one to be harmed. Reporting the NNT alongside the NNH allows the clinician and the patient to weigh benefit against harm directly. A drug with an NNT of 50 for stroke prevention and an NNH of 20 for major bleeding is a very different proposition from one with an NNT of 50 and an NNH of 500, even though the relative risk reduction is the same. [1]
Odds ratio and the rare-disease assumption
The odds ratio (OR) is the ratio of the odds of the outcome in the two groups. It is the measure produced by case-control studies (because the cases are selected by outcome, the risk cannot be computed) and by logistic regression. The OR approximates the RR only when the outcome is rare (below about 10 per cent); for common outcomes the OR overestimates the RR, sometimes substantially, and this is the basis of the rare-disease assumption. The exam trap is to report an OR as if it were an RR for a common outcome, overstating the effect. [1]
6. Confidence intervals and p-values
The confidence interval
The 95 per cent confidence interval is the range of values that, with repeated sampling, would contain the true population effect 95 per cent of the time. It conveys both the point estimate (the best single guess of the true effect) and the precision of that estimate (a narrow interval means a precise estimate, a wide interval means the study was underpowered). For a ratio measure (RR, OR, HR), the result is not statistically significant at the 5 per cent level if the CI crosses 1 (the null, no effect). For a difference (a mean or a risk difference), the null is 0, and the result is non-significant if the CI crosses 0. [1]
The CI is preferred to the bare p-value because it answers two questions at once (what is the effect, and how sure are we) and because it discourages the dichotomous thinking that the p-value encourages. A narrow CI close to the null is a precise estimate of a small effect; a wide CI that includes a clinically important effect and a null effect is an underpowered study that does not answer the question. [1]
The p-value
The p-value is the probability of observing the data (or data more extreme) if the null hypothesis of no effect were true. By convention, a p-value below 0.05 is deemed statistically significant. The p-value tests the null hypothesis; it does not measure the size of the effect, the importance of the effect, or the probability that the result is true. A very large trial can produce a very small p-value for a clinically trivial effect; a small trial can fail to reach significance for a clinically important effect. [1]
DWE high-yield: The single most tested distinction is between statistical significance and clinical significance. A statistically significant result (p below 0.05, or a CI excluding the null) is one the data are unlikely to have produced by chance; a clinically significant result is one large enough to matter to a patient. The two are independent. A trial can be statistically significant and clinically trivial, or clinically important and statistically non-significant. The answer to "is this result important?" is found in the effect size and the confidence interval, never in the p-value alone. [1]
Type I and Type II errors, and power
A Type I error (alpha) is the false positive — finding a difference when none exists. It is conventionally set at 5 per cent. A Type II error (beta) is the false negative — failing to find a true difference. It is conventionally set at 20 per cent. Power is one minus beta — the probability of detecting a true effect of a given size — and is conventionally 80 per cent. A negative trial with low power does not prove there is no effect; it proves only that the study was too small to detect it. This is why the confidence interval is essential: a wide CI that includes a clinically important effect means the study was underpowered, and the absence of statistical significance is not evidence of absence. [1]
7. Intention-to-treat versus per-protocol analysis

Intention-to-treat (ITT) analysis analyses every patient in the group to which they were randomised, regardless of adherence, withdrawal or crossover. It preserves the prognostic balance created by randomisation, and it gives a pragmatic estimate — the effect of the treatment as it is actually used, with all the imperfect adherence of real life. The primary analysis of a superiority trial should be ITT [8].
Per-protocol (PP) analysis analyses only the patients who adhered to the protocol — those who took the treatment as prescribed, completed the follow-up and did not cross over. It gives an explanatory estimate — the effect of the treatment under ideal conditions — but it breaks the randomisation, because the patients who adhere are prognostically different from those who do not. PP analysis can therefore introduce bias. [1]
The interaction between the analysis type and the trial design matters. In a superiority trial, ITT is the primary analysis because it is the most conservative (imperfect adherence dilutes any true effect toward the null, so a significant ITT result is robust). In a non-inferiority trial, the logic reverses: imperfect adherence dilutes the difference between the treatments and biases the result toward non-inferiority, so ITT can be anti-conservative, and a per-protocol analysis is required as a sensitivity check. This is a high-yield exam point: the appropriate primary analysis depends on whether the trial is testing superiority or non-inferiority. [1]
8. Subgroup analyses and the hazard of multiple comparisons
A subgroup analysis compares the treatment effect within subgroups of the trial population (men versus women, old versus young, severe versus mild disease). Subgroup analyses are hypothesis-generating, not hypothesis-confirming. The reason is the multiple-comparisons problem: with enough subgroups, some will appear to differ by chance alone, and the more subgroups you test, the more likely you are to find a spurious difference. The classic example is the ISIS-2 trial, in which aspirin reduced mortality after myocardial infarction overall but appeared, in a subgroup analysis, to be harmful in patients born under the Gemini or Libra star signs — a finding that is biologically meaningless and a perfect illustration of the hazard. [1]
A subgroup finding is credible only if it meets all of the following: it was pre-specified (declared before the data were examined, not dredged post-hoc); it is biologically plausible (there is a mechanism that would explain the difference); it is supported by a statistically significant interaction test (the test of whether the treatment effect differs between subgroups, not just whether the effect is significant in one subgroup); and it has been replicated in independent studies. Most subgroup findings presented in papers fail most of these tests, and the response of the critical appraiser is to treat them as suggestions for further research, not as a basis for changing practice. [1]
9. Bias — the named types you must recognise
Selection bias
Systematic differences between the groups being compared. In an RCT, it arises from failures of randomisation or allocation concealment (the clinician steers sicker patients into one arm). In an observational study, it arises from differential recruitment or differential loss to follow-up. It is minimised by proper randomisation with allocation concealment and by complete follow-up. [1]
Information (recall) bias
Systematic differences in the accuracy of the information collected from the two groups. Recall bias is the classic form in case-control studies: the cases, knowing they are ill, search harder for past exposures and remember them differently from the controls. It is minimised by objective exposure data (records, biomarkers) and by blinding the interviewer to the case-control status. [1]
Publication bias
The preferential publication of positive studies, because journals, investigators and sponsors are more motivated to publish a positive result. The result is an inflated pooled estimate in a meta-analysis, because the negative studies that would have pulled the estimate toward the null are missing. It is detected by funnel-plot asymmetry (the small studies, which are most subject to publication bias, show larger effects than the large studies, which get published regardless) and by formal tests (Egger, Begg). It is addressed by searching trial registries for unpublished data and by including the grey literature. [1]
Confounding
A third variable is associated with both the exposure and the outcome, producing a spurious association. It is the defining weakness of observational designs. It is addressed by randomisation (in RCTs), by restriction and matching (in case-control studies), by stratification and multivariable adjustment (in cohort studies), and by advanced methods (propensity scoring, instrumental variables, Mendelian randomisation). Residual confounding — the confounding that remains after adjustment — can never be fully excluded from an observational study. [1]
Lead-time and length-time bias
These biases arise in screening. Lead-time bias is the apparent survival benefit from screening that is in fact only the earlier detection — the patient lives with the diagnosis for longer but dies at the same time. Length-time bias is the over-representation of slow-growing, indolent disease in a screened population (because the slow tumours spend longer in the detectable pre-clinical phase), which makes screening appear to improve survival when it has merely preferentially detected the better-prognosis cases. Both biases are why screening efficacy is judged by mortality reduction in an RCT, not by survival in observational data. [1]
Spectrum bias
A diagnostic test appears more accurate than it really is because the study population does not represent the spectrum of disease in clinical practice — it includes only severe cases (easy to detect) and healthy controls (easy to exclude), omitting the mild and the ambiguous cases in whom the test is actually needed. It is a form of spectrum effect assessed in the patient-selection domain of QUADAS-2 [5].
10. Internal versus external validity
Internal validity asks: are the results correct for the study population? It is a property of the methods — was the randomisation adequate, was the allocation concealed, was the blinding maintained, was the follow-up complete, was the analysis intention-to-treat? A study can be internally valid and externally invalid (the results are true for the study population, but the study population does not resemble my patient). [1]
External validity (generalisability) asks: do the results apply to other populations, including my patient? It is a property of the population, the setting, the intervention and the outcome — were the patients like mine, was the setting like mine, was the intervention delivered as I would deliver it, was the outcome the one my patient cares about? Pivotal drug trials routinely exclude the elderly, the renally and hepatically impaired, the pregnant, and those with multiple comorbidities, so the trial's relative effect may not apply to the patient on your ward. The judgement of applicability is the final section of every CASP checklist, and it is the bridge between the trial and the bedside. [1]
11. The critical-appraisal frameworks
CASP — the Critical Appraisal Skills Programme
The CASP checklists (published by the Oxford-based programme at casp-uk.net) are the bedside tools for appraising a single study. Each checklist has three sections: are the results valid (screening questions on the design — randomisation, allocation concealment, blinding, follow-up, ITT for an RCT); what are the results (the effect size, the confidence interval, the NNT); and will the results help my patients (applicability, all clinically important outcomes, the trade-off between benefit and harm). The checklists exist for each study type — RCT, systematic review, cohort, case-control, diagnostic test, qualitative study — and the framework is the one the examiner expects you to apply. [1]
CONSORT — reporting randomised trials
The CONSORT 2010 statement is a 25-item checklist and a participant-flow diagram for reporting randomised trials [3]. It covers the title and abstract, the methods (randomisation sequence generation, allocation concealment, blinding, outcomes, sample size), the results (recruitment, baseline, numbers analysed, harms) and the discussion (limitations, generalisability, registration). The aim is transparent reporting so the reader can assess the internal and external validity. CONSORT is a reporting standard, not an appraisal tool, but the items it requires are the items the appraiser examines.
STROBE — reporting observational studies
The STROBE statement is a 22-item checklist for reporting cohort, case-control and cross-sectional studies [6]. It covers the study design, the setting, the participants, the variables, the data sources, the bias, the study size, the statistical methods, the participant flow, the descriptive and outcome data, the main results, the limitations and the generalisability. The aim is transparent reporting so the reader can assess the risk of confounding, selection bias and information bias.
PRISMA — reporting systematic reviews
The PRISMA statement is a 27-item checklist and a four-phase flow diagram for reporting systematic reviews and meta-analyses [4]. It covers the focused question, the search, the selection, the quality assessment, the synthesis (heterogeneity, meta-analysis), the funding and the limitations. The flow diagram documents the number of records identified, screened, eligible and included, which exposes selective inclusion and makes the review reproducible.
QUADAS-2 — appraising diagnostic accuracy studies
The QUADAS-2 tool assesses the risk of bias and the applicability of a diagnostic accuracy study across four domains — patient selection, index test, reference standard, and flow and timing [5]. Each domain is judged for risk of bias (was it done well?) using signalling questions, and the first three are also judged for applicability (does it answer my question?). It is the Cochrane standard for diagnostic test accuracy reviews, and it separates the question of internal validity from the question of generalisability.
12. Forest plots and meta-analysis interpretation

A forest plot is the graphical summary of a meta-analysis. Each row is one study. The square is the study's point estimate (the size of the square is proportional to the study's weight in the pooled analysis — larger, more precise studies weigh more). The horizontal line through the square is the study's 95 per cent confidence interval. The vertical line at 1 (for a ratio) or 0 (for a difference) is the line of no effect. The diamond at the bottom is the pooled estimate, with its width representing the 95 per cent confidence interval of the pooled result. If the diamond does not cross the line of no effect, the pooled result is statistically significant at the 5 per cent level. [1]
The interpretation to the examiner, in order, is: read the title and the outcome being summarised; confirm the scale (is the measure an RR, OR, HR, or a risk difference, and on which side does benefit lie); read each study's point estimate and CI; note the weight of each study; read the pooled diamond and its CI; and read the heterogeneity statistic (I-squared and the test for heterogeneity). [1]
Heterogeneity — I-squared
The I-squared statistic quantifies the proportion of the variability in the effect estimates that is due to heterogeneity rather than to chance [7]. It is expressed as a percentage. Conventionally, 0 to 25 per cent is low, 25 to 50 per cent is moderate, and above 50 per cent is substantial heterogeneity. High I-squared means the studies are too different to pool uncritically — the pooled estimate may be misleading, and the sources of the heterogeneity (clinical — different populations, interventions, outcomes; or methodological — different study quality) should be explored by subgroup and sensitivity analysis. The I-squared is preferred to the older Cochran Q test because it is not dependent on the number of studies.
Fixed-effects versus random-effects models
A fixed-effects model assumes that all the studies estimate the same true effect, and that the differences between them are due to sampling error alone; it pools the studies as if they were one large study. A random-effects model assumes that the true effect varies from study to study (because of clinical or methodological differences), and it pools the studies allowing for this between-study variance; it gives a wider confidence interval and is more conservative. The choice depends on the heterogeneity: if the studies are homogeneous, a fixed-effects model is appropriate; if they are heterogeneous, a random-effects model is more honest, but it does not eliminate the heterogeneity — it merely accounts for it in the estimate. The exam trap is to accept a random-effects pooled estimate as if it resolved the heterogeneity; it does not. [1]
13. Applying evidence to the individual patient
The application step is where EBM meets the bedside. Four questions structure it. First, is my patient so different from the study population that the results cannot apply? Compare the patient's age, sex, comorbidities, disease severity and the setting to the trial's eligibility criteria; if the patient would have been excluded, judge whether the biological rationale for the exclusion is strong (in which case be cautious) or administrative (in which case extrapolate). Second, what is the absolute risk reduction for my patient's baseline risk? Recompute the NNT and the NNH using the patient's own baseline risk, not the trial's average. Third, what are my patient's values and preferences? Some patients value the avoidance of a stroke above all else; others value the avoidance of a bleeding event; some are averse to taking tablets; some want everything possible done. Fourth, what is the trade-off between the benefit, the harm and the burden? Present the absolute numbers in plain language, share the decision, and document the reasoning. [1]
Registrar teaching point: The trial gives you the relative effect (the RRR is fairly stable across populations); the patient gives you the baseline risk (which varies enormously); the ARR and the NNT are the product of the two. A drug with a consistent 30 per cent RRR across populations will have an NNT of 25 in a high-risk patient (baseline risk 12 per cent) and an NNT of 250 in a low-risk patient (baseline risk 1.2 per cent). The same drug, the same RRR, a ten-fold difference in clinical impact. This is why the ARR and the NNT, computed for the patient, are the bridge between the trial and the bedside. [1]
14. The GRADE system for guideline development
The GRADE system (Grading of Recommendations Assessment, Development and Evaluation) is the global standard for rating the quality of evidence and the strength of recommendations [2]. It was articulated by the GRADE Working Group in 2008 and is adopted by the WHO, the Cochrane Collaboration, NICE and most specialty societies.
Quality of evidence
GRADE rates the quality of the evidence on a four-point scale: high, moderate, low, very low. Randomised trial evidence starts at high; observational evidence starts at low. The rating is then adjusted down or up. Evidence is downgraded for: risk of bias (the studies have methodological flaws); inconsistency (the studies disagree, high I-squared); indirectness (the population, the intervention, the comparator or the outcome does not quite match the question); imprecision (the confidence interval is wide, the estimate uncertain); and publication bias (funnel-plot asymmetry). Evidence is upgraded (from observational) for: a large effect (so large that confounding is unlikely to explain it); a dose-response gradient; and plausible residual confounding that would reduce the observed effect (so the true effect is likely larger than observed). [1]
Strength of recommendation
GRADE rates the strength of a recommendation as strong or weak. A strong recommendation means the desirable effects clearly outweigh the undesirable effects (or vice versa), and it applies to most patients in most circumstances — the clinician can offer it as the default. A weak recommendation means the balance is close, the evidence is uncertain, or the patient's values are likely to vary — the clinician should present the options and share the decision. The strength is determined by four factors: the quality of the evidence, the magnitude of the benefit-harm trade-off, the certainty about the patient's values, and the resource use. [1]
DWE discriminator: A strong recommendation on high-quality evidence is a robust basis for practice; a strong recommendation on low-quality evidence is a red flag (the panel is overriding the evidence with expert opinion); a weak recommendation on any quality of evidence invites shared decision-making. Read the GRADE table, not just the recommendation, before you change your practice. [1]
15. Communication — presenting evidence to a patient and a colleague
Communicating risk to a patient
Use natural frequencies (one in a hundred) rather than percentages or relative risks. State the chance of the outcome without treatment, the chance with treatment, the absolute difference (the ARR) and the NNT, and the chance of the principal harm and the NNH. Present the quality of the evidence in plain terms (we are very sure of this, or this is uncertain), and the strength of the recommendation (most people in your situation would choose this, or this is a close call and the choice is yours). Invite the patient to weigh the benefit, the harm and the burden, and share the decision. [1]
Presenting an appraisal in a journal club or a viva
State the focused PICO question. Summarise the search (databases, terms, results). Present the study design and the methods (randomisation, allocation concealment, blinding, follow-up, analysis). Report the results (the effect size, the confidence interval, the NNT, the harms). Apply the relevant checklist (CASP, CONSORT, STROBE, PRISMA, QUADAS-2), naming the risk of bias and the applicability. State the bottom line in one sentence: does the study answer the question, how confident are we in the answer, and does it apply to my patient? [1]
Explaining a confidence interval in plain terms
The point estimate is the best single guess of the true effect. The confidence interval is the range of plausible true effects given the data. A narrow interval means the study was large and the estimate is precise; a wide interval means the study was small and the estimate is uncertain. For a ratio, if the interval crosses 1, the study cannot exclude no effect — the result is not statistically significant, however impressive the point estimate. [1]
16. Common exam traps and high-yield discriminators
Statistical versus clinical significance. A large trial can find a statistically significant but clinically trivial difference. The p-value and the significance of the CI test the null hypothesis; the effect size and the confidence interval test the importance. The answer to "does this matter?" is in the effect size, never in the p-value alone. [1]
Relative versus absolute risk reduction. The RRR is a proportion of the baseline risk and overstates benefit in low-risk patients. The ARR and the NNT are the absolute measures, and the NNT must be recomputed for the patient's baseline risk. The RRR is the figure the marketing department uses; the NNT is the figure the clinician uses. [1]
The confidence interval crossing 1. For a ratio measure, a 95 per cent CI crossing 1 means the result is not statistically significant at the 5 per cent level. Read the CI, not just the point estimate or the p-value. [1]
The post-hoc subgroup analysis. Unplanned subgroup analyses are hypothesis-generating only. A subgroup finding is credible only if pre-specified, biologically plausible, supported by a significant interaction test and replicated. Treat a post-hoc subgroup as a suggestion, not a conclusion. [1]
Intention-to-treat in a non-inferiority trial. In a superiority trial, ITT is conservative. In a non-inferiority trial, ITT can be anti-conservative (imperfect adherence dilutes the difference and biases toward non-inferiority); a per-protocol sensitivity analysis is required. [1]
Heterogeneity in a meta-analysis. High I-squared means the studies are too different to pool uncritically. Explore the sources, and do not accept a random-effects pooled estimate as if it resolved the heterogeneity. [1]
Applicability. A patient who would have been excluded from the trial may not share the trial's relative effect. Judge external validity explicitly, and adjust the estimate with clinical expertise. [1]
The hierarchy. A meta-analysis of poor trials is not better than a single well-conducted trial. The hierarchy ranks designs by their resistance to bias, but a well-conducted study of any design can outweigh a poorly conducted study of a superior design. [1]
17. How this is tested
DWE MCQ
Expect stems that report an effect size and a confidence interval and ask whether the result is significant; stems that report a relative risk reduction and ask for the NNT given a baseline risk; stems that describe a study design and ask for the most appropriate measure of effect; stems that describe a subgroup finding and ask whether it is credible; stems that describe a meta-analysis with high heterogeneity and ask how to interpret it; and stems that describe a guideline recommendation and ask what a strong recommendation on low-quality evidence means. [1]
DCE long case
Expect a patient on multiple evidence-based treatments whose comorbidities would have excluded them from the pivotal trials; the task is to judge applicability for each drug, recompute the NNT and NNH for the patient's baseline risk, identify the drugs whose evidence is weak or inapplicable, and propose a deprescribing plan grounded in the evidence. See the case artifact. [1]
DCE short case and viva
Expect a journal-club-style discussion of a paper (state the PICO, summarise the methods, report the results, apply the checklist, state the bottom line) and a forest-plot or 2x2-table interpretation. The skill is to read the elements aloud, name them, and draw the conclusion in one sentence. See the viva artifact. [1]
18. Bottom line for the physician trainee
EBM is the disciplined integration of the best research evidence with clinical expertise and patient values. The hierarchy of evidence ranks designs by their resistance to bias; the RCT and the systematic review sit at the top because randomisation controls confounding and pooling increases precision. The PICO framework focuses the question; the CASP, CONSORT, STROBE, PRISMA and QUADAS-2 frameworks appraise the answer. The effect size is best expressed as the absolute risk reduction and the NNT, recomputed for the patient's baseline risk; the confidence interval conveys both the estimate and its precision; the p-value is subordinate to both. Intention-to-treat is the primary analysis of a superiority trial; per-protocol is a sensitivity check, and it is essential in a non-inferiority trial. Subgroup analyses generate hypotheses; bias is named and minimised; internal and external validity are judged separately. The GRADE system rates the quality of the evidence and the strength of the recommendation, and a strong recommendation on low-quality evidence is a red flag. The bottom line, always, is that the evidence informs but does not replace the clinician's judgement and the patient's voice. [1]
Sackett, Rosenberg, Gray, Haynes and Richardson — Evidence based medicine: what it is and what it isn't (BMJ 1996) [1]; Guyatt and the GRADE Working Group — GRADE: an emerging consensus on rating quality of evidence and strength of recommendations (BMJ 2008) [2]; Schulz, Altman, Moher and the CONSORT Group — CONSORT 2010 statement (BMJ 2010) [3]; Moher, Liberati, Tetzlaff, Altman and the PRISMA Group — PRISMA 2009 statement (PLoS Med 2009) [4]; Whiting and the QUADAS-2 Group — QUADAS-2 (Ann Intern Med 2011) [5]; von Elm and the STROBE Initiative — STROBE statement (PLoS Med 2007) [6]; Higgins, Thompson, Deeks and Altman — Measuring inconsistency in meta-analyses (BMJ 2003) [7]; Fergusson, Aaron, Guyatt and Hebert — Post-randomisation exclusions: the intention to treat principle (BMJ 2002) [8]. The CASP checklists are published by the Critical Appraisal Skills Programme (casp-uk.net). The Richardson 1995 ACP Journal Club paper on the well-built clinical question is the origin of the PICO framework. The GRADE Working Group, the EQUATOR Network, the Cochrane Collaboration and the Cochrane Handbook for Systematic Reviews of Interventions are the authoritative resources.
References
- [1]Sackett DL, Rosenberg WM, Gray JA, Haynes RB, Richardson WS Evidence based medicine: what it is and what it isn't BMJ, 1996.PMID 8555924
- [2]Guyatt GH, Oxman AD, Vist GE, Kunz R, Falck-Ytter Y, Alonso-Coello P, Schunemann HJ GRADE: an emerging consensus on rating quality of evidence and strength of recommendations BMJ, 2008.PMID 18436948
- [3]Schulz KF, Altman DG, Moher D, CONSORT Group CONSORT 2010 statement: updated guidelines for reporting parallel group randomised trials BMJ, 2010.PMID 20332509
- [4]Moher D, Liberati A, Tetzlaff J, Altman DG, PRISMA Group Preferred reporting items for systematic reviews and meta-analyses: the PRISMA statement PLoS Med, 2009.PMID 19621072
- [5]Whiting PF, Rutjes AW, Westwood ME, Mallett S, Deeks JJ, Reitsma JB, Leeflang MM, Sterne JA, Bossuyt PM, QUADAS-2 Group QUADAS-2: a revised tool for the quality assessment of diagnostic accuracy studies Ann Intern Med, 2011.PMID 22007046
- [6]von Elm E, Altman DG, Egger M, Pocock SJ, Gotzsche PC, Vandenbroucke JP, STROBE Initiative The Strengthening the Reporting of Observational Studies in Epidemiology (STROBE) statement: guidelines for reporting observational studies Lancet, 2007.PMID 18064739
- [7]Higgins JP, Thompson SG, Deeks JJ, Altman DG Measuring inconsistency in meta-analyses BMJ, 2003.PMID 12958120
- [8]Fergusson D, Aaron SD, Guyatt G, Hebert P Post-randomisation exclusions: the intention to treat principle and excluding patients from analysis BMJ, 2002.PMID 12242181