Psych · foundations
Advanced critical appraisal and EBM for psychiatry
Also known as Advanced critical appraisal · Forest plot interpretation · Heterogeneity I-squared · Publication bias funnel plot · GRADE psychiatry · Network meta-analysis · Non-inferiority trial · RoB 2 · ROBINS-I · Prediction interval · QUADAS-2
Fellowship-depth advanced critical appraisal for psychiatry: RoB 2 and ROBINS-I domains, forest-plot anatomy with prediction intervals, heterogeneity (Q, tau-squared, I-squared), publication bias and small-study effects, full GRADE certainty and recommendation workflow, network meta-analysis assumptions, non-inferiority margins, diagnostic QUADAS-2 and likelihood ratios, subgroup credibility, and psychiatry exemplars (Turner selective publication; Cipriani NMA). Distinct from the introductory critical-appraisal hub. FRANZCP-primary, globally tagged.
On this page & tools
Your progress
Saved locally on this device.
12 MCQs with explanations
Target exams
Red flags
1. Definition and classification — what “advanced” means in viva
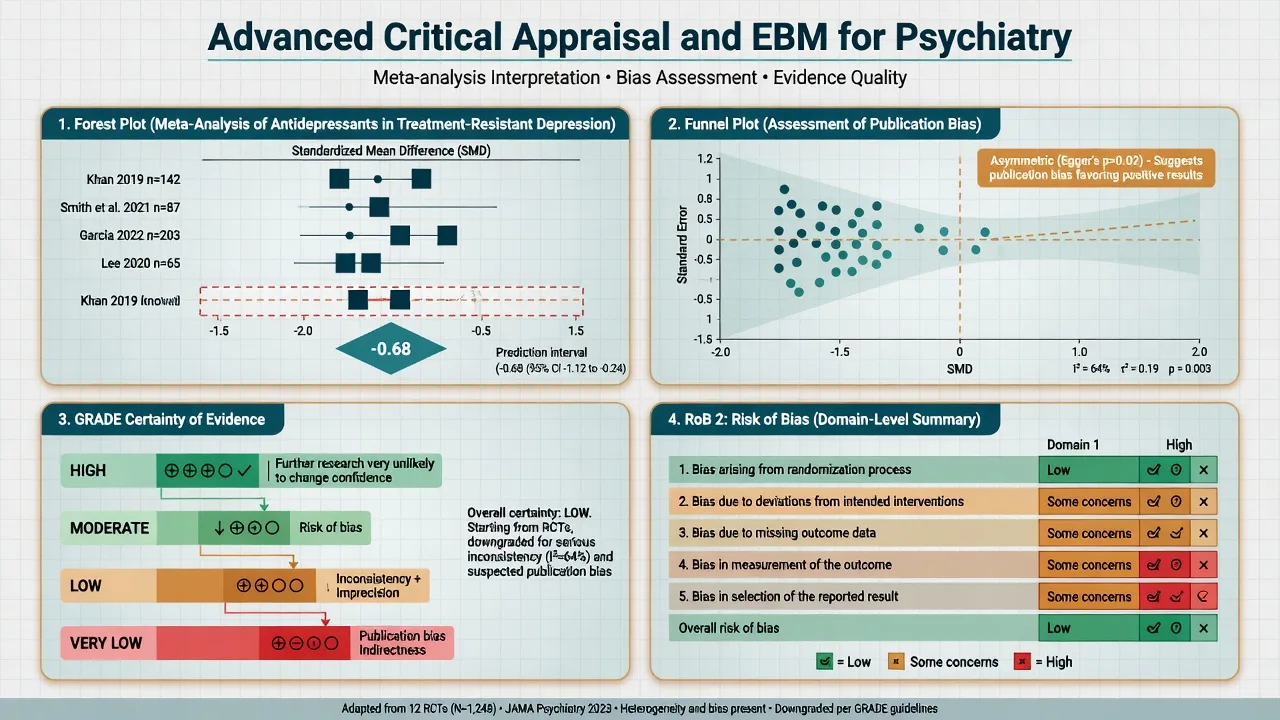
Critical appraisal (advanced) is systematic judgment of whether an estimate is trustworthy enough, precise enough, consistent enough across settings, and certain enough to support a strong or conditional practice recommendation for a defined patient group.[8][9]
| Layer | Tool / construct | Question answered |
|---|---|---|
| Single RCT bias | RoB 2 | How much could bias distort this trial’s effect?[1] |
| Observational intervention | ROBINS-I | How much could confounding and selection distort this non-randomised estimate?[2] |
| Diagnostic accuracy | QUADAS-2 | How trustworthy are Sn/Sp/LR estimates?[3] |
| Synthesis inconsistency | I-squared, tau-squared, prediction interval | Do trials estimate one effect or a spread of effects?[4][5] |
| Synthesis selection | Funnel / Egger / small-study effects | Is the published set of studies biased?[6][7] |
| Certainty + action | GRADE | How certain are we, and how strong is the recommendation?[8][10] |
Design taxonomy examiners expect. Superiority vs non-inferiority vs equivalence; pairwise fixed-effect vs random-effects meta-analysis vs NMA; parallel-group RCT vs observational comparative safety. Reporting checklists (CONSORT including non-inferiority extension; PRISMA 2020; STARD) are reporting standards — they do not replace risk-of-bias judgment.[11][12]
2. Epidemiology of error — why psychiatry literature is bias-prone
Psychiatry outcomes are often subjective rating scales, placebo responses are large, samples are modest, comorbidity is excluded, and industry programmes run multiple analyses. Flexible design plus selective publication raises the false-positive rate of the published literature.[15][14]
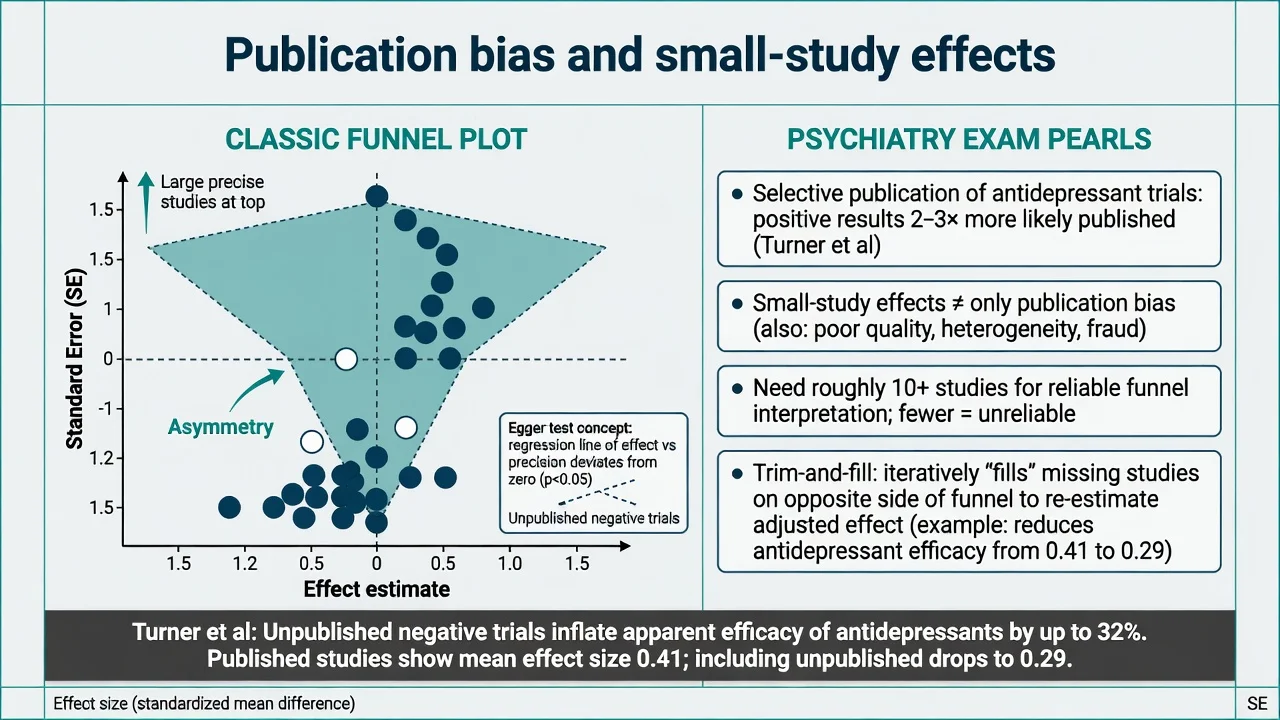
Landmark psychiatry illustration. Turner and colleagues showed that among FDA-registered antidepressant trials, unpublished negative studies and outcome reclassification inflated apparent efficacy in the published literature — the viva exemplar of publication and reporting bias for psychopharmacology.[15]
Small-study effects are the broader phenomenon: smaller trials may show larger effects because of publication bias, poorer methodology, or true clinical differences — funnel asymmetry is a composite signal, not pure proof of missing papers.[7]
3. Mechanisms — bias pathways and heterogeneity generators
RoB 2 causal domains (RCT)
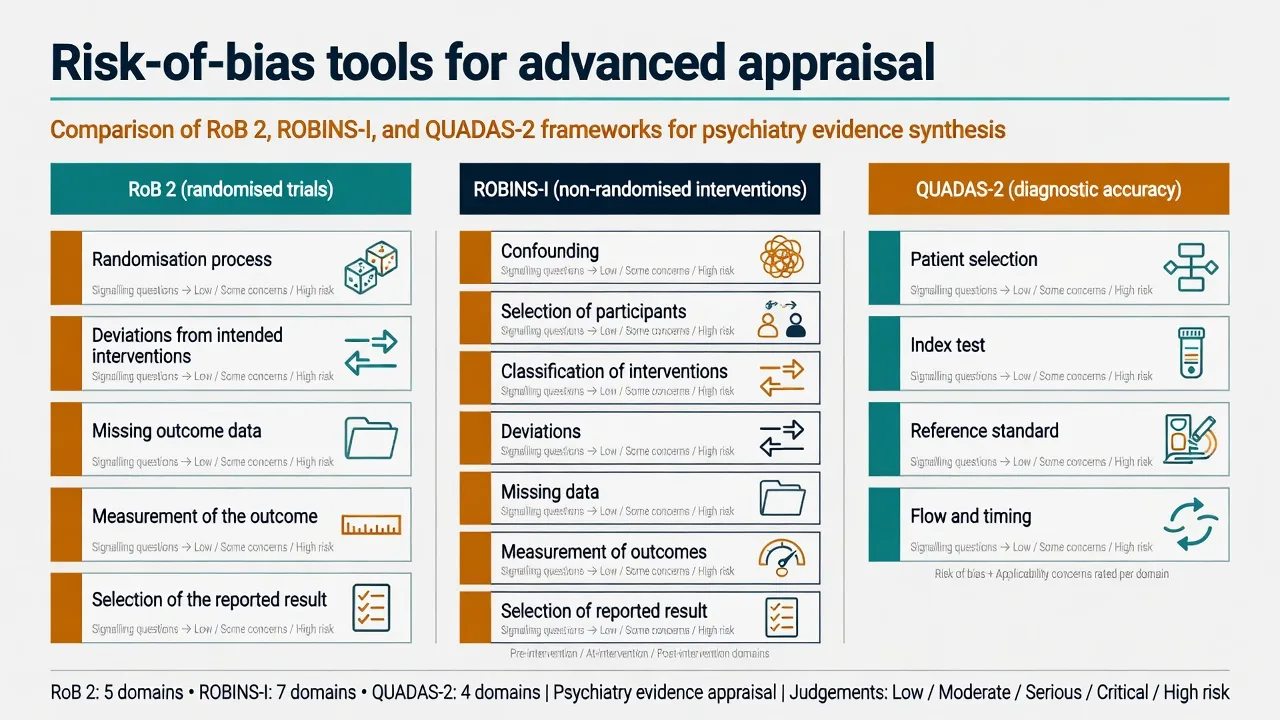
RoB 2 organises judgment into five domains: randomisation process (including concealment), deviations from intended interventions, missing outcome data, measurement of the outcome, and selection of the reported result, with an overall risk-of-bias judgment.[1]
Empirical work showed that inadequate allocation concealment and lack of double-blinding associate with exaggerated treatment effects — especially relevant when outcomes are subjective (depression scales, CGI).[19]
ROBINS-I (non-randomised interventions)
Observational comparative effectiveness/safety (for example clozapine registry analyses, antidepressant suicide signals) is appraised with ROBINS-I, which starts from the ideal target trial and rates domains including confounding, selection, classification of interventions, deviations, missing data, measurement, and selective reporting.[2]
Heterogeneity as a mixture process
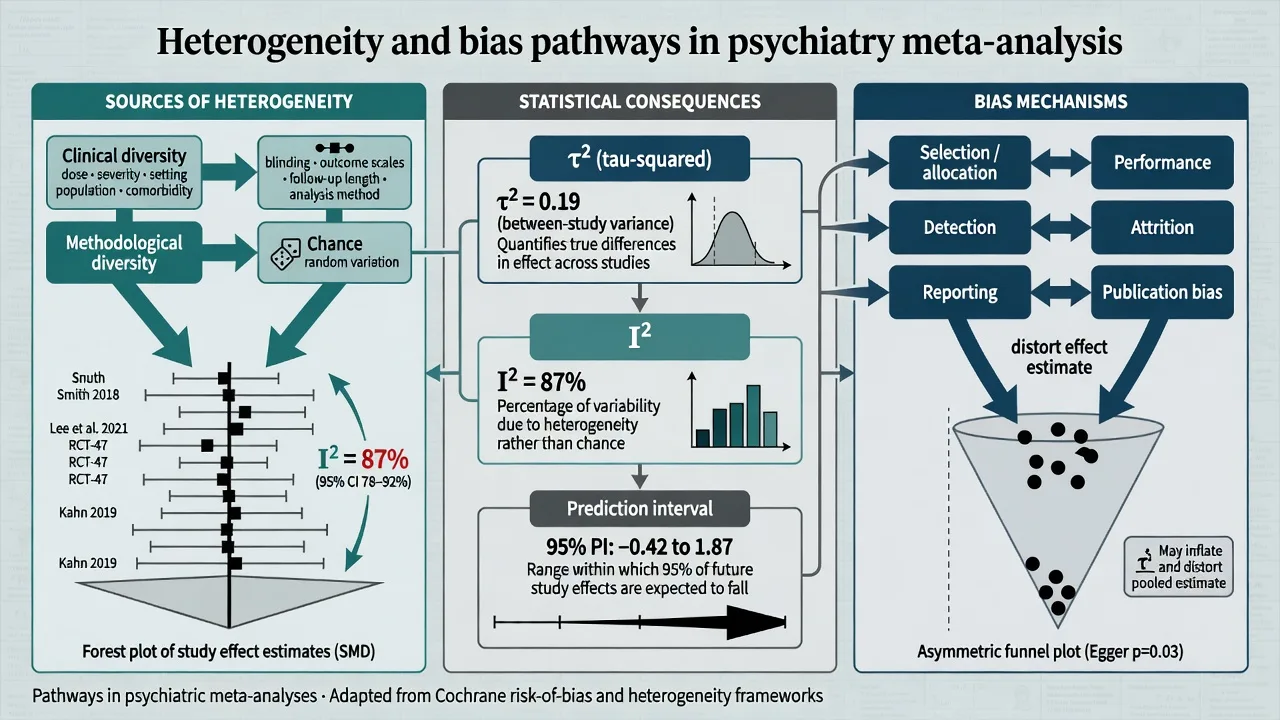
Between-study differences arise from clinical diversity (severity, dose, setting, comorbidity), methodological diversity (blinding, scales, LOCF vs MMRM), and chance. Random-effects models treat study true effects as draws from a distribution with between-study variance tau-squared; I-squared describes the proportion of total variation attributable to heterogeneity rather than sampling error.[4][5]
4. How advanced stems present in exams
Expect: a forest plot with I-squared 70%+ and a prediction interval that crosses the null while the diamond does not; a funnel plot stem; a non-inferiority CI relative to margin delta; a GRADE summary-of-findings fragment; an NMA ranking figure; or a diagnostic LR vignette. The first 30 seconds should name design, primary estimand, and the single most threatening bias.[5][12][14]
5. Differential judgments examiners reward
| Competing interpretations | Discriminator |
|---|---|
| High I-squared = “do not pool” forever | Pooling may still be informative if clinical question is shared; report prediction interval and explore causes.[4][5] |
| Funnel asymmetry = pure publication bias | Consider true heterogeneity, chance, and quality gradients; need enough studies.[7] |
| Non-significant difference = equivalence | Only a powered equivalence/NI design with pre-specified margin answers that.[12] |
| Significant interaction = actionable subgroup | Apply Sun credibility criteria; most are spurious.[17] |
6. Structured assessment checklists
Advanced RCT (map to RoB 2)
- Randomisation process: sequence generation and allocation concealment (central/IVRS preferred). Unconcealed lists inflate effects.[1][19]
- Deviations: blinding of participants/clinicians; co-interventions balanced.
- Missing outcome data: differential attrition; ITT vs completers; LOCF as a red flag for optimistic imputation.
- Measurement: rater blinding for subjective scales; validated instruments.
- Selective reporting: pre-registration; primary outcome fidelity; secondary outcomes not promoted in abstracts.
- Estimand: ITT for effectiveness/policy; per-protocol as sensitivity; concordance matters for non-inferiority.[1][12]
Systematic review / meta-analysis
Protocol/registration → exhaustive search → eligibility → RoB of included studies → synthesis model → heterogeneity exploration → publication-bias assessment → GRADE certainty → absolute effects for decision-making. PRISMA 2020 structures reporting, not quality itself.[11][14]
Diagnostic accuracy (QUADAS-2)
Domains: patient selection (spectrum), index test (blinding/threshold), reference standard, flow and timing. Spectrum bias and imperfect reference standards are classic traps for cognitive screens and depression questionnaires used as “tests”.[3]
Non-inferiority
Pre-specified margin (delta) with clinical justification; assay sensitivity (could the trial have detected inferiority if present?); analysis of ITT and per-protocol; one-sided CI entirely on the non-inferior side of delta; CONSORT non-inferiority items reported.[12]
Network meta-analysis
Network geometry (which comparisons exist); transitivity (similarity of effect modifiers across comparisons); coherence/consistency of direct and indirect evidence; contribution matrix; ranking probabilities are fragile and must not be treated as league-table truth without absolute benefits and harms.[13][14][16]
7. “Investigations” — the quantitative toolkit
Forest-plot anatomy (viva fluency)
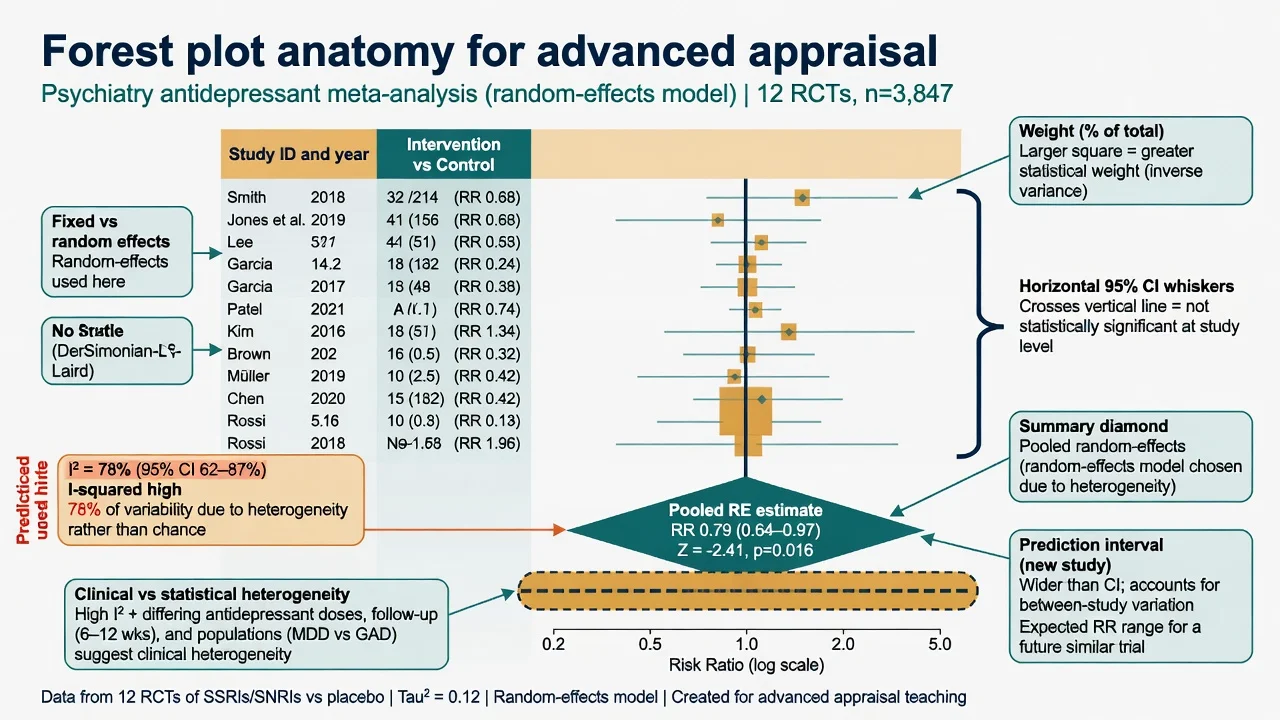
- Point estimate square sized by weight (often inverse-variance).
- Whiskers: usually 95% CI; crossing the null line ⇒ study not significant at conventional alpha.
- Diamond: pooled effect (centre) and its CI (width).
- Prediction interval: expected range for the true effect in a new similar study under random-effects — often much wider than the diamond CI when heterogeneity is present.[5]
Heterogeneity metrics
| Metric | What it is | Exam interpretation |
|---|---|---|
| Cochran Q | Weighted sum of squares test | Low power with few studies; significant Q suggests heterogeneity but non-significant Q does not prove homogeneity.[4] |
| tau-squared (τ²) | Between-study variance of true effects | Scale depends on effect measure; feeds random-effects weights.[5] |
| I-squared (I²) | % of variability due to heterogeneity rather than chance | Rough bands (context-dependent): 0–40% might be unimportant; 30–60% moderate; 50–90% substantial; 75–100% considerable.[4] |
Clinical vs statistical heterogeneity. Statistical metrics never replace clinical judgment: pooling fluoxetine 20 mg in mild primary-care depression with high-dose inpatient treatment-resistant samples is a clinical problem even if I-squared is modest.[4][14]
Publication bias and small-study effects
- Funnel plot: effect size vs precision (SE); inverted funnel expected under symmetry.
- Egger test: regression-based assessment of asymmetry.
- Sterne recommendations: interpret cautiously with fewer than ~10 studies; consider alternative explanations; do not use funnel asymmetry as a mechanical “pass/fail” quality score.[6][7]
Diagnostic metrics beyond Sn/Sp
Likelihood ratios reframe test utility independent of a single cut-point narrative: LR+ multiplies pre-test odds when positive; LR− when negative. Base-rate neglect (applying high Sn/Sp screens in low-prevalence settings) collapses PPV — examiners love this trap for dementia or depression screening stems.[3]
Meta-regression (awareness level)
Meta-regression explores study-level covariates (dose, severity, industry funding) as predictors of effect size. With few studies it overfits; treat as hypothesis-generating, not definitive interaction proof.[20]
8. Acute appraisal triage (journal club “resuscitation”)
In under a minute: (1) design and PICO; (2) primary outcome and estimand; (3) fatal flaw or not (unconcealed + unblinded subjective + selective reporting is often fatal); (4) if usable, magnitude with absolute framing and GRADE certainty language; (5) applicability caveats.[1][18]
9. Definitive synthesis — GRADE workflow for psychiatry
- Start point: RCTs start high; observational start low (typical GRADE default).[9]
- Downgrade for: risk of bias, inconsistency, indirectness, imprecision, publication bias.[9]
- Upgrade observational evidence rarely (large magnitude, dose–response, residual confounding opposing observed effect).[9]
- Rate certainty: high / moderate / low / very low.[8][9]
- Move to recommendations: balance desirable/undesirable effects, values and preferences, resources, equity, acceptability, feasibility → strong vs weak/conditional for or against.[10]
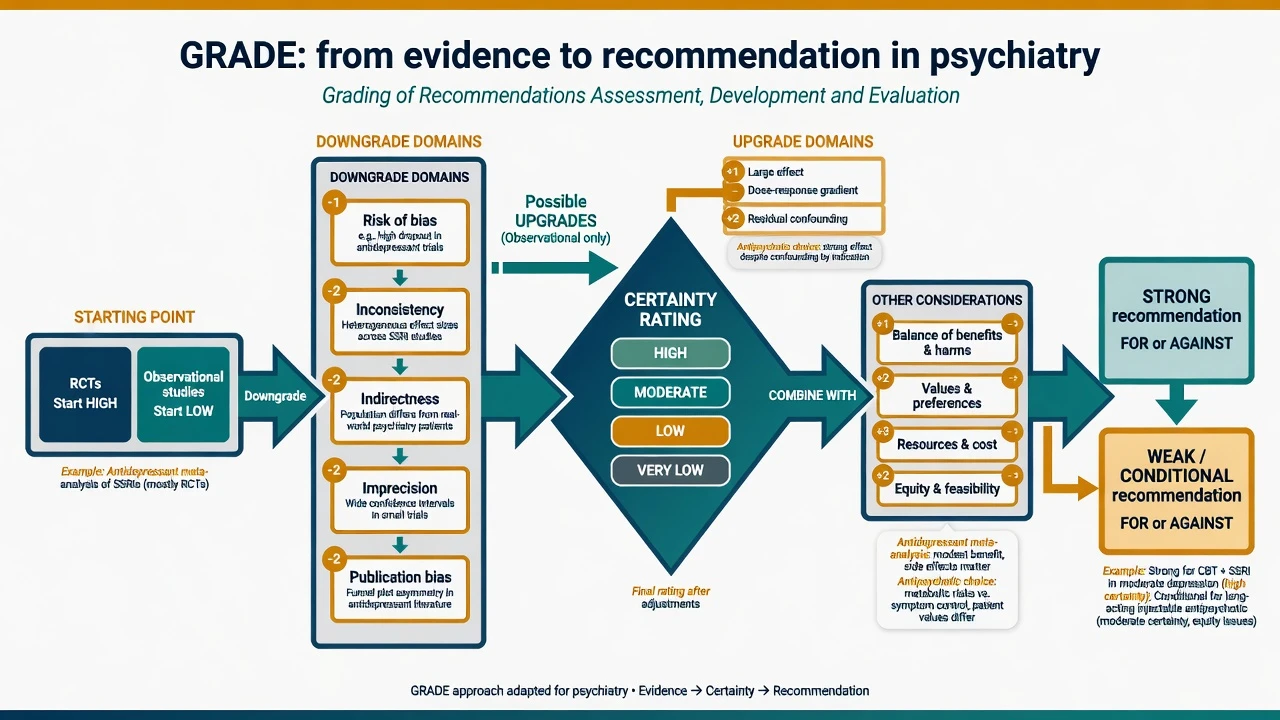
Psychiatry worked pattern. Antidepressant meta-analysis with moderate RoB concerns, substantial I-squared, and funnel asymmetry often lands at low/moderate certainty for average efficacy; recommendation for a specific first-line agent is usually conditional, individualised by side-effect profile, prior response, and patient values — consistent with how NICE-style GRADE products phrase choices, while APA and RANZCP present formal evidence grading with local applicability framing.[10][15][16]
NICE routinely presents GRADE certainty and absolute effects in summary-of-findings style tables. APA practice guidelines use structured evidence assessment with different presentation conventions. RANZCP clinical practice guidelines synthesise systematic evidence with Australian/New Zealand service context. Examiners reward correct certainty language and local applicability, not memorised clause numbers.[10][5]
10. Scenario subtypes
Antidepressant pairwise meta-analysis
Probe registration status of included trials, scale choice, LOCF, industry funding, and selective publication (Turner). Demand absolute response/remission differences at a stated baseline risk before counselling patients with NNT language.[15][14]
Antidepressant / antipsychotic NMA
Cipriani and colleagues’ 21-antidepressant NMA is the method exemplar: comparative efficacy and acceptability via direct and indirect evidence. Viva points: network structure, transitivity, ranking uncertainty, and that small absolute differences may still matter at population level while being modest for individuals.[16][13]
Psychotherapy trials
Double-blinding of therapists is impossible; use allegiance bias, control-type (wait-list vs active), and outcome assessor blinding as validity lenses. Pooling heterogeneous modalities with high I-squared needs clinical justification.[14]
Non-inferiority psychopharmacology
Example stem: new LAI vs oral antipsychotic with margin of 10% relapse difference. Ask: who set delta and why? Was the active control effective (assay sensitivity)? Do ITT and PP agree? Does the CI stay within delta?[12]
Diagnostic accuracy
Cognitive screen vs multidisciplinary dementia reference standard under QUADAS-2; convert Sn/Sp to LRs; apply to age-specific base rates.[3]
Observational safety (ROBINS-I)
Confounding by indication (sicker patients get clozapine or polypharmacy) is the default threat; residual confounding often keeps certainty low even with large n.[2]
Subgroup claims
“Works only in severe depression” — apply Sun users’ guide: pre-specified, limited number of subgroups, biological plausibility, within- vs between-study consistency, significant interaction test, and independence from multiple testing fishing.[17]
11. Pitfalls and complications
- Diamond-only reading while ignoring prediction intervals.[5]
- Treating I-squared thresholds as laws of nature.[4]
- Funnel over-reading with sparse studies.[7]
- NMA SUCRA/ranking as marketing.[13][14]
- Spin and secondary-outcome promotion in abstracts.
- Relative effects without baseline risk.
- External validity collapse: tightly selected efficacy samples ≠ community comorbidity (Rothwell).[18]
12. Prognosis of evidence — when to change practice
Practice change intensity scales with certainty × absolute benefit × value concordance × feasibility. A single large pragmatic multi-centre RCT with low RoB can outweigh a meta-analysis of small biased trials. Conversely, a statistically significant but tiny continuous scale difference with high inconsistency and publication concern rarely justifies protocol-level forced switching.[8][18]
13. Special populations — indirectness upgrades the GRADE conversation
Child/adolescent, older adult, perinatal, intellectual disability, and culturally diverse groups are under-represented in pivotal RCTs. Extrapolating adult meta-analytic averages is an indirectness downgrade; observational safety data help harms assessment but enter at lower starting certainty under GRADE/ROBINS-I logic.[2][9][18]
14. Evidence base and guidelines (named landmarks)
| Domain | Landmark |
|---|---|
| RoB tools | RoB 2; ROBINS-I; QUADAS-2[1][2][3] |
| Heterogeneity / RE | Higgins I-squared; Riley random-effects interpretation; Thompson meta-regression[4][5][20] |
| Publication bias | Egger; Sterne funnel recommendations; Turner antidepressants[6][7][15] |
| GRADE | Guyatt consensus; Balshem quality rating; going from evidence to recommendations[8][9][10] |
| Reporting | PRISMA 2020; CONSORT NI extension[11][12] |
| NMA / psychiatry methods | Mills users’ guide; Chaimani pitfalls; Cipriani 21-antidepressant NMA[13][14][16] |
| Subgroups / external validity | Sun subgroup users’ guide; Rothwell external validity[17][18] |
15. Exam pearls
GRADE downgrade domains — ROBIIP
Worked abstract critique skeleton (use in MEQ)
- PICO and design (superiority / NI / diagnostic / NMA).
- RoB 2 or other tool domain-by-domain.
- Effect: relative + absolute; clinical importance.
- Heterogeneity and prediction interval.
- Publication-bias signals.
- GRADE certainty one-liner.
- Applicability (Rothwell) and shared decision-making bottom line.[1][5][10][18]
Bottom line for fellowship. Advanced appraisal is not more jargon — it is disciplined separation of bias, random error, inconsistency, publication selection, and value-laden recommendation strength. Defend psychiatry practice changes with absolute effects, honest certainty language, and explicit applicability limits.[8][14][16]
References
- [1]Sterne JAC, Savović J, Page MJ, et al. RoB 2: a revised tool for assessing risk of bias in randomised trials BMJ, 2019.PMID 31462531
- [2]Sterne JA, Hernán MA, Reeves BC, et al. ROBINS-I: a tool for assessing risk of bias in non-randomised studies of interventions BMJ, 2016.PMID 27733354
- [3]Whiting PF, Rutjes AWS, Westwood ME, et al. QUADAS-2: a revised tool for the quality assessment of diagnostic accuracy studies Ann Intern Med, 2011.PMID 22007046
- [4]Higgins JP, Thompson SG, Deeks JJ, Altman DG Measuring inconsistency in meta-analyses BMJ, 2003.PMID 12958120
- [5]Riley RD, Higgins JPT, Deeks JJ Interpretation of random effects meta-analyses BMJ, 2011.PMID 21310794
- [6]Egger M, Davey Smith G, Schneider M, Minder C Bias in meta-analysis detected by a simple, graphical test BMJ, 1997.PMID 9310563
- [7]Sterne JAC, Sutton AJ, Ioannidis JPA, et al. Recommendations for examining and interpreting funnel plot asymmetry in meta-analyses of randomised controlled trials BMJ, 2011.PMID 21784880
- [8]Guyatt GH, Oxman AD, Vist GE, et al; GRADE Working Group GRADE: an emerging consensus on rating quality of evidence and strength of recommendations BMJ, 2008.PMID 18436948
- [9]Balshem H, Helfand M, Schünemann HJ, et al. GRADE guidelines: 3. Rating the quality of evidence J Clin Epidemiol, 2011.PMID 21208779
- [10]Guyatt GH, Oxman AD, Kunz R, et al. Going from evidence to recommendations BMJ, 2008.PMID 18467413
- [11]Page MJ, McKenzie JE, Bossuyt PM, et al. The PRISMA 2020 statement: an updated guideline for reporting systematic reviews BMJ, 2021.PMID 33782057
- [12]Piaggio G, Elbourne DR, Pocock SJ, Evans SJW, Altman DG; CONSORT Group Reporting of noninferiority and equivalence randomized trials: extension of the CONSORT 2010 statement JAMA, 2012.PMID 23268518
- [13]Mills EJ, Ioannidis JPA, Thorlund K, Schünemann HJ, Puhan MA, Guyatt GH How to use an article reporting a multiple treatment comparison meta-analysis JAMA, 2012.PMID 23011714
- [14]Chaimani A, Salanti G, Leucht S, Geddes JR, Cipriani A Common pitfalls and mistakes in the set-up, analysis and interpretation of results in network meta-analysis: what clinicians should look for in a published article Evid Based Ment Health, 2017.PMID 28739577
- [15]Turner EH, Matthews AM, Linardatos E, Tell RA, Rosenthal R Selective publication of antidepressant trials and its influence on apparent efficacy N Engl J Med, 2008.PMID 18199864
- [16]Cipriani A, Furukawa TA, Salanti G, et al. Comparative efficacy and acceptability of 21 antidepressant drugs for the acute treatment of adults with major depressive disorder: a systematic review and network meta-analysis Lancet, 2018.PMID 29477251
- [17]Sun X, Ioannidis JPA, Agoritsas T, Alba AC, Guyatt G How to use a subgroup analysis: users' guide to the medical literature JAMA, 2014.PMID 24449319
- [18]Rothwell PM External validity of randomised controlled trials: "to whom do the results of this trial apply?" Lancet, 2005.PMID 15639683
- [19]Schulz KF, Chalmers I, Hayes RJ, Altman DG Empirical evidence of bias. Dimensions of methodological quality associated with estimates of treatment effects in controlled trials JAMA, 1995.PMID 7823387
- [20]Thompson SG, Higgins JPT How should meta-regression analyses be undertaken and interpreted? Stat Med, 2002.PMID 12111920