Psych · Professional practice — critical appraisal and EBM
Critical appraisal for psychiatry exams
Also known as Critical appraisal · Evidence-based medicine · EBM psychiatry · MRCPsych Paper B statistics · Forest plot · Number needed to treat · NNT · CONSORT · PRISMA · Risk of bias · P-value · Confidence interval
Exam-exhaustive critical appraisal for MRCPsych Paper B and FRANZCP: Sackett EBM and PICO; hierarchy of evidence and GRADE; RCT validity (randomisation, concealment, blinding, ITT); bias taxonomy; ARR/RRR/NNT; p-values and CIs; diagnostic accuracy (Sn/Sp/LR); systematic reviews, forest plots, I-squared and publication bias; CONSORT/PRISMA/STROBE/STARD and RoB 2/ROBINS-I/QUADAS-2; worked psychiatry abstract critique. FRANZCP-primary, globally tagged.
On this page & tools
Your progress
Saved locally on this device.
10 MCQs with explanations
Target exams
Red flags
MRCPsych Paper B and FRANZCP written and viva stations do not reward vague journal-club praise. They reward a disciplined method: frame a PICO question, match design to question, attack internal validity before admiring the effect size, convert relative claims into ARR and NNT, read forest plots without worshipping the diamond, and translate residual uncertainty into a patient-level recommendation that includes values and harms.[1][2] Psychiatry is an especially hostile environment for naive readers: outcomes are often subjective rating scales, placebo responses are large, attrition is high, industry influence is common, and under-powered trials still fill the shelves.[16][26]
Overview and definition
Evidence-based medicine is the conscientious, explicit, and judicious use of current best evidence in making decisions about the care of individual patients — the integration of best research evidence with clinical expertise and patient values.[1] Critical appraisal is the skill that makes the evidence leg usable: a structured judgment of whether a study's methods can support its claims, how large and precise the effect is, and whether the result transfers to the person in front of you.
Critical appraisal is not statistics for its own sake, not anti-industry ideology, and not automatic dismissal of observational data. It is a bias-aware reading method. Design rank is a starting point; GRADE then rates the certainty of a body of evidence across risk of bias, inconsistency, indirectness, imprecision, and publication bias, allowing upgrades or downgrades that a rigid pyramid cannot express.[10][11]
Classification — hierarchy of evidence and study designs
The hierarchy ranks designs by average susceptibility to confounding and bias. It is a teaching scaffold, not a law of nature.[10]
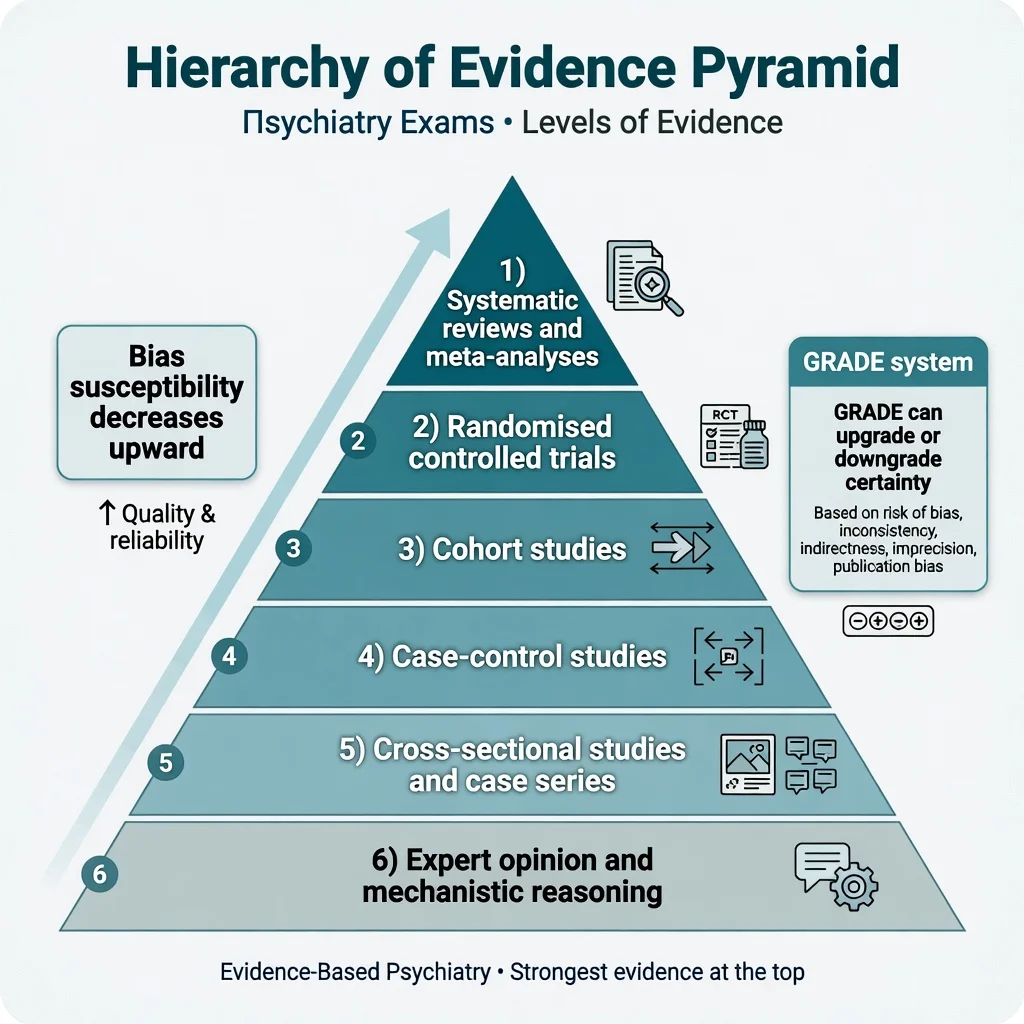
Hierarchy from strongest average design to weakest
SR-RCT-COH-CC-XS-EO
Pooled appraised evidence — only as good as included studies and the methods of synthesis
Gold standard for therapy questions when adequately powered and protected against bias
Forward in time; good for rare exposures and prognosis; confounding remains
Backward from outcome; efficient for rare diseases; recall and selection bias risks
Prevalence snapshots or uncontrolled clusters — hypothesis generation
Plausibility only — never proof of clinical benefit
Match design to question type. Therapy or harm → RCT when ethical and feasible. Rare exposure, common outcome → cohort. Rare outcome → case-control. Prevalence → cross-sectional. Prognosis → inception cohort. A large, carefully adjusted observational study can outrank a tiny, open-label RCT of a soft endpoint; examiners reward that nuance.[10]
Epidemiology of error — why psychiatry papers mislead
False-positive findings are more likely when studies are small, effect sizes are modest, designs are flexible, teams chase significance, and financial or academic interests align with a preferred answer.[16] Psychiatry piles on further risks: high placebo response in depression trials, subjective continuous outcomes (HAM-D, PANSS), early enrichment designs, LOCF-style imputation historically, and head-to-head trials powered for non-inferiority margins that are clinically generous.[23][26] Publication bias and selective outcome reporting mean the published literature is not a random sample of all conducted analyses.[18]
Pathophysiology of bias — how estimates get distorted
Bias is systematic error, not random noise. Random error shrinks with sample size; bias does not. Think of a causal path from the true treatment effect to the published estimate, and name every fork that can push the estimate away from truth.[13][20]
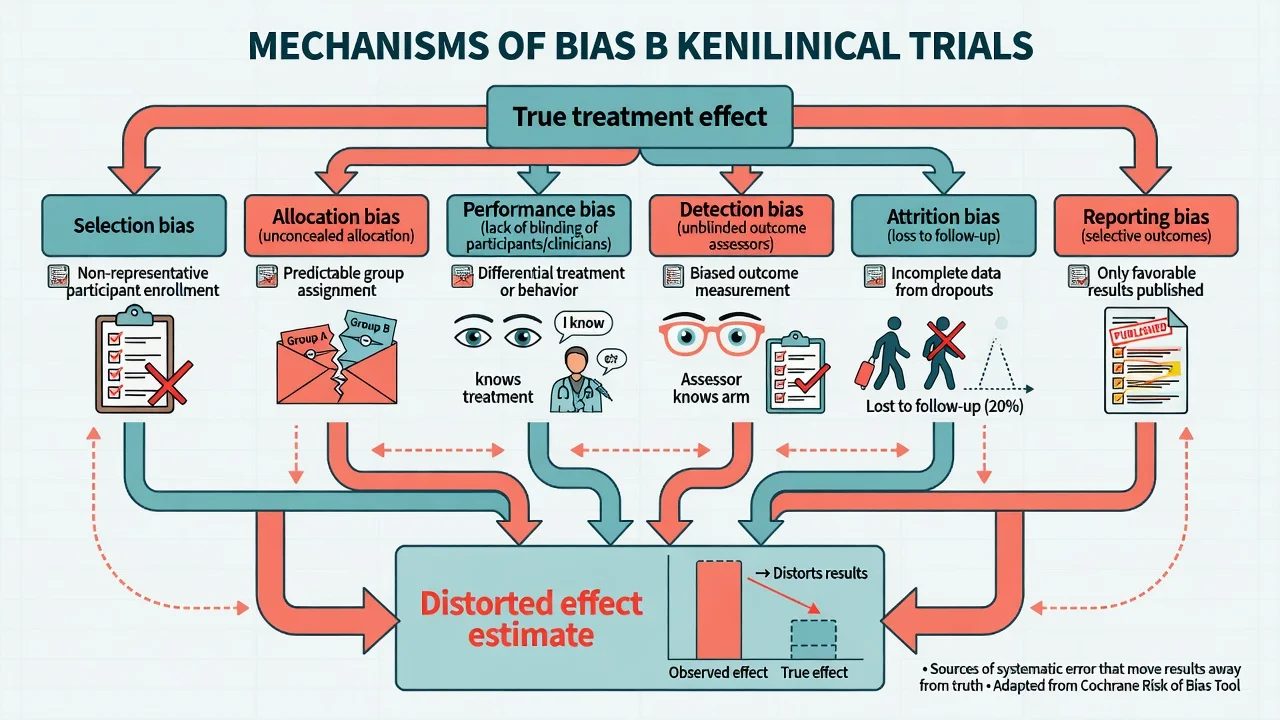
| Bias type | What goes wrong | Classic psychiatry example | Main protection |
|---|---|---|---|
| Selection / allocation | Prognostic factors unbalanced or assignment predictable | Open allocation list; last patient squeezed into active arm | Random sequence + allocation concealment |
| Performance | Care or behaviour differs by arm beyond the intervention | Extra supportive contact in psychotherapy arm | Blinding where possible; standardised co-interventions |
| Detection | Outcome measured differently by arm | Unblinded rater of CGI or HAM-D | Blinded assessors; hard endpoints |
| Attrition | Dropouts differ by arm and outcome | Drug arm dropouts with side-effects excluded from analysis | ITT; sensitivity analyses |
| Reporting | Only favourable outcomes published | Secondary scale promoted after primary fails | Pre-registered protocol; CONSORT outcomes |
Empirical work shows inadequate concealment is associated with exaggerated treatment effects — this is not theoretical pedantry.[20] Allocation concealment (protecting the randomisation sequence until assignment) is distinct from blinding (keeping assignment unknown after enrolment). Examiners love that distinction.
Clinical presentation — how the exam stem arrives
Paper B and fellowship stems present as: a short abstract of an antidepressant RCT; a forest plot from an antipsychotic meta-analysis; a diagnostic accuracy table for a dementia screen; a journal-club critique of a psychotherapy trial; or a one-liner asking you to calculate NNT from two event rates. The candidate who freezes on algebra loses easy marks; the candidate who only does algebra and never names bias loses the rest.[3][20]
Typical signals of trouble in a stem: unblinded subjective primary outcome; greater than 20–30 percent attrition without ITT; baseline imbalance on severity; industry sole analysis; non-inferiority margin not justified; "trend toward significance" language; only RRR reported.[14][22][3]
Differential — concepts examiners set as traps
- p below alpha rejects H0 under model assumptions
- Clinical importance needs effect size, CI, NNT, and patient values
- Tiny effects can be statistically significant in huge samples
- Superiority seeks better than control
- Non-inferiority seeks not unacceptably worse than active control
- Failed superiority is not proof of equivalence
- RR = risk ratio of event rates; intuitive
- OR used in case-control and many meta-analyses; approximates RR when events rare
- HR is time-to-event relative hazard from survival models
- Fixed-effect assumes one true effect (homogeneous studies)
- Random-effects (e.g. DerSimonian–Laird) allows true effects to vary; wider CIs when heterogeneous
- Do not pick the model to manufacture significance
Absence of a statistically significant difference is not evidence of no effect, especially when power is low or the CI is wide enough to include important benefit and harm.[21]
Assessment method — PICO then the three questions
Before searching or appraising, build a focused question.[2]
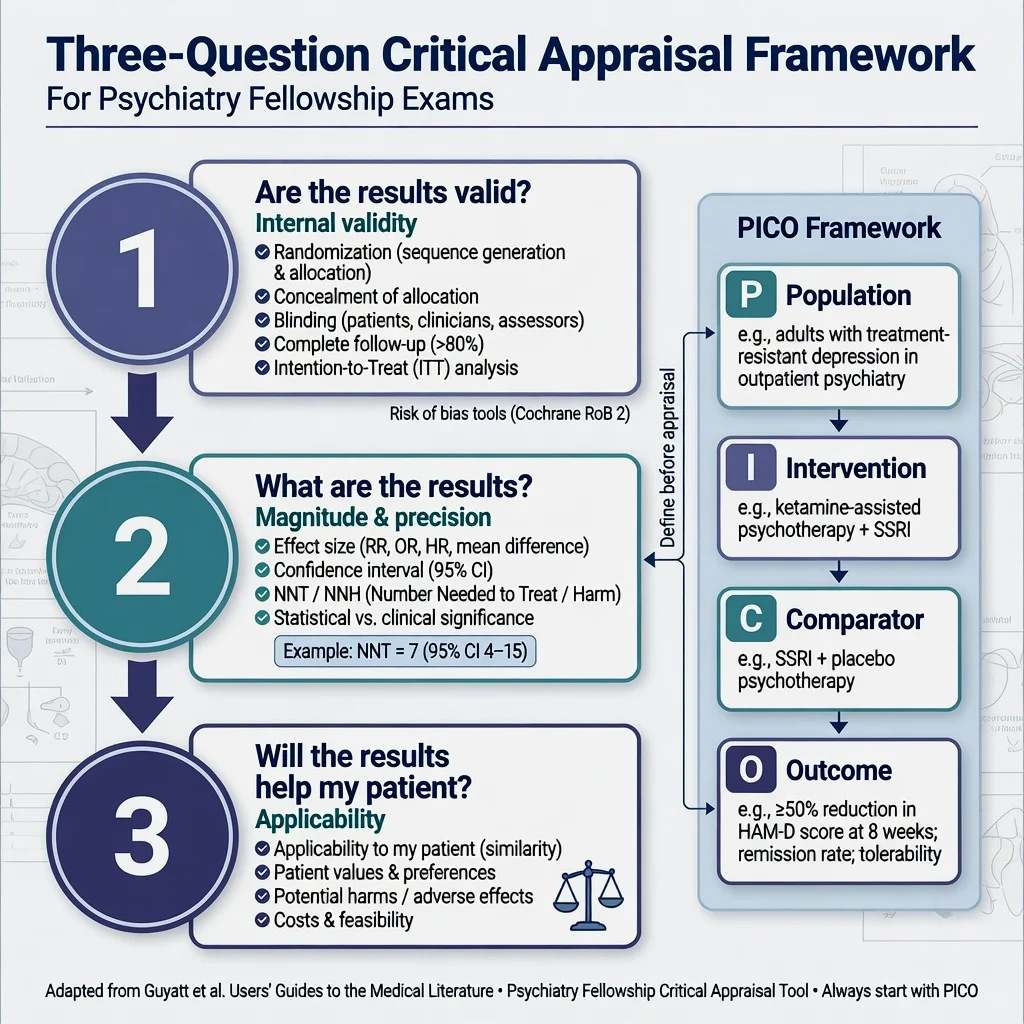
RCT validity checklist (memorise)
- Was the allocation sequence truly random?
- Was allocation concealed?
- Were participants, clinicians, and outcome assessors blinded as far as feasible?
- Were groups similar at baseline on prognostic factors?
- Was follow-up sufficiently complete and equal?
- Was analysis by intention to treat?
- Were co-interventions balanced?
- Was the primary outcome pre-specified and patient-important?
Intention-to-treat analyses all randomised participants in their assigned arms, preserving the benefits of randomisation under non-adherence; pure per-protocol analyses often inflate apparent benefit and answer a different question ("what if everyone took the drug perfectly?").[22] RoB 2 operationalises modern domain judgments for RCTs: randomisation process, deviations from intended interventions, missing outcome data, measurement of the outcome, and selection of the reported result.[13][14] For non-randomised intervention studies use ROBINS-I, which foregrounds confounding.[15]
Systematic review appraisal
Did the review pre-register a protocol? Was the search comprehensive (multiple databases, grey literature where relevant)? Were inclusion criteria explicit? Was risk of bias assessed for each study? Were results synthesised appropriately given heterogeneity? Was publication bias considered?[6][7] PRISMA is a reporting standard, not an automatic quality certificate — a PRISMA-compliant write-up can still pool rubbish.
Diagnostic study appraisal
Independent, blind comparison with an appropriate reference standard; spectrum of patients similar to practice; all patients get the reference standard or a verified alternative; 2×2 data complete. QUADAS-2 structures patient selection, index test, reference standard, and flow/timing domains.[9][17]
Investigations — the quantitative toolkit
Treatment effects: ARR, RRR, NNT, NNH
From control event rate (CER) and experimental event rate (EER), Laupacis and colleagues emphasised clinically useful absolute measures:[3]
- ARR = CER − EER (for a beneficial reduction in bad events)
- RRR = ARR / CER
- RR = EER / CER
- NNT = 1 / ARR (round up in exam convention unless told otherwise)
- NNH = 1 / absolute risk increase for harm
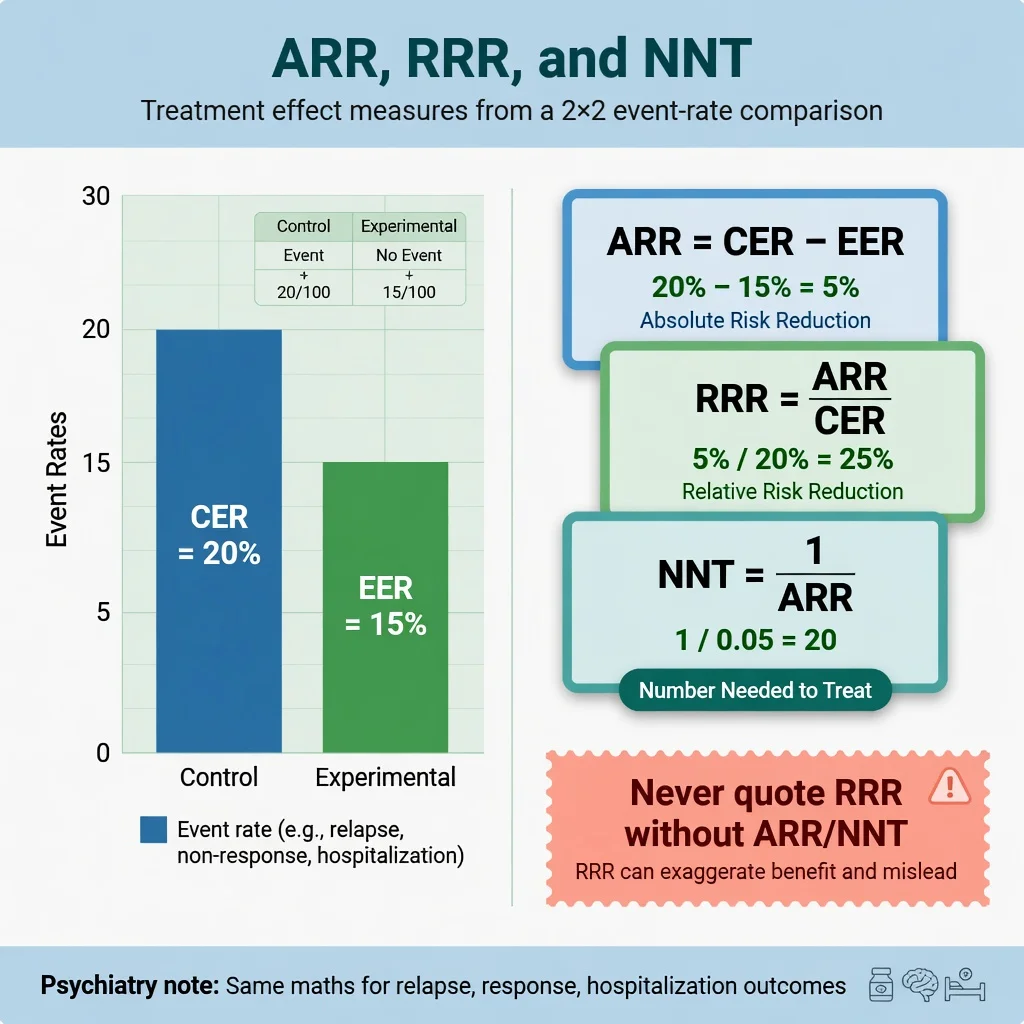
Worked exam numbers: CER 20 percent relapse on placebo, EER 15 percent on drug → ARR 5 percent → RRR 25 percent → NNT 20. Marketing will shout the RRR; you report the NNT and the outcome definition, duration, and harm profile.[3] Psychiatry examples include relapse prevention on continued antidepressants (classic systematic review evidence of substantial relative benefit with NNT depending on baseline risk) and antipsychotic–placebo contrasts where absolute benefits vary with severity and endpoint.[25][26]
p-values, type I/II error, and power
The p-value is the probability of data as extreme as those observed (or more extreme) if the null hypothesis were true. It is not the probability that the null is true, not the probability the result is "due to chance" in casual language, and not a measure of effect size.[16]
- Type I error (α) — false positive; conventionally 0.05 for a single primary test
- Type II error (β) — false negative; missing a real effect
- Power = 1 − β — probability of detecting a specified effect if it exists (often targeted at 80–90 percent)
Multiple testing without correction multiplies false positives. A pre-specified primary outcome and a statistical analysis plan are validity features, not bureaucracy.[16]
Confidence intervals
A 95 percent CI describes precision. For a ratio measure, a CI that includes 1 is compatible with no relative effect at the 5 percent significance level (two-sided). For a difference, inclusion of 0 plays the same role. Prefer the CI over a lone p-value: a result of RR 0.70 (95 percent CI 0.40–1.20) is compatible with substantial benefit and moderate harm — "non-significant" is not the end of interpretation.[21][3]
Forest plots, heterogeneity, publication bias
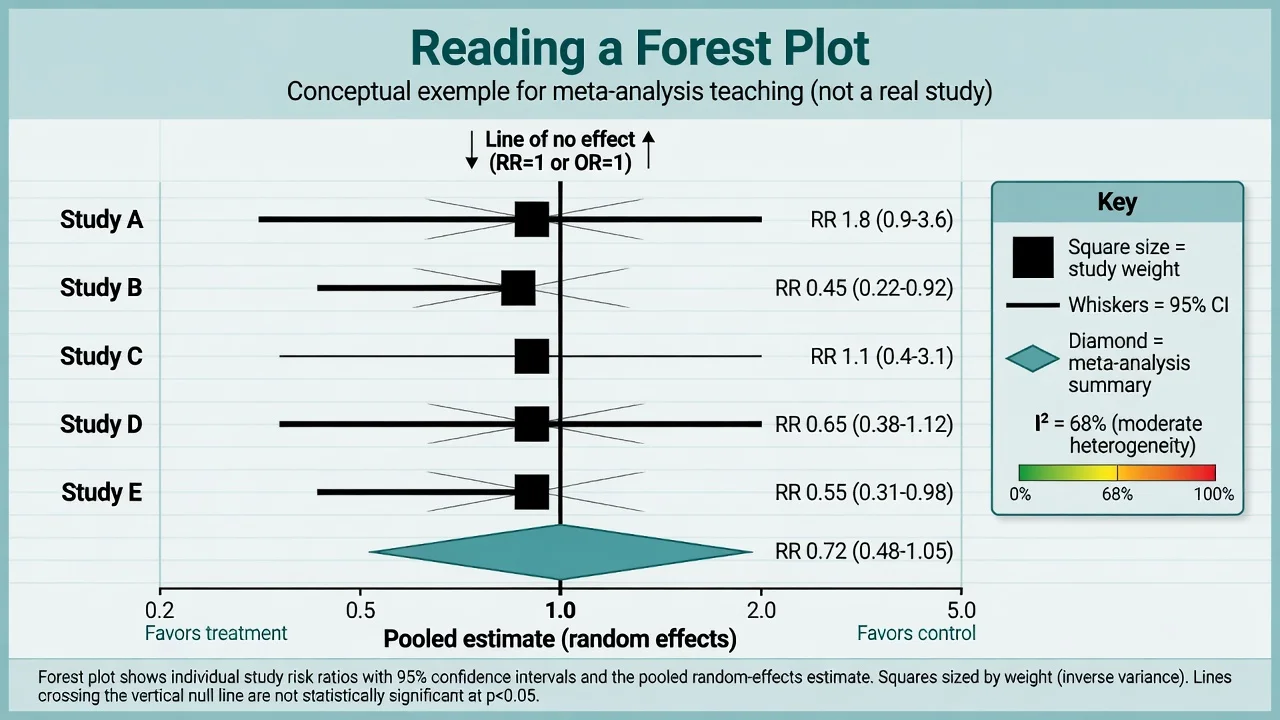
I-squared estimates the percentage of total variation across studies due to heterogeneity rather than chance; rough teaching bands are low (around 0–25 percent), moderate (25–50 percent), and substantial (above 50 percent), but clinical judgment of diversity of populations, doses, and outcomes always trumps a single percentage.[12] Random-effects models acknowledge between-study variance and typically widen intervals.[19] Funnel plots and tests such as Egger's may suggest small-study or publication bias when asymmetry appears — useful suspicion tools, not courtroom proof.[18]
Psychiatry meta-analyses you should be able to appraise at vignette level include network comparisons of antidepressants and pairwise SGA versus FGA antipsychotic syntheses — focus on risk of bias, heterogeneity, outcome choice (efficacy versus acceptability), and whether rankings over-promise.[23][24]
Diagnostic metrics
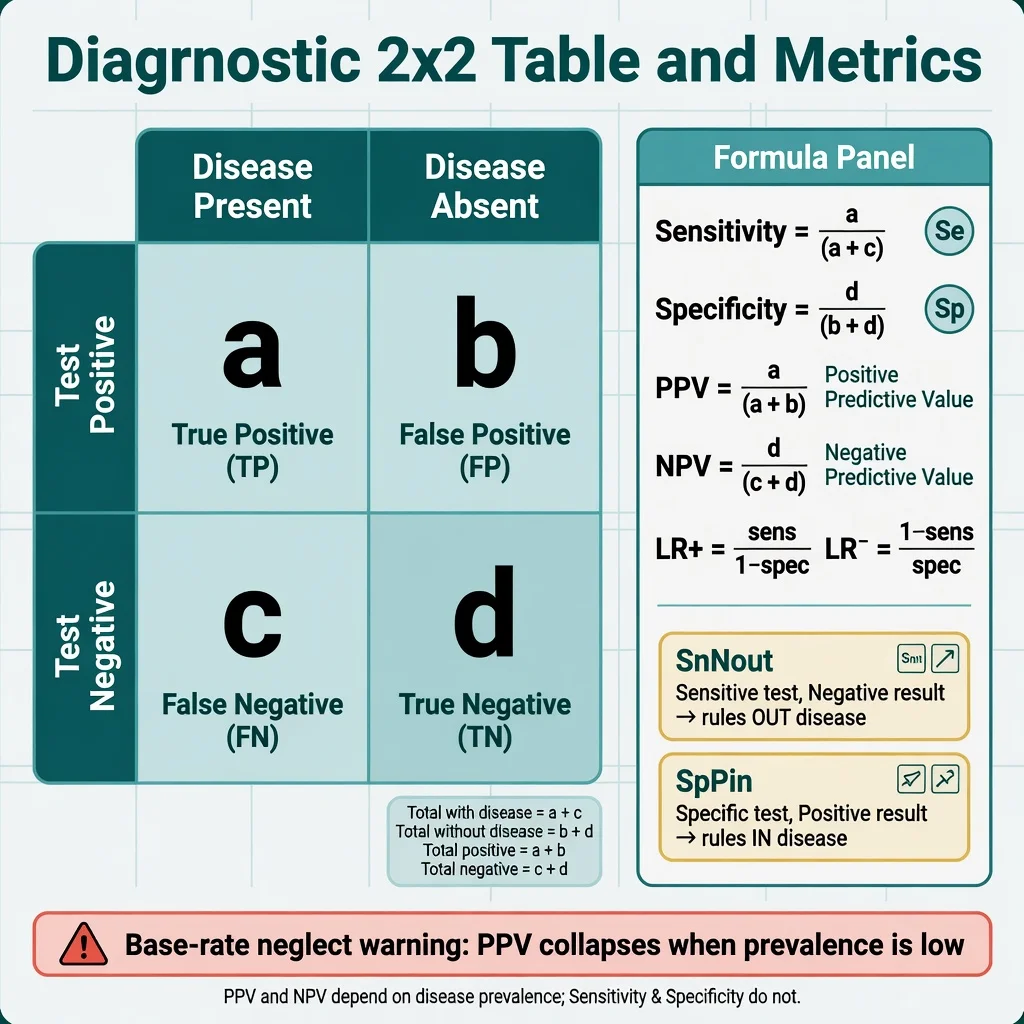
- Sensitivity = a / (a + c) — among diseased, fraction positive (SnNout: highly Sensitive test, Negative → rules out)
- Specificity = d / (b + d) — among non-diseased, fraction negative (SpPin: highly Specific test, Positive → rules in)
- PPV = a / (a + b); NPV = d / (c + d) — both move with prevalence
- LR+ = sensitivity / (1 − specificity); LR− = (1 − sensitivity) / specificity
Likelihood ratios convert pre-test to post-test odds without being slaves to a single prevalence, which is why Users' Guides elevate them for bedside use.[4] Screening a low-prevalence population with even a "good" test produces many false positives — base-rate neglect is a Paper B favourite.
Management — acute exam strategy (first 60 seconds)
When the stem hits, run the Users' Guides sequence under exam time pressure:[1][4]
- Underline design (RCT, SR, diagnostic, cohort).
- Write PICO in the margin.
- Name the primary outcome and whether it is patient-important.
- Hunt the single worst validity threat (concealment, blinding, attrition, reference standard).
- Extract or calculate absolute effects if numbers allow.
- Only then discuss applicability and practice change.
Discard or heavily downgrade when concealment is broken and outcomes are soft, when loss to follow-up is large and informative, or when the analysis is per-protocol-only for a superiority claim.[20][22]
Management — definitive worked critique
Use this skeleton in MEQs, vivas, and journal club.[1][4]
Validity. Population and recruitment; randomisation and concealment; blinding; baseline balance; follow-up percent; ITT; outcome definition and measurement; protocol registration; funding and conflicts.[5][14]
Results. Primary effect with CI; ARR/NNT or continuous mean difference with MCID if discussed; harms/NNH; secondary outcomes clearly labelled as such; subgroup claims pre-specified or exploratory.[3][5]
Applicability. Is my patient represented (age, comorbidity, suicidality, substance use, ethnicity, setting)? Are values and preferences likely aligned? Can local services deliver the intervention with similar fidelity? What is the opportunity cost?[1]
Bottom line. One sentence: "In adults with moderate MDD, drug X versus placebo reduced relapse from A percent to B percent over 6 months (NNT = N), with main harm Z (NNH = M); certainty moderate due to attrition; offer if patient values relapse prevention over that harm profile."[3][10]
Reporting standards awareness
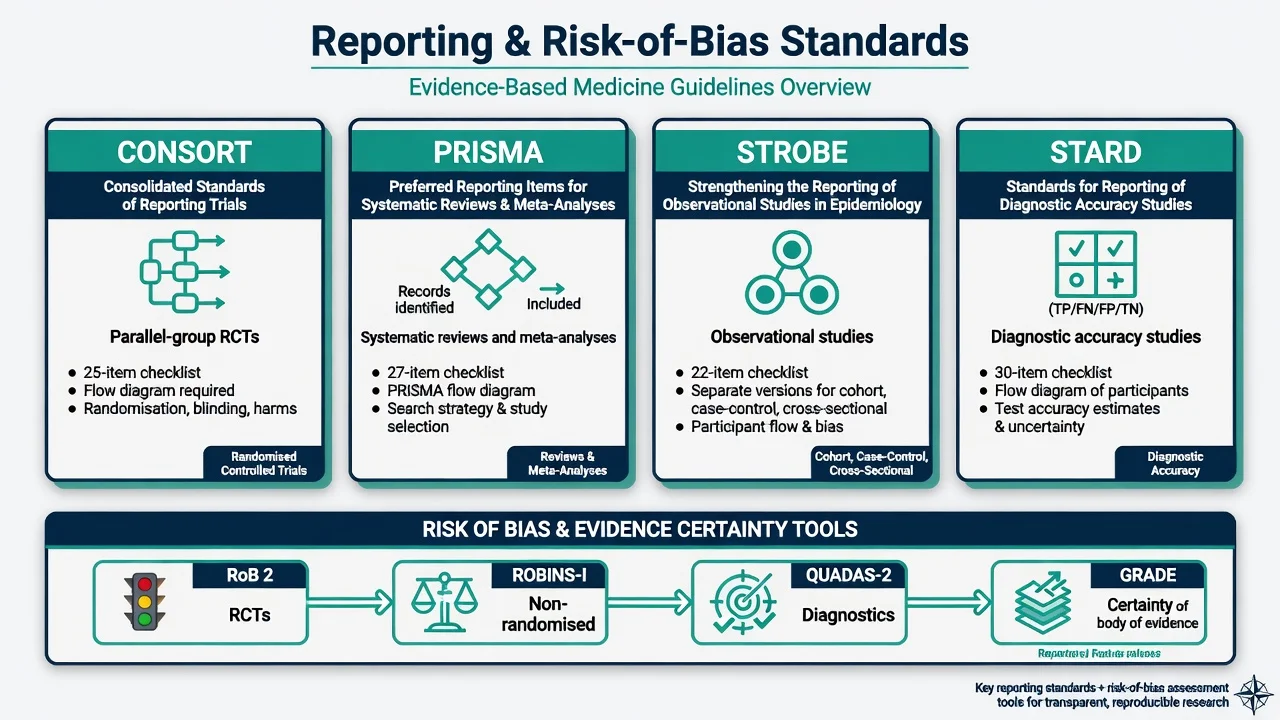
- CONSORT — parallel-group RCT reporting checklist and flow diagram.[5]
- PRISMA (2009; updated 2020) — systematic review reporting.[6][7]
- STROBE — observational epidemiology reporting.[8]
- STARD — diagnostic accuracy reporting.[17]
Reporting guidelines improve transparency; they do not prove internal validity by themselves.[5][6][8][17]
Specific scenarios
Antidepressant acute RCT. Expect large placebo response, continuous scale primary outcomes, and industry funding. Demand ITT, blinded ratings, and pre-specified remissions/response rates with absolute differences. Network meta-analyses of multiple agents require additional assumptions (transitivity); treat league tables cautiously.[23]
Antipsychotic meta-analysis. Compare effect sizes on total symptoms against side-effect trade-offs; older FGA versus SGA debates hinge on which FGAs and doses are chosen as comparators.[24][26]
Psychotherapy trial. Double-blinding of patients and therapists is usually impossible; use blinded raters, attention-matched controls, and allegiance bias awareness. Wait-list controls inflate effects versus active comparators.[14][16]
Diagnostic screening (e.g. PHQ-9 style stems). Separate screening utility from diagnosis; compute predictive values at realistic prevalence; prefer LRs when given.[4]
Observational pharmacoepidemiology. Confounding by indication is the default threat — sicker patients get the drug and do worse; ROBINS-I thinking is mandatory.[15]
Non-inferiority. Ensure margin is clinically justified pre-hoc; analyse both ITT and per-protocol carefully (they can bias in opposite directions); superiority claims from non-inferiority trials need pre-specification.[22][21]
Complications and pitfalls
Other traps: ecological fallacy; post-hoc power calculations as if they salvage a negative study; mistaking composite outcomes when only one component drives the effect; spin in abstracts that softens non-significant primaries.[16][21]
Prognosis and disposition of evidence
Decide practice change using: certainty of evidence (GRADE) × magnitude and precision × importance of outcome × patient values × feasibility. A single large pragmatic trial with hard outcomes can justify action sooner than a dozen tiny explanatory trials of soft scales.[10][11] When certainty is low, the disposition is shared decision-making with explicit uncertainty, not false confidence.
Special populations and external validity
Child and adolescent trials are often under-powered with developmental endpoints; older adults are excluded by comorbidity rules then receive the drug in clinic; perinatal evidence is frequently observational with residual confounding; intellectual disability and Indigenous populations are under-represented so rating-scale validation and equity of evidence must be named. Cultural validity of instruments is part of applicability, not optional diversity garnish.[1][15][16]
Evidence, guidelines, and regional notes
Landmark method papers above are the core. Psychiatry content landmarks used as appraisal fodder include antidepressant network meta-analysis, SGA versus FGA synthesis, multi-decade antipsychotic placebo-controlled trial meta-analysis, and antidepressant relapse-prevention systematic review.[23][24][25][26]
RANZCP clinical practice guidelines and Australian/New Zealand drug funding bodies increasingly use GRADE-style language for recommendation strength. Examiners expect you to cite certainty and strength separately: strong recommendation / high certainty is rare in psychiatry; weak/conditional recommendations with moderate or low certainty are common and should not be misread as "do nothing".[10][11]
Exam pearls
Self-test: calculate NNT
Placebo relapse 40 percent, drug relapse 25 percent over 12 months. ARR = 0.15. NNT = 1/0.15 ≈ 6.7 → report 7 if instructed to round up. Also state duration, outcome definition, and ask for harms before recommending.[3]
Self-test: name the bias
Open-label antidepressant trial; primary outcome is patient-rated mood app score; 35 percent dropout in drug arm from nausea, analysed completers only. Dominant threats: performance/detection bias (open label + subjective outcome) and attrition bias with per-protocol analysis inflating benefit.[14][22]
References
- [1]Sackett DL, Rosenberg WM, Gray JA, Haynes RB, Richardson WS Evidence based medicine: what it is and what it isn't BMJ, 1996.PMID 8555924
- [2]Richardson WS, Wilson MC, Nishikawa J, Hayward RS The well-built clinical question: a key to evidence-based decisions ACP J Club, 1995.PMID 7582737
- [3]Laupacis A, Sackett DL, Roberts RS An assessment of clinically useful measures of the consequences of treatment N Engl J Med, 1988.PMID 3374545
- [4]Jaeschke R, Guyatt GH, Sackett DL Users' guides to the medical literature. III. How to use an article about a diagnostic test. B. What are the results and will they help me in caring for my patients? JAMA, 1994.PMID 8309035
- [5]Schulz KF, Altman DG, Moher D; CONSORT Group CONSORT 2010 statement: updated guidelines for reporting parallel group randomised trials BMJ, 2010.PMID 20332509
- [6]Moher D, Liberati A, Tetzlaff J, Altman DG; PRISMA Group Preferred reporting items for systematic reviews and meta-analyses: the PRISMA statement BMJ, 2009.PMID 19622551
- [7]Page MJ, McKenzie JE, Bossuyt PM, et al. The PRISMA 2020 statement: an updated guideline for reporting systematic reviews BMJ, 2021.PMID 33782057
- [8]von Elm E, Altman DG, Egger M, Pocock SJ, Gøtzsche PC, Vandenbroucke JP; STROBE Initiative The Strengthening the Reporting of Observational Studies in Epidemiology (STROBE) statement: guidelines for reporting observational studies Lancet, 2007.PMID 18064739
- [9]Whiting PF, Rutjes AWS, Westwood ME, et al. QUADAS-2: a revised tool for the quality assessment of diagnostic accuracy studies Ann Intern Med, 2011.PMID 22007046
- [10]Guyatt GH, Oxman AD, Vist GE, et al; GRADE Working Group GRADE: what is "quality of evidence" and why is it important to clinicians? BMJ, 2008.PMID 18456631
- [11]Guyatt GH, Oxman AD, Vist GE, et al; GRADE Working Group GRADE: an emerging consensus on rating quality of evidence and strength of recommendations BMJ, 2008.PMID 18436948
- [12]Higgins JP, Thompson SG, Deeks JJ, Altman DG Measuring inconsistency in meta-analyses BMJ, 2003.PMID 12958120
- [13]Higgins JPT, Altman DG, Gøtzsche PC, et al. The Cochrane Collaboration's tool for assessing risk of bias in randomised trials BMJ, 2011.PMID 22008217
- [14]Sterne JAC, Savović J, Page MJ, et al. RoB 2: a revised tool for assessing risk of bias in randomised trials BMJ, 2019.PMID 31462531
- [15]Sterne JA, Hernán MA, Reeves BC, et al. ROBINS-I: a tool for assessing risk of bias in non-randomised studies of interventions BMJ, 2016.PMID 27733354
- [16]Ioannidis JPA Why most published research findings are false PLoS Med, 2005.PMID 16060722
- [17]Bossuyt PM, Reitsma JB, Bruns DE, et al; STARD Group STARD 2015: an updated list of essential items for reporting diagnostic accuracy studies BMJ, 2015.PMID 26511519
- [18]Egger M, Davey Smith G, Schneider M, Minder C Bias in meta-analysis detected by a simple, graphical test BMJ, 1997.PMID 9310563
- [19]DerSimonian R, Laird N Meta-analysis in clinical trials Control Clin Trials, 1986.PMID 3802833
- [20]Schulz KF, Chalmers I, Hayes RJ, Altman DG Empirical evidence of bias. Dimensions of methodological quality associated with estimates of treatment effects in controlled trials JAMA, 1995.PMID 7823387
- [21]Altman DG, Bland JM Absence of evidence is not evidence of absence BMJ, 1995.PMID 7647644
- [22]Hollis S, Campbell F What is meant by intention to treat analysis? Survey of published randomised controlled trials BMJ, 1999.PMID 10480822
- [23]Cipriani A, Furukawa TA, Salanti G, et al. Comparative efficacy and acceptability of 21 antidepressant drugs for the acute treatment of adults with major depressive disorder: a systematic review and network meta-analysis Lancet, 2018.PMID 29477251
- [24]Leucht S, Corves C, Arbter D, Engel RR, Li C, Davis JM Second-generation versus first-generation antipsychotic drugs for schizophrenia: a meta-analysis Lancet, 2009.PMID 19058842
- [25]Geddes JR, Carney SM, Davies C, et al. Relapse prevention with antidepressant drug treatment in depressive disorders: a systematic review Lancet, 2003.PMID 12606176
- [26]Leucht S, Leucht C, Huhn M, et al. Sixty Years of Placebo-Controlled Antipsychotic Drug Trials in Acute Schizophrenia: Systematic Review, Bayesian Meta-Analysis, and Meta-Regression of Efficacy Predictors Am J Psychiatry, 2017.PMID 28541090