Paeds · growth-development-and-behaviour
Normal growth from fetal life through adolescence
Also known as Normal paediatric growth · ICP growth model · Life-course growth
Fellowship guide to normal fetal-to-adolescent growth physiology, ICP phases, chart interpretation, mid-parental height, puberty and red-flag growth patterns.
On this page & tools
Your progress
Saved locally on this device.
Practise this topic
Target exams
Red flags
Life stages
Care settings
Clinical exam formats
Board mappings
I.C.P.
Overview & Definition
Growth is the increase in body size over time. Development is skill acquisition. This page owns growth. Fellowship candidates must explain life-course physiology, choose the right chart, and know when a “small” child is a healthy variant versus a disease signal. [1] [8]
Normal growth is not one centile forever. Healthy children often cross centiles in infancy as they find their genetic channel, then track more steadily in childhood, then accelerate in puberty. The clinical verb is velocity — how fast size is changing — not a single point. [1] [5]
Classification
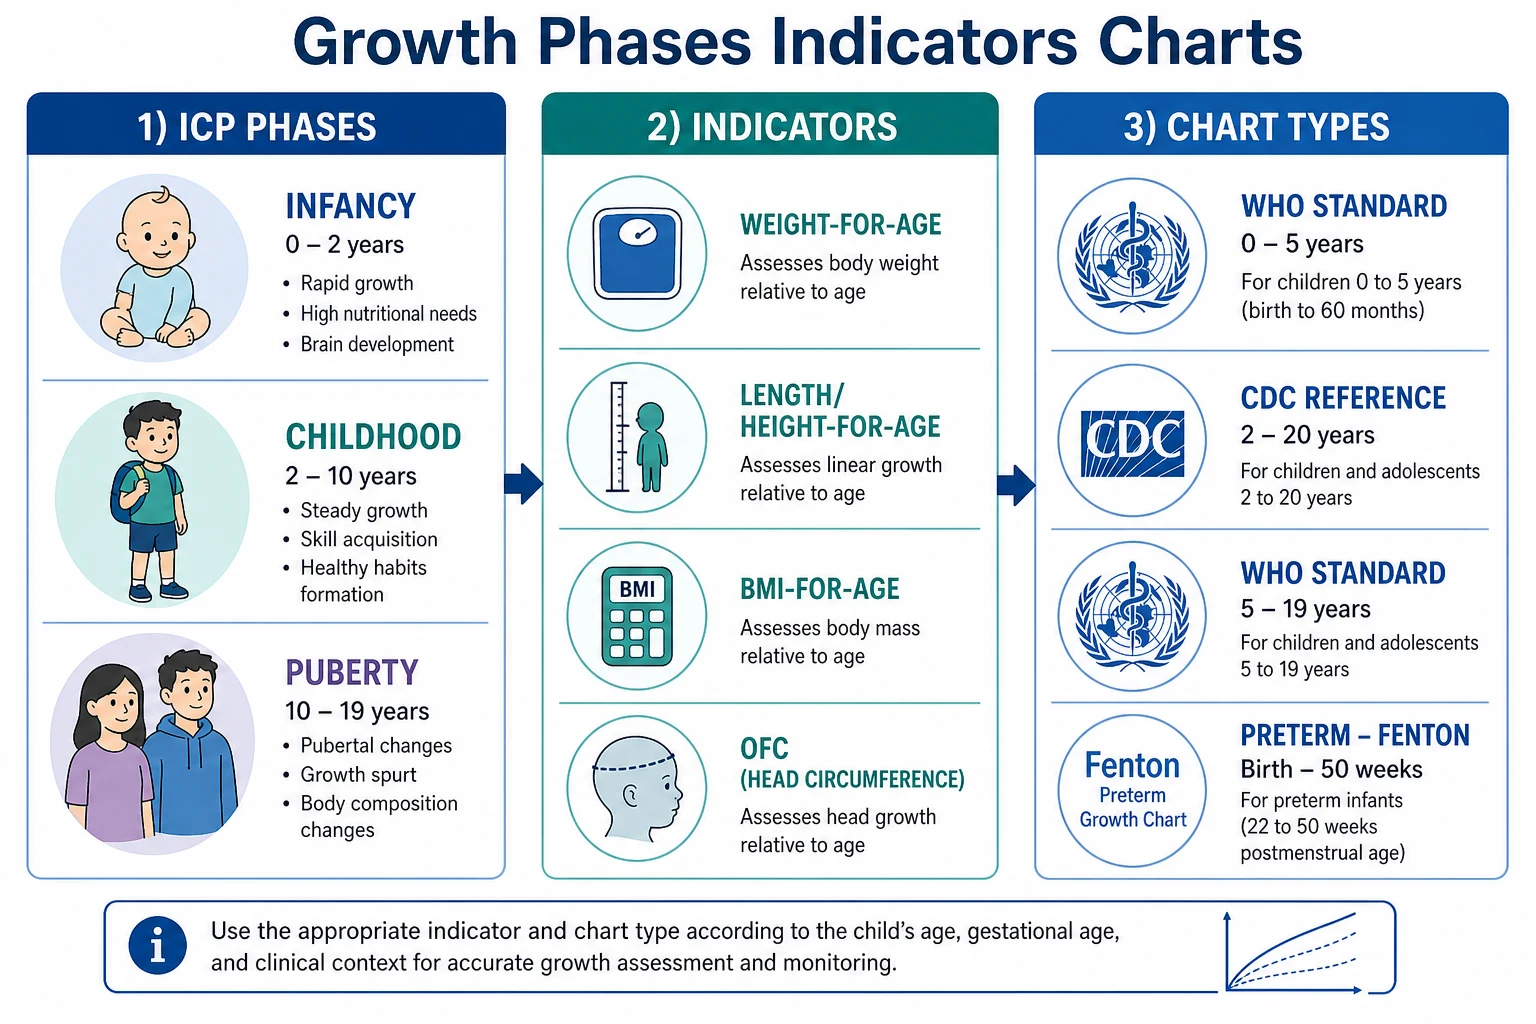
Anthropometric indicators. Weight-for-age, length/height-for-age, weight-for-length or BMI-for-age, and head circumference-for-age answer different questions. Weight responds first to energy imbalance. Length/height reflects longer-term skeletal growth. Head circumference tracks early brain growth. BMI-for-age is the usual adiposity tool from about 2 years. [1] [2]
Percentiles and z-scores. Percentiles are familiar for families. Z-scores (SDS) are better at extremes and for research or programme cut-offs. On WHO standards, screening for unhealthy growth often uses about ±2 SD (near the 2.3rd and 97.7th percentiles) rather than 5th/95th alone. [1] [3]
Chart classes. WHO 0–5 years standards describe optimal growth. CDC 2000 charts are US references. WHO 5–19 years is a school-age and adolescent reference. UK-WHO charts operationalise WHO design for UK records. Preterm tools such as revised Fenton charts support early postnatal plotting before term-equivalent transition. [1] [2] [4] [9]
Size labels. Short stature is often described as height more than 2 SD below the mean for age and sex; always interpret with velocity and mid-parental height. Idiopathic short stature is a residual label after complete evaluation, including stimulated GH testing in consensus frameworks — not a first-glance clinic diagnosis. Overweight and obesity cut-offs differ by tool: CDC BMI percentiles, WHO BMI z-scores, and IOTF curves linked to adult BMI 25 and 30. [7] [8] [10]
SGA, IUGR and FGR. Small for gestational age is a birth-size label (commonly weight below the 10th centile for gestation and sex in many frameworks). Intrauterine growth restriction and fetal growth restriction describe a restricted fetal growth process. Not every SGA neonate had FGR, and not every FGR fetus is still SGA at birth. Postnatal follow-up plans differ when catch-up fails. [6]
Epidemiology & Risk Factors
Population growth patterns shift with nutrition, infection burden, chronic disease care and social conditions. Switching from older NCHS-style references to WHO standards changes the apparent rates of underweight, stunting, wasting and overweight in programme data. [1]
Perinatal risk includes prematurity, multiple birth, maternal illness and SGA status. Childhood risk includes food insecurity, chronic inflammation, coeliac disease, congenital heart disease, renal disease, untreated endocrine disease, genetic syndromes, glucocorticoid exposure and stimulant effects on appetite. Safeguarding risk includes neglect and trauma environments that impair feeding and care. [6] [12]
Do not invent racial growth ceilings. Ethnicity and migration change disease risk and food access; they do not create a separate “normal” short stature biology that excuses poor velocity. [1] [12]
Pathophysiology
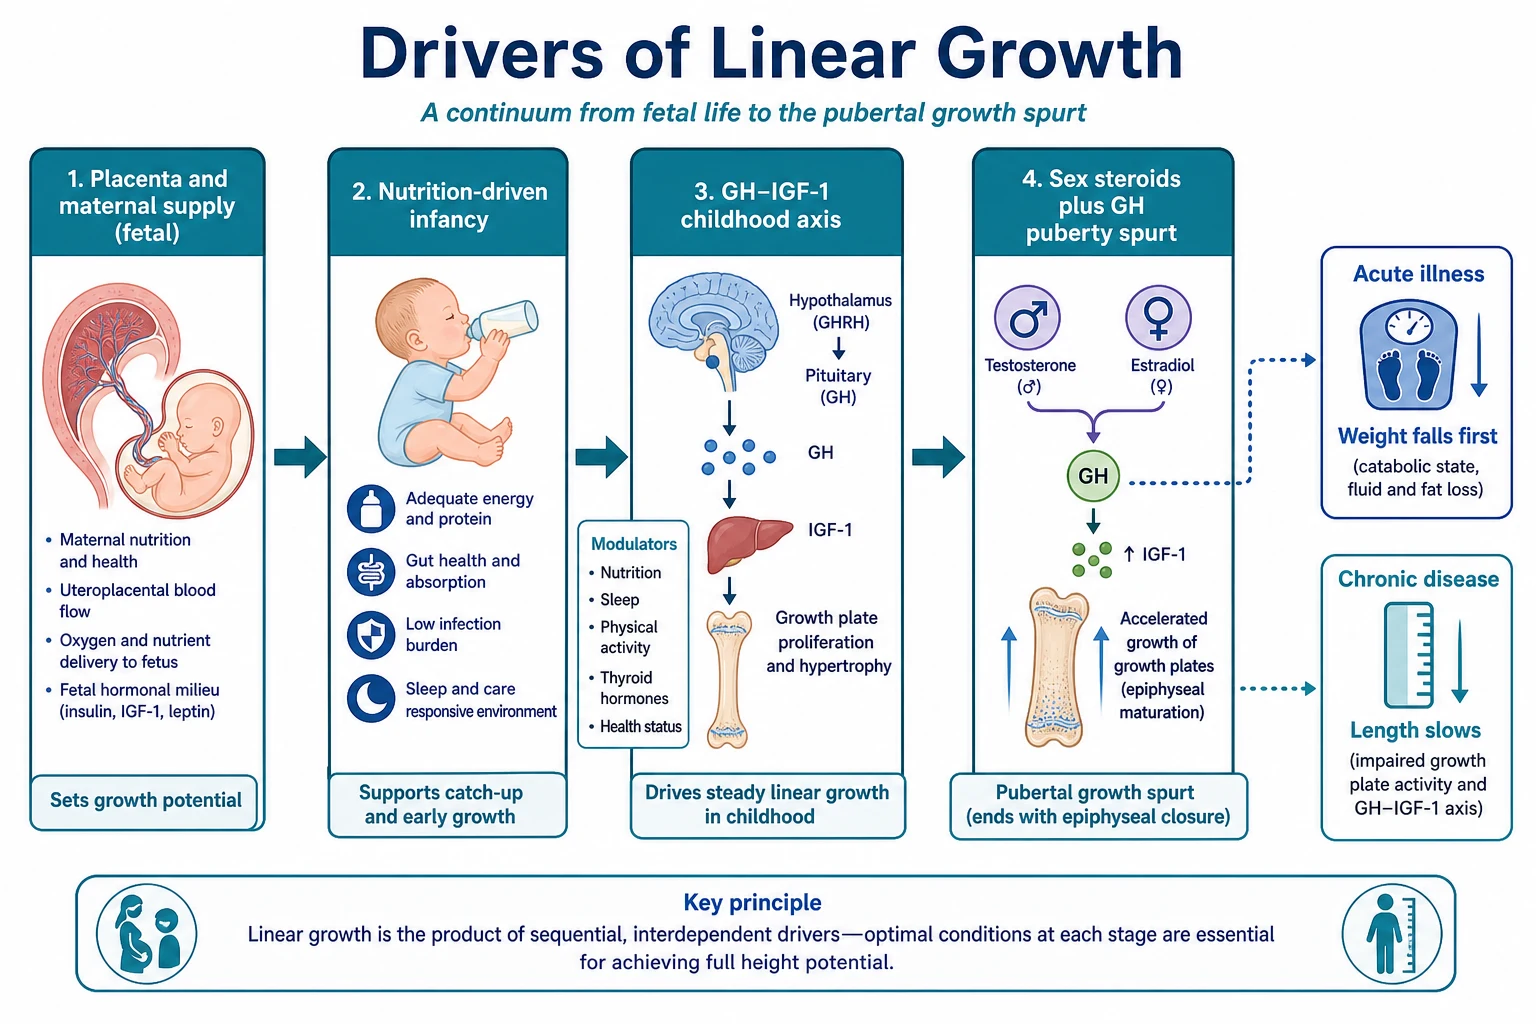
Fetal growth. The fetus grows under placental oxygen and nutrient supply, maternal health and genetics. Restriction produces a spectrum from mild SGA to severe FGR with perinatal morbidity. After birth, many SGA infants show catch-up, but persistent short stature or metabolic risk needs structured follow-up. [6]
Infancy phase. Karlberg’s infancy–childhood–puberty model frames early linear growth as heavily nutrition-dependent. Healthy breastfed infants under WHO standards are the normative model, not a problem to “fix” toward older formula-biased curves. [1] [5]
Childhood phase. After the infancy–childhood transition, linear growth depends more on the GH–IGF-1 axis, thyroid status and general health. Chronic disease and inflammation suppress growth velocity. GH deficiency and hypothyroidism classically slow height more than weight in some patterns. [5] [8]
Pubertal phase. Sex steroids amplify GH–IGF-1 action and produce the pubertal spurt. Early puberty advances bone age and can limit adult height if epiphyses fuse early. Delayed puberty delays the spurt and can look like short stature until timing is recognised. [5] [8]
Weight versus length. Acute energy deficit or illness drops weight first. Prolonged undernutrition, chronic disease, endocrine failure and genetic short stature more often slow length/height. Head growth is relatively protected but can signal intracranial pathology when OFC crosses centiles rapidly. [1] [8]
Clinical Presentation
A well child tracking a low but parallel channel looks different from a child losing centiles. Families may notice clothes staying large, shoes not changing size, or a teacher commenting that the child is the smallest in class. Excess weight may be silent until BMI is plotted. Microcephaly or macrocephaly may present with developmental concern or as an incidental OFC finding. [8]
Preterm graduates present as “falling off” charts when staff plot chronological age without correction early on. Adolescents may present with delayed or early secondary sexual characteristics, body-image distress, or sport-related height anxiety. Safeguarding presentations include multi-parameter faltering with inconsistent histories. [6] [12]
Differential Diagnosis
Start with three questions: Is the measurement real? Is the chart correct for age, sex and prematurity? Is the velocity normal? [1] [8]
Normal variants. Familial short stature: short parents, normal velocity, bone age usually appropriate. Constitutional delay of growth and puberty: delayed tempo, delayed bone age, later catch-up. Parallel low-channel tracking after infancy centile finding is often healthy once technique and mid-parental height fit. [8]
Pathological short stature or faltering. Nutritional insufficiency, malabsorption, chronic cardiorespiratory or renal disease, endocrine disease (GH deficiency, hypothyroidism, Cushing), genetic syndromes, skeletal dysplasia (disproportion), and psychosocial neglect. Poor height velocity is a louder signal than a single low centile. [7] [8]
Tall stature and excess growth. Familial tall stature, early puberty, excess GH states, and overgrowth syndromes. Pubertal staging and velocity prevent over-referral of normal tall families and under-recognition of pathological early growth. [8]
Weight excess. Rising BMI with preserved linear growth is common. Distinguish lifestyle energy imbalance from rare endocrine causes (poor linear growth with weight gain raises endocrine concern). Use verified BMI tools and non-stigmatising language. [10] [11]
Clinical & Bedside Assessment
Measure properly. Infants: supine length with two people, naked or dry-nappy weight, non-elastic tape for OFC above brows and pinnae. Older children: standing height with heels, buttocks and shoulders positioned; shoes off. Plot immediately. Re-measure before you diagnose disease. [1] [8]
Choose the chart. Use WHO standards for young children where policy supports them. In the US recommendation set, use WHO for ages under 24 months and CDC charts from 2 years. UK practice uses UK-WHO tools. Preterm infants need specialty charts early, then transition. Correct age for prematurity in early childhood interpretation as local policy requires. [3] [4] [9]
Mid-parental height. Estimate genetic target height from parental heights (Tanner-style formulas are widely taught). Treat the result as a corridor, not a destiny. Recent work shows formula accuracy is imperfect — use it to ask whether current height is far from family expectation, not as a hard adult-height promise. [8]
Puberty. Stage secondary sexual characteristics when interpreting adolescent growth. A delayed spurt in a boy with delayed puberty is a different problem from GH deficiency. An early spurt with advanced signs needs a different pathway. [8]
Whole-child exam. Look for disproportion, dysmorphism, goitre, chronic disease signs, nutritional status, interaction and safeguarding cues. Review caregiver-held records for prior quality. [8] [12]
Investigations
Many healthy low-channel trackers need no panel. Investigate when velocity is poor, height is far below mid-parental expectation, there are systemic symptoms, or red flags exist. [7] [8]
Reasonable directed first-line tests (context-dependent) include FBC, electrolytes, coeliac serology if gluten-exposed, thyroid function, and inflammatory markers when indicated. Bone age can support tempo assessment but does not alone diagnose GH deficiency. IGF-1, karyotype/genetic tests and GH stimulation belong in a planned pathway, usually with paediatric endocrinology for pathological short stature. Do not shotgun every short child with normal velocity and short parents. [7] [8]
Management — Resuscitation
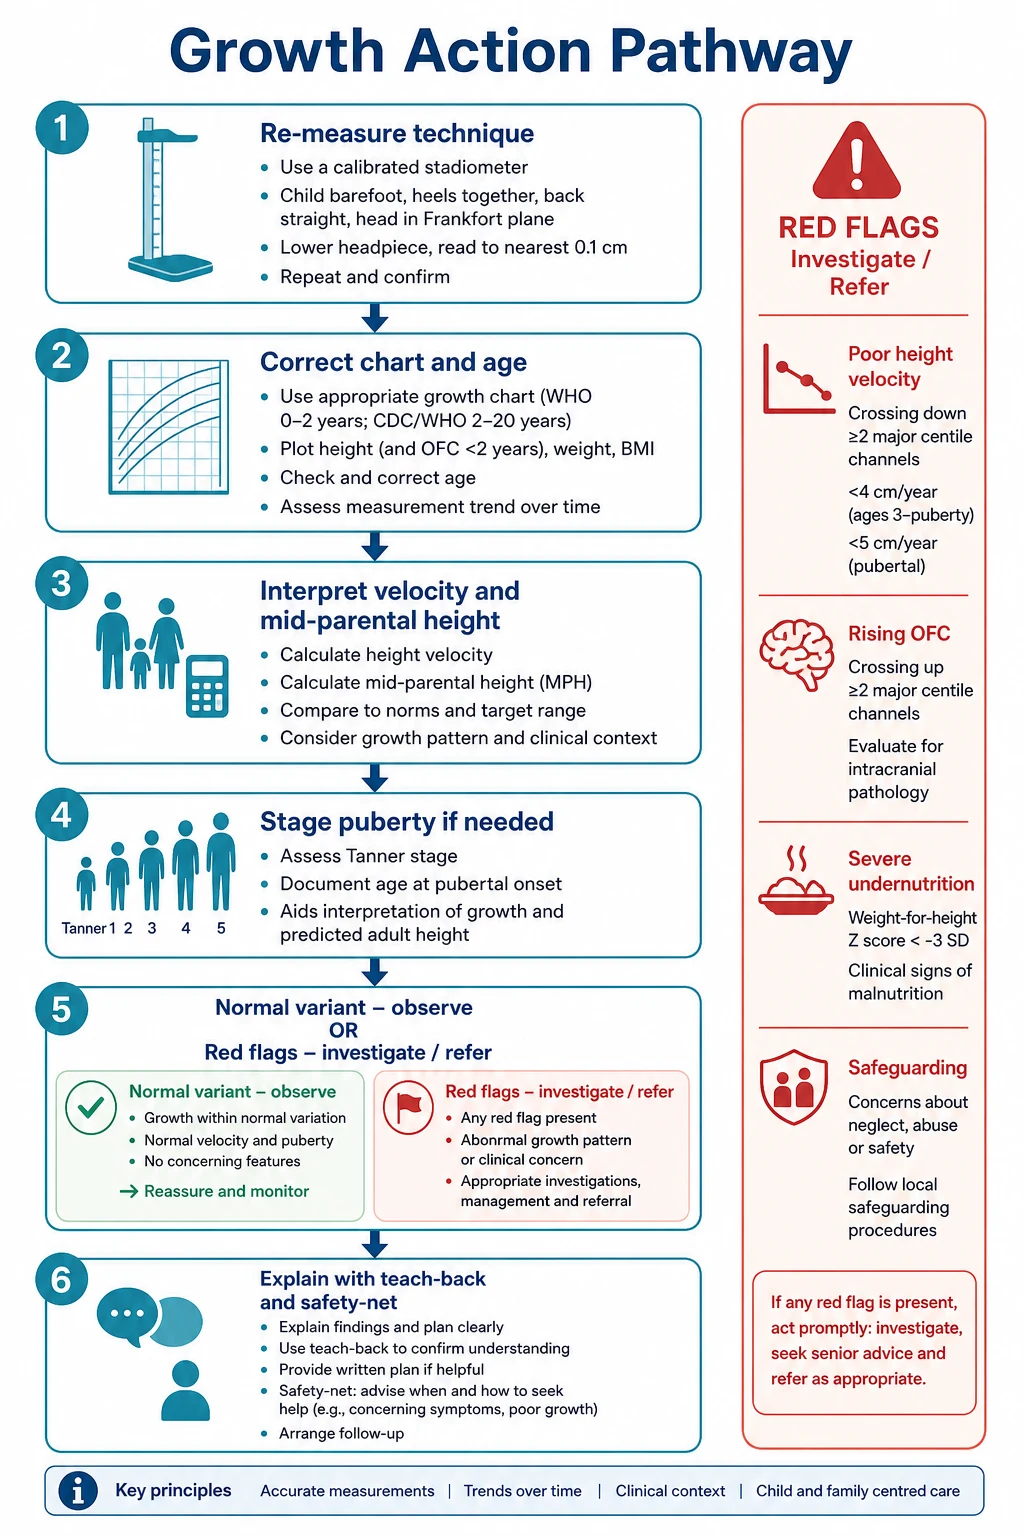
Chart debate waits if the child is unstable. Severe undernutrition with dehydration, hypothermia, hypoglycaemia risk or sepsis signs is acute care first. Rapidly rising OFC with raised intracranial pressure signs needs urgent evaluation. Safeguarding disclosures or severe neglect with faltering require parallel safety actions and trauma-informed practice. [12]
Management — Definitive & Stepwise
- Confirm measurements and plotting quality.
- Name the chart and age basis (including prematurity correction).
- Interpret absolute position, velocity and mid-parental context.
- Stage puberty when relevant.
- Separate normal variant from pathology.
- Support nutrition and social needs early when intake is the driver.
- Refer endocrine, gastroenterology, genetics or safeguarding pathways by pattern.
- Explain the plot with teach-back; set a review date; safety-net return for weight loss, lethargy or developmental concern. [1] [8] [11]
Specific Subtypes & Scenarios
Fetal/SGA pathway. Define birth size carefully. Expect many infants to catch up; monitor those who do not, using international SGA consensus principles for etiology review and long-term follow-up. [6]
Breastfed infant on WHO standards. Falling on an outdated formula-biased reference may be normal WHO tracking. Do not force unnecessary formula top-ups for chart aesthetics. [1]
Ex-preterm. Use preterm tools early; correct age for interpretation; transition to term charts with documented rules. [9]
Familial short stature. Short parents, normal exam, normal velocity — observe and explain. [8]
Constitutional delay. Delayed puberty and delayed bone age with later catch-up — counsel and follow. [8]
Pathological short stature. Height far below −2 SDS with poor velocity — investigate and refer. ISS is only residual after full work-up. [7]
Adolescent BMI rise. Use verified BMI tools, screen for complications as indicated, and avoid shame. AAP evaluation principles guide structured assessment without inventing drug doses here. [10] [11]
Possible neglect. Multi-parameter faltering plus social red flags — stabilise, document, escalate safeguarding. [12]
Complications & Pitfalls
Wrong sex chart. Uncorrected prematurity. Clothes-on weights. Single-point “failure to thrive” labels. Blaming breastfeeding for WHO-normal growth. Over-investigating familial short stature. Under-investigating poor velocity in a “well-looking” child. Stigmatising BMI talk that loses the family. Missing safeguarding. Confusing SGA with FGR. Promising adult height from mid-parental formulas alone. [1] [6] [8]
Prognosis & Disposition
Healthy channel tracking and catch-up after SGA or illness predict better adult height outcomes. Persistent poor velocity loses height potential and needs earlier action. Disposition includes clear review intervals, dietetic or social support, and specialist pathways when indicated. Transition care matters for adolescents with ongoing short stature, delayed puberty, obesity risk or chronic disease. [6] [8]
Special Populations
Preterm and SGA graduates need specialty charting and catch-up surveillance. Children with disability need adapted measurement and, where validated, condition-specific interpretation — still plot and document. Medical complexity needs individual baselines, not generic targets alone. Indigenous families need culturally safe conversations without racialised chart misuse. Refugee children may have interrupted records and dual infection–nutrition risk. Out-of-home care growth is a welfare indicator as well as a medical one. Adolescents need confidential, stigma-aware enquiry about eating and body image. [6] [11] [12]
Evidence, Guidelines & Regional Differences
WHO Multicentre Growth Reference Study standards underpin modern early-childhood charts. [1] WHO 5–19 references extend school-age and adolescent assessment. [2] CDC methods papers document US reference charts. [4] CDC expert recommendations allocate WHO under 24 months and CDC from 2 years in the US set. [3] Karlberg’s model still frames ICP teaching. [5] The 2023 international SGA consensus updates etiology and management from infancy to early adulthood. [6] ISS consensus defines residual short stature after full evaluation. [7] IOTF BMI cut-offs link childhood BMI to adult thresholds. [10] AAP 2023 obesity CPG structures evaluation and treatment principles. [11]
Exam Pearls
- Velocity over single points. [1]
- ICP physiology before label hunting. [5]
- Name the chart (standard vs reference). [1] [4]
- Short stature ≈ >2 SD below mean — pair with mid-parental height and velocity. [8]
- ISS is residual after full evaluation, not a first impression. [7]
- SGA is birth size; FGR is a fetal process. [6]
- US split: WHO <24 months, CDC from 2 years. [3]
- Blame measurement first, disease second, family never. [1] [12]
Short stature gates and chart splits must be stated with velocity, mid-parental height and the named tool. [3] [7] [8]
References
- [1]WHO Multicentre Growth Reference Study Group WHO Child Growth Standards based on length/height, weight and age. Acta paediatrica (Oslo, Norway : 1992). Supplement, 2006.PMID 16817681
- [2]de Onis M Development of a WHO growth reference for school-aged children and adolescents. Bulletin of the World Health Organization, 2007.PMID 18026621
- [3]Grummer-Strawn LM Use of World Health Organization and CDC growth charts for children aged 0-59 months in the United States. MMWR. Recommendations and reports : Morbidity and mortality weekly report. Recommendations and reports, 2010.PMID 20829749
- [4]Kuczmarski RJ 2000 CDC Growth Charts for the United States: methods and development. Vital and health statistics. Series 11, Data from the National Health Survey, 2002.PMID 12043359
- [5]Karlberg J Analysis of linear growth using a mathematical model. I. From birth to three years. Acta paediatrica Scandinavica, 1987.PMID 3604665
- [6]Hokken-Koelega ACS International Consensus Guideline on Small for Gestational Age: Etiology and Management From Infancy to Early Adulthood. Endocrine reviews, 2023.PMID 36635911
- [7]Cohen P Consensus statement on the diagnosis and treatment of children with idiopathic short stature: a summary of the Growth Hormone Research Society, the Lawson Wilkins Pediatric Endocrine Society, and the European Society for Paediatric Endocrinology Workshop. The Journal of clinical endocrinology and metabolism, 2008.PMID 18782877
- [8]Barstow C Evaluation of Short and Tall Stature in Children. American family physician, 2015.PMID 26132126
- [9]Fenton TR A systematic review and meta-analysis to revise the Fenton growth chart for preterm infants. BMC pediatrics, 2013.PMID 23601190
- [10]Cole TJ Establishing a standard definition for child overweight and obesity worldwide: international survey. BMJ (Clinical research ed.), 2000.PMID 10797032
- [11]Hampl SE Clinical Practice Guideline for the Evaluation and Treatment of Children and Adolescents With Obesity. Pediatrics, 2023.PMID 36622115
- [12]Forkey H Trauma-Informed Care. Pediatrics, 2021.PMID 34312292