Paeds · preventive-and-community-paediatrics
Population health, epidemiology and prevention in paediatrics
Also known as Paediatric population health · Child health epidemiology · Primary secondary tertiary prevention children · Rose prevention paradox paediatrics · Haddon matrix children
Fellowship foundation on population health, epidemiology and prevention in paediatrics: defining populations and outcomes, incidence and risk measures, primary secondary tertiary prevention, Rose population strategy, Haddon matrix, life-course and social determinants, herd immunity concepts, equity metrics, and bedside-to-system action without duplicating screening, injury, housing or immunisation schedule leaves.
On this page & tools
Your progress
Saved locally on this device.
Practise this topic
Target exams
Red flags
Life stages
Care settings
Clinical exam formats
Board mappings
Overview & Definition
A registrar reviews a practice dashboard: immunisation coverage is “good,” yet three children on the panel have incomplete schedules and one has just been admitted with a vaccine-preventable infection. That gap is the whole topic. Population health asks what happens to a defined group of children and whether the gains are shared fairly—not only what happens in a single consultation. [1] [2] [25]
Kindig’s widely used definition is practical: population health is the health outcomes of a group of individuals, including the distribution of such outcomes within the group. For paediatrics the “group” might be every child attached to your medical home, every Year 1 pupil in a school catchment, every neonate born in a district, or every child living in a postcode with high injury admissions. If you cannot name the group and the denominator, you are not doing population work—you are listing anecdotes. [1] [2] [26]
Epidemiology is the method set: counting new and existing disease, comparing rates, estimating risk and asking whether an association is likely causal enough to act on. Prevention is the action set: stop disease before it starts, find it early when early action helps, or limit disability after diagnosis. Public health often names the organised system that delivers those actions at scale. You need all three words, but they are not synonyms. [2] [3] [22]
Five questions before any population-health claim
Who is the population?
Name the group and the denominator (panel, school, district, equity group).
What outcome matters?
Death, disability, infection, injury, development, missed care—be specific.
What measure?
Incidence, prevalence, coverage, rate difference, absolute risk—not a vague trend.
How is it distributed?
Who bears more harm: age, place, poverty, Indigeneity, disability, mobility?
What lever can change it?
Primary, secondary or tertiary; population-wide or high-risk; clinic or system.
Classification
Start with the child problem, then name the prevention level and the strategy. Classification changes what you offer and how you audit success. [3] [4]
Prevention levels
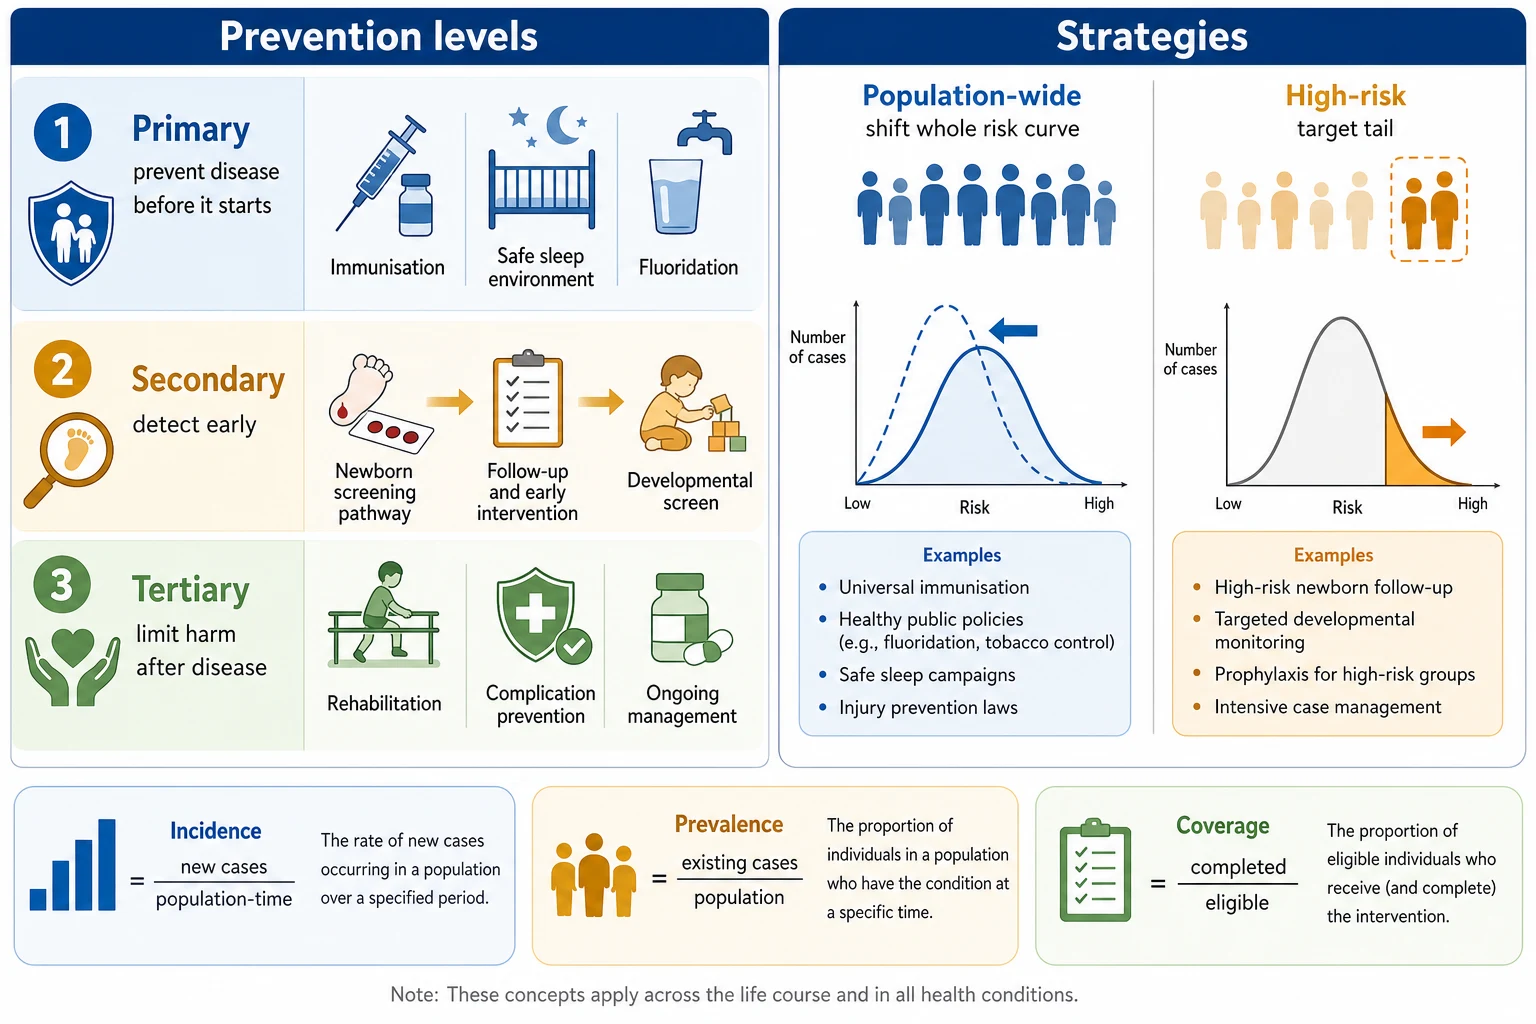
Primary prevention stops the condition from occurring: immunisation, safe sleep environments, water fluoridation, product standards that remove a hazard, and many injury-prevention environment changes. [3] [4] [17]
Secondary prevention finds disease or risk early in apparently well children when early action improves outcome: newborn bloodspot and hearing pathways, selected developmental tools, and other programme screens. Screening is a programme, not a laboratory slip—detail lives on the screening-principles sibling page. [20] [21] [22]
Tertiary prevention reduces complications and disability after disease is established: complication surveillance in chronic illness, rehabilitation after injury, and secondary cardiac prevention in selected high-risk children. [3]
Population-wide versus high-risk strategies
Rose’s classic insight still drives exams. Most cases of common problems arise from the large middle of the risk distribution, not only from the extreme high-risk tail. A small shift in the whole population’s risk can prevent more cases than intensive care aimed only at the highest-risk individuals. The prevention paradox follows: a measure that brings large population benefit may offer little obvious benefit to each participating individual. [3]
High-risk strategies still matter when risk is concentrated, when the intervention is intensive or harmful if misapplied, or when equity demands targeted outreach. Good programmes often combine both: population immunisation plus catch-up for under-covered groups; population safe-product standards plus home visits for high-risk infants. [3] [16]
| Term | Bedside meaning | Exam trap |
|---|---|---|
| Incidence | New cases in a population over time | Confusing with prevalence |
| Prevalence | Existing cases at a time or period | Using it as a speed of spread |
| Coverage | Completed offer among eligible children | Counting “offered” as “done” |
| Absolute risk | Chance of the outcome in plain numbers | Ignoring baseline risk |
| Relative risk | How many times higher risk is | Scaring families without absolute numbers |
| Population attributable fraction | Share of cases linked to an exposure | Treating it as individual destiny |
Population strategy
Shift the whole curve
- Many moderate-risk children
- Often environment or policy levers
- Prevention paradox common
- Needs equity design
High-risk strategy
Target the tail
- Higher individual benefit
- Needs accurate risk tools
- Misses cases outside the tail
- Can widen gaps if access is hard
Clinical care only
One child, one visit
- Essential but incomplete
- Misses non-attenders
- Hard to move population rates
- Still uses epi thinking
Epidemiology & Risk Factors
There is no single paediatric “rate” that proves a system is healthy. Global burden work shows that causes of death and disability in children vary sharply by age and place: infectious and neonatal conditions still dominate in many low-resource settings, while injuries, chronic conditions, developmental problems and mental health weigh heavily where under-five mortality has fallen. Use GBD-style thinking to compare patterns—not to invent a local number from memory. [18] [19]
Fine-scale mapping of child deaths shows that national averages hide subnational hotspots. The same lesson applies inside a rich city: one postcode can carry far more injury admissions or incomplete immunisation than the hospital average. [19]
Risk clusters along social gradients. Poverty, housing quality, food security, parental education, neighbourhood safety and discrimination shape infection, injury, development and chronic disease risk. Adolescence adds peer environments, education systems and emerging autonomy as determinants in their own right. [9] [10] [14] [27]
Life-course epidemiology links fetal growth, early adversity, school years and adolescence into trajectories of later adult disease. Exposures do not only act in the week of the clinic visit; they accumulate and interact. That is why early prevention and equity work are paediatric core business, not “someone else’s public health.” [7] [8] [11]
Clinic-based samples mislead when non-attenders differ from attenders. Children in out-of-home care, mobile migrant families and rural households may be invisible on a tidy dashboard. Incomplete denominators create false reassurance. [15] [16] [25]
Commercial and defensive culture can inflate low-value testing at population scale. Detection without better outcomes is not success; European paediatric statements warn against overtesting and overtreatment. [22] [24] [30]
Pathophysiology
Think in three linked mechanisms: how risk is distributed in a population, how early adversity embeds biology, and how hazards produce injury or infection events. [3] [4] [11]
Risk curves and case counts
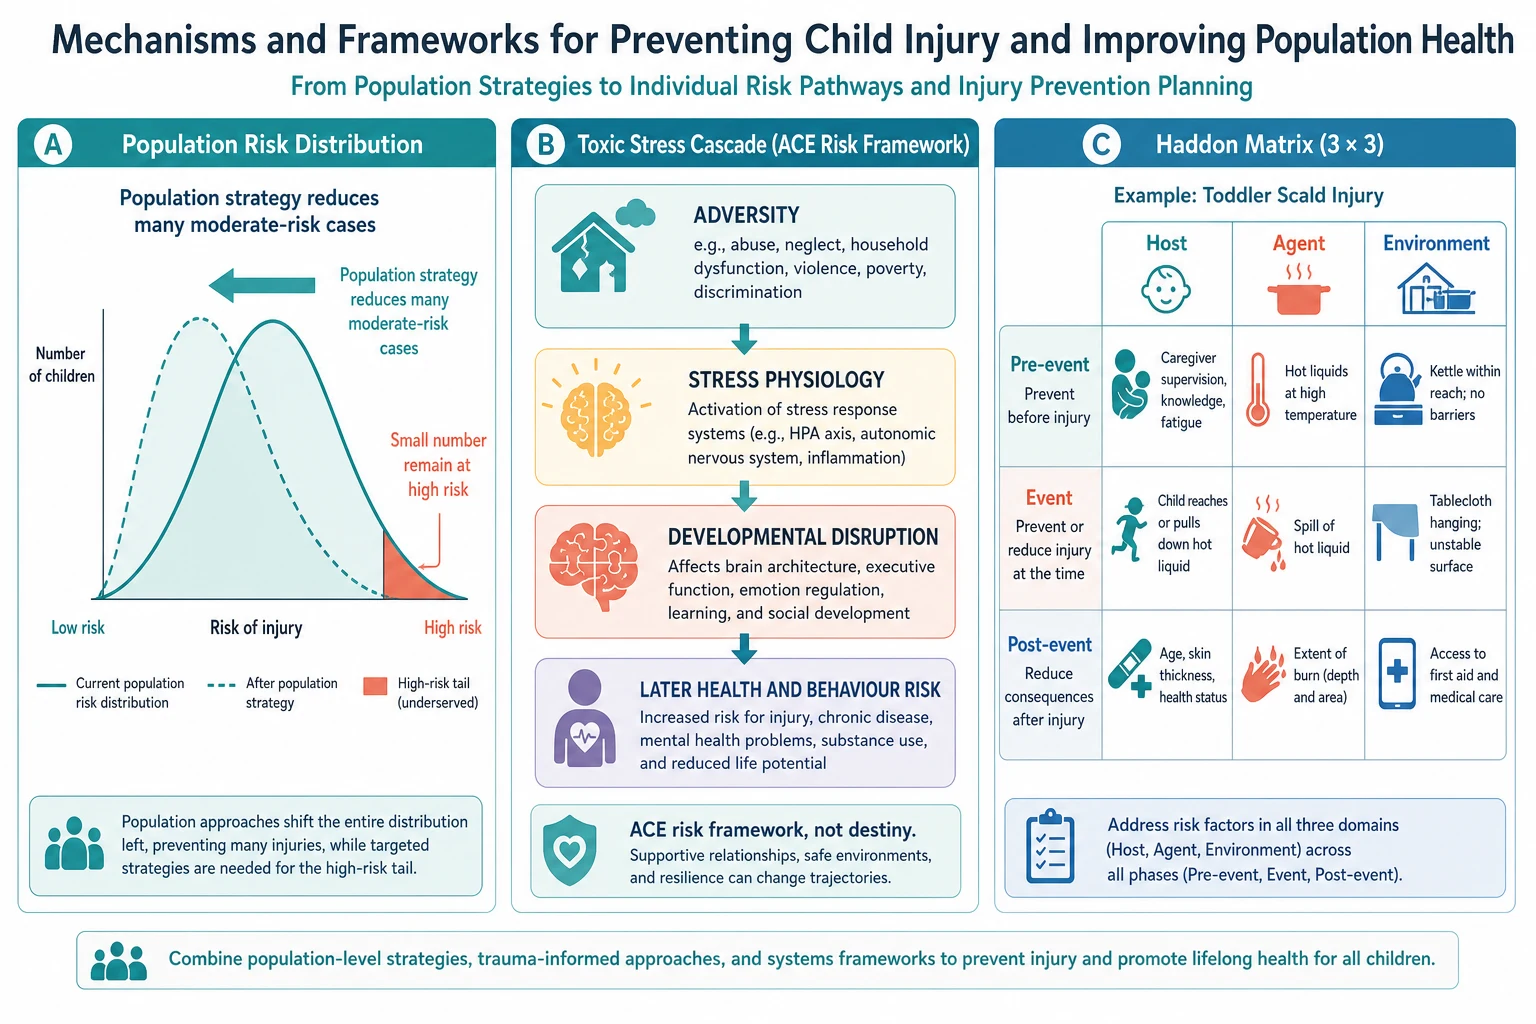
If blood pressure, body mass, or injury opportunity shifts a little for everyone, many moderate-risk children move enough to prevent large numbers of events. Treating only the extreme tail leaves most future cases untouched. That is the mathematical heart of Rose’s argument. [3]
Toxic stress and life-course embedding
Severe, prolonged or repeated adversity without buffering adult support—toxic stress—can alter stress physiology, behaviour regulation and later cardio-metabolic and mental-health risk. The ACE study linked childhood household dysfunction and abuse to adult disease burden; paediatric statements translate that science into a call for prevention, family support and trauma-informed care—not for scoring children as doomed. [11] [12] [13]
Haddon’s injury mechanism
Haddon framed injury as an epidemiologic event with a host (child), agent (energy or hazard) and environment, examined before, during and after the event. That matrix turns “be careful” into design: product standards, barriers, supervision supports, emergency response and rehabilitation. Runyan later stressed decision dimensions such as equity, cost and feasibility when choosing cells to act on. [4] [5] [29]
Causal inference without magical thinking
Bradford Hill’s viewpoints—strength, consistency, specificity, temporality, biological gradient, plausibility, coherence, experiment and analogy—help you weigh whether an association deserves action. They are aids to judgment, not a pass/fail checklist. Temporality and experimental or quasi-experimental evidence often carry the most clinical weight. Association alone is not mechanism. [6]
Herd immunity as population physiology
When enough people are immune, transmission chains die out and even some unprotected individuals gain indirect protection. Thresholds depend on transmissibility, vaccine effectiveness, contact patterns and clustering. Herd immunity is a population property; it does not guarantee safety for one unvaccinated child inside an under-vaccinated social network. [17]
Lead-time and length-time bias matter when early detection is sold as population success: earlier labels can look like longer survival without changing the disease course, and screening prefers slower cases. Demand outcome benefit, not detection alone. [22] [30]
Clinical Presentation
Population health “presents” as patterns, not as a rash. You meet it when several children from one childcare centre share a notifiable infection, when a suburb’s scooter injuries climb, when immunisation coverage looks fine until you stratify by language or housing status, or when a family arrives after a relative-risk headline and asks for every possible blood test. [17] [25] [28]
Failing medical-home panels present as high no-show rates, incomplete newborn screen follow-up, missing adolescent confidential care, and repeated injury without environmental change. Inequity often presents as late diagnosis rather than a single rare disease label. [15] [16] [26]
Adolescents may present population risks through self-harm ideation, road injury, substance use or sexual-health needs. Confidentiality, school context and social determinants sit inside the history, not as an afterthought. [8] [27]
Differential Diagnosis
When a rate rises, separate true increase in disease from better testing, coding change, population growth, seasonal swing or a data artefact. When a family quotes a scary relative risk, separate a real absolute risk that changes decisions from marketing noise. [2] [6] [18]
Distinguish individual clinical disease needing immediate care from a cluster needing public-health notification and contact management. Distinguish high individual clinical risk (this child needs intensive support) from high population burden (most cases sit in the moderate middle and need structural levers). Distinguish high-value programme screening from low-value multi-panels that fail pathway and net-benefit criteria. [3] [20] [21] [24]
Never let population thinking close the differential for the sick child in front of you. A prior negative screen or a “low-risk postcode” does not explain away meningitis, non-accidental injury or metabolic crisis. [22] [23]
Clinical & Bedside Assessment
Say the five questions out loud: population, outcome, measure, distribution, lever. If any answer is fuzzy, fix the question before you design an intervention. [1] [2]
Take a usable social and environmental history: housing stability, food security, transport, school attendance, caregiver mental health, community violence exposure and prior programme access. Ask with purpose and offer help; do not collect trauma details you cannot act on. Poverty-related screening tools exist, but the skill is linking answers to real resources. [14] [15] [16]
Check understanding of risk language. Prefer absolute numbers over “three times higher.” Check whether a promised screen or vaccine catch-up actually has a pathway your service can complete. [22] [23]
Document the offer, the decision, the follow-up owner and any equity barrier you could not solve today. Incomplete follow-up after a prevention flag is a safety issue. [21] [25]
Investigations
Here “investigations” means how you interrogate data and test claims—not a blood panel for every well child. [2] [25]
Reading a rate
Demand numerator, denominator, time window and case definition. Ask whether the denominator includes the children who never attend. Ask whether confidence intervals or small counts make the estimate fragile. [2] [18]
Coverage and equity
Coverage is completed action among eligible children. Stratify by age, geography, Indigeneity, language, disability and care status when the data allow. An unstratified “90%” can hide a 60% subgroup. [16] [17] [25]
Screening metrics versus prevention metrics
Sensitivity, specificity and predictive values judge a test; coverage, time-to-treatment and outcome rates judge a prevention programme. Use the right tool. Low-prevalence screens crush positive predictive value—see the screening-principles sibling page for the mathematics. [20] [21] [23]
Data sources
Useful sources include notifiable disease systems, immunisation registers, hospitalisation datasets, death registration, school health data, practice panels and global burden estimates. Each has bias. Clinic electronic records are powerful for panel management and weak as a complete community census. [18] [25] [26]
Harmful “investigations”
Unvalidated commercial multi-disease panels sold as population screening without confirmatory pathways manufacture anxiety and cascade testing. Overtesting statements apply in paediatrics too. [22] [24] [30]
Management — Resuscitation
Population frameworks do not override ABCDE. A child with suspected sepsis, major trauma or severe dehydration needs resuscitation first. Prior “screen negative,” “low-risk suburb,” or incomplete immunisation history is background, not a shield. [17] [26]
Time-critical population events still exist: a measles exposure in a neonatal unit, a cluster of meningococcal disease, or a critically actionable newborn screen result. Stabilise the child, notify the responsible public-health or specialist pathway, and protect contacts according to local protocols. Do not invent disease-specific drug doses on this foundation page—use the condition pathway. [17] [21]
Severe parental distress after a media scare or unexpected result is a clinical problem. Sit down, translate absolute risk, name the next concrete step, and stop coercive sales of low-value testing. [22] [24]
Management — Definitive & Stepwise
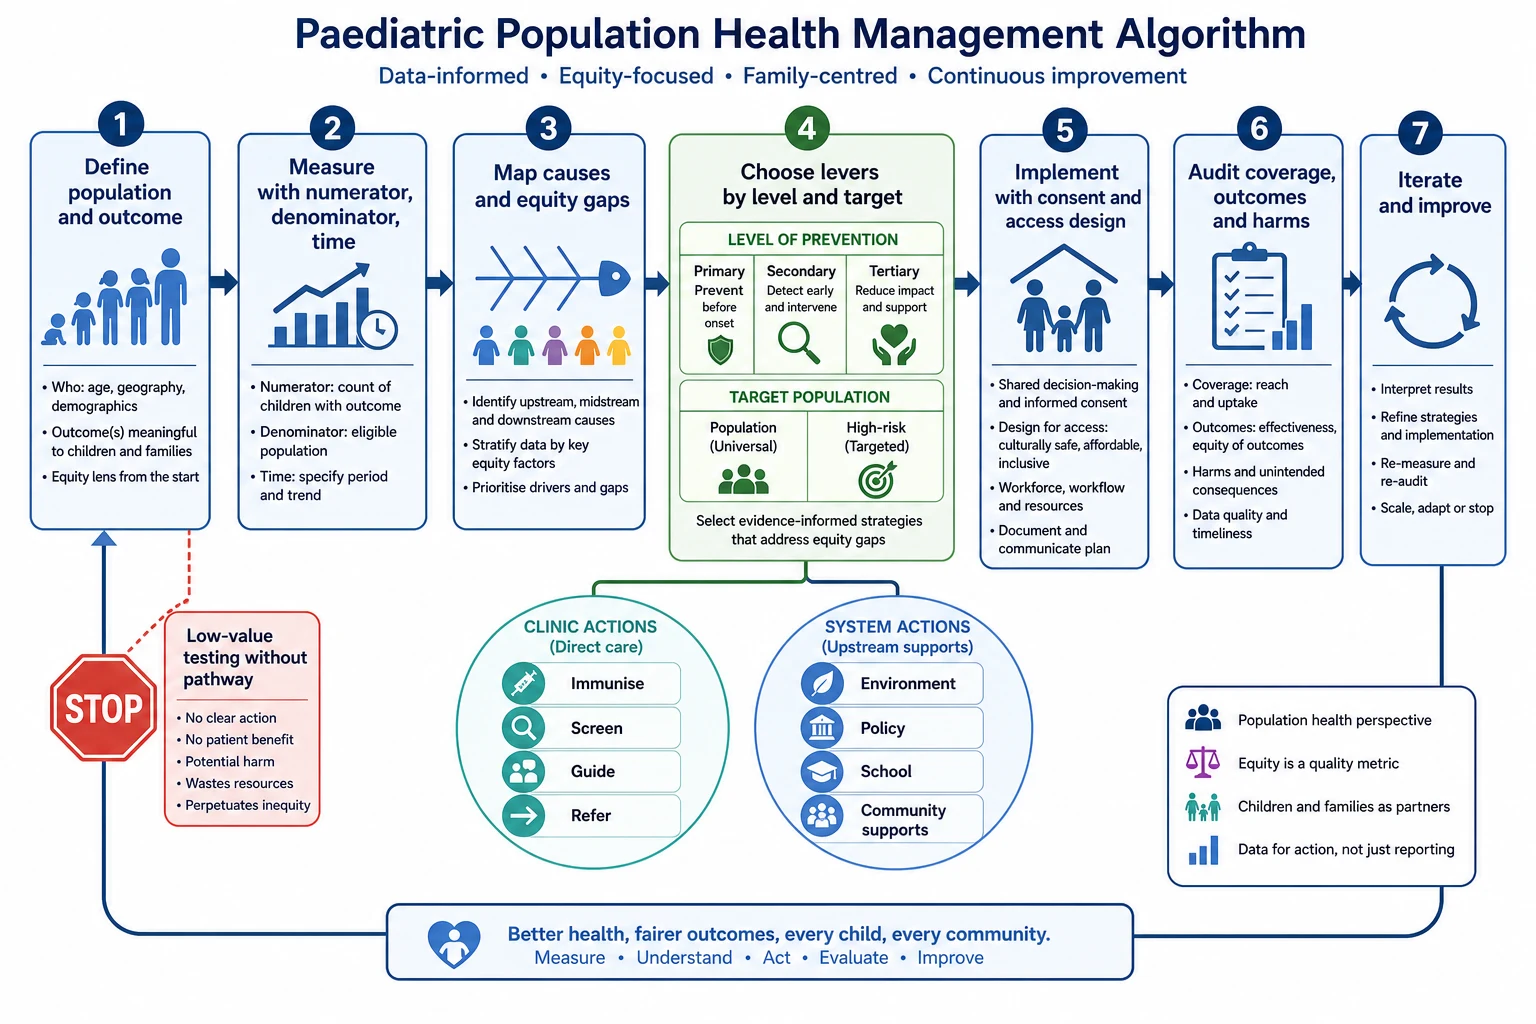
Work in order. Define the child population and the outcome that matters. Measure with numerator, denominator, time and case definition. Map causes across host, agent and environment and across social determinants. Choose primary, secondary and tertiary levers, and decide where population-wide action, high-risk targeting or both fit. Implement with informed consent, accessible delivery and a named owner for follow-up. Audit coverage, outcomes, harms and equity stratifiers. Iterate or stop what fails net benefit. [1] [3] [4] [5] [9] [21] [25]
Clinic actions that scale
In the medical home: complete immunisation and catch-up; offer high-value programme screens with pathway readiness; deliver age-banded anticipatory guidance including injury prevention; ask about poverty-related needs and connect to real supports; redesign visit flow for low-income families when no-show and incomplete care dominate. [14] [15] [16] [26] [28]
System actions you must name in exams
Environment and product standards, school policies, housing and food systems, immunisation programme governance, injury policy assessment and public-health surveillance all move population curves more than a single leaflet. The paediatrician’s role is clinician, data user and advocate—not sole system owner. [4] [9] [10] [29]
Counselling scripts examiners want
Absolute risk: “For children like yours, the chance is about X in 1,000 without this step and about Y in 1,000 with it. That is a difference of Z children per 1,000.” Avoid relative-risk-only scare language. [3] [23]
Herd immunity: “When enough of the community is protected, the germ spreads less, which helps babies too young to be fully vaccinated. It is not a personal force field if your local network is under-vaccinated.” [17]
Decline without coercion: “You can decline. I will explain what we might miss, record your decision, and leave the door open. I will not pressure you or invent false certainty.” [21] [22]
When not to start a population offer
If detection will not change action, if pathway capacity is fantasy, if harms dominate, or if a commercial panel is sold without programme evidence—do not start. “We can measure it” is not a criterion. [20] [21] [24] [30]
Specific Subtypes & Scenarios
Immunisation and herd immunity. Classic primary prevention with both individual and population benefit. Coverage, clustering and catch-up matter as much as the schedule itself; schedule detail sits on the immunisation sibling page. [17]
Injury prevention and Haddon thinking. Build the matrix for the hazard in front of you (scald, road, drowning, fall). Prefer environment and product levers that do not rely on perfect vigilance. Mechanism-specific algorithms live on injury leaves. [4] [5] [28] [29]
Screening as secondary prevention. Apply programme criteria, prevalence-aware predictive values and confirmatory pathways. Do not clone bloodspot or hearing algorithms here. [20] [21] [22]
Poverty, food and housing. Treat social risk as clinical data. Screen with a plan to help; redesign care access; link to advocacy and housing-food sibling depth. [14] [15] [16]
Toxic stress and ACE-informed care. Prevent and buffer adversity; support caregivers; avoid deterministic scoring theatre. [11] [12] [13]
Adolescent population risks. Confidential services, school environments and social determinants shape outcomes beyond the clinic room. [8] [27]
Clusters and outbreaks. Confirm case definitions, notify, protect contacts, communicate clearly, and keep caring for the index child. [17]
Practice-panel informatics. Use registries to find care gaps, but validate data and design outreach for non-attenders. [25] [26]
Global child mortality inequity. National averages hide hotspots; prevention priorities follow local epidemiology. [18] [19]
Complications & Pitfalls
Common pitfalls include confusing incidence with prevalence; treating association as proven causation; ignoring the prevention paradox and only treating high-risk tails; screening without pathway capacity; blaming families for structural risks; using ACE scores as destiny; celebrating unstratified coverage that hides equity gaps; running surveillance without action; and expanding low-value testing because technology can. [2] [3] [6] [9] [12] [13] [21] [24] [30]
Prognosis & Disposition
For a child, prognosis tracks timely clinical care, completed prevention steps and social supports that make adherence possible. For a programme, success is fewer preventable events, acceptable harms, equitable coverage and sustainable follow-up—not the number of abnormalities detected. [3] [18] [21] [30]
After a resolved false-positive screen or a media scare, disposition includes clear language that the child does not have the feared disease, optional psychosocial support, and return to usual care without indefinite limbo. If a local service cannot deliver a promised pathway, disposition is transfer, telehealth specialist access, or deliberate non-offer—not a hopeful letter with no appointment. [21] [22]
Special Populations
Fetal and neonatal life. Timing windows for screens, maternal exposures and perinatal infection risk make early life a high-yield prevention period; NICU epidemiology differs from well-baby clinic data. [7] [20]
Medical complexity and disability. Baseline differences change what “abnormal” means; population tools must not misclassify or exclude. [24] [26]
Indigenous children. Equity-focused design, trust and culturally safe services matter; specialist Indigenous and Māori leaves own cultural models. Same policy offer is not the same access. [9] [10]
Migrant and refugee families. Reconstruct overseas prevention history; offer catch-up without assuming complete records. [15] [16]
Out-of-home care and youth justice. Clarify consent, ensure a durable medical home, and chase incomplete follow-up. [14] [26]
Adolescents and transition. Autonomy, confidentiality and school determinants reshape population offers. [8] [27]
Rural and remote. Travel and workforce gaps break confirmatory steps after a first test; design telehealth and outreach into the pathway. [16] [25]
Socioeconomic disadvantage. Missed appointments after a flag are a safety issue; offline recall and redesigned well-child care improve reach. [14] [16]
Evidence, Guidelines & Regional Differences
Global intellectual spine. Kindig defines population health as outcomes plus distribution. Rose explains population versus high-risk strategy and the prevention paradox. Haddon and Runyan structure injury prevention. Hill’s viewpoints discipline causal claims. Kuh and Viner frame life-course timing, including adolescence. Marmot centres social determinants and fairer distribution of the conditions for health. Shonkoff, Garner and Felitti connect early adversity biology to paediatric roles. Fine clarifies herd immunity. GBD and fine-scale mortality mapping frame burden without replacing local data. Screening methods papers (Andermann, Dobrow, Grimes, Harris) and EAP overtesting statements police secondary prevention excess. [1] [2] [3] [4] [5] [6] [7] [8] [9] [10] [11] [12] [13] [17] [18] [19] [20] [21] [22] [24] [30]
Australia / Aotearoa New Zealand. Jurisdiction-organised immunisation, newborn screening and public-health notification systems sit beside medical-home and community child-health services. Teach principles and check current local schedules and notification lists; do not freeze another country’s product list as law. [17] [20] [25]
United Kingdom. National screening appraisal language and public-health structures emphasise programme-level viability and equity; use that governance framing in UK exams. [21] [30]
United States. USPSTF-style methods shape many preventive recommendations; AAP medical-home and poverty statements guide paediatric practice redesign; state and local public-health capacity varies. [14] [16] [26] [30]
Canada. Provincial and territorial delivery varies; shared principle language from methods papers still applies. [21]
Controversies. Expanded genomic newborn sequencing, commercial multi-test panels, ACE scoring as a clinical product, and equity-blind “universal” offers that leave the same families behind all force the same question: does the action improve child outcomes enough, for whom, and with what harm? [12] [13] [20] [24]
Use jurisdictional immunisation, newborn screening and notifiable-disease systems as the operational spine. Verify current local schedules and pathways rather than memorising another country’s list. [17] [20]
Programme appraisal language (viability, effectiveness, appropriateness, equity) is the exam-safe frame before claiming population benefit from a new offer. [21] [30]
USPSTF-style evidence methods, medical-home population panels and AAP poverty guidance are high-yield US teaching anchors; Canadian delivery is provincial with shared principle language. [14] [21] [26] [30]
Exam Pearls
- Population health = outcomes + distribution in a named group. [1]
- Numerator, denominator, time, case definition — say them every time. [2]
- Incidence is new; prevalence is existing. [2]
- Absolute risk decides; relative risk can scare. [3] [23]
- Rose: shifting the whole curve often beats only treating the tail; name the prevention paradox. [3]
- Primary / secondary / tertiary with a paediatric example each. [3]
- Haddon matrix: host–agent–environment × pre/event/post. [4] [5]
- Herd immunity is population protection, not a personal guarantee in a clustered network. [17]
- ACE/toxic stress is a risk framework, not destiny. [11] [12] [13]
- No pathway, no population screen. [20] [21]
- Same offer ≠ same access or same benefit. [9] [16]
- Name the jurisdiction before quoting a programme metric. [18] [21]
POPDEN before you act
Population named · Outcome clear · Prevention level chosen · Denominator real · Equity checked · Net benefit after harms
References
- [1]Kindig D What is population health? Am J Public Health, 2003.PMID 12604476
- [2]Kindig DA Understanding population health terminology Milbank Q, 2007.PMID 17319809
- [3]Rose G Sick individuals and sick populations Int J Epidemiol, 1985.PMID 3872850
- [4]Haddon W Jr Advances in the epidemiology of injuries as a basis for public policy Public Health Rep, 1980.PMID 7422807
- [5]Runyan CW Using the Haddon matrix: introducing the third dimension Inj Prev, 1998.PMID 9887425
- [6]Hill AB The environment and disease: association or causation? 1965 J R Soc Med, 2015.PMID 25572993
- [7]Kuh D Life course epidemiology J Epidemiol Community Health, 2003.PMID 14573579
- [8]Viner RM Life course epidemiology: recognising the importance of adolescence J Epidemiol Community Health, 2015.PMID 25646208
- [9]Marmot M Social determinants of health inequalities Lancet, 2005.PMID 15781105
- [10]Marmot M Fair society, healthy lives Public Health, 2012.PMID 22784581
- [11]Shonkoff JP The lifelong effects of early childhood adversity and toxic stress Pediatrics, 2012.PMID 22201156
- [12]Garner AS Early childhood adversity, toxic stress, and the role of the pediatrician: translating developmental science into lifelong health Pediatrics, 2012.PMID 22201148
- [13]Felitti VJ Relationship of childhood abuse and household dysfunction to many of the leading causes of death in adults. The Adverse Childhood Experiences (ACE) Study Am J Prev Med, 1998.PMID 9635069
- [14]Council on Community Pediatrics Poverty and Child Health in the United States Pediatrics, 2016.PMID 26962238
- [15]Berman RS Screening for Poverty and Poverty-Related Social Determinants of Health Pediatr Rev, 2018.PMID 29716966
- [16]Coker TR Well-child care clinical practice redesign for serving low-income children Pediatrics, 2014.PMID 24936004
- [17]Fine P Herd immunity: a rough guide Clin Infect Dis, 2011.PMID 21427399
- [18]GBD 2021 Diseases and Injuries Collaborators Global incidence, prevalence, years lived with disability (YLDs), disability-adjusted life-years (DALYs), and healthy life expectancy (HALE) for 371 diseases and injuries in 204 countries and territories and 811 subnational locations, 1990-2021: a systematic analysis for the Global Burden of Disease Study 2021 Lancet, 2024.PMID 38642570
- [19]Burstein R Mapping 123 million neonatal, infant and child deaths between 2000 and 2017 Nature, 2019.PMID 31619795
- [20]Andermann A Revisiting Wilson and Jungner in the genomic age: a review of screening criteria over the past 40 years Bull World Health Organ, 2008.PMID 18438522
- [21]Dobrow MJ Consolidated principles for screening based on a systematic review and consensus process CMAJ, 2018.PMID 29632037
- [22]Grimes DA Uses and abuses of screening tests Lancet, 2002.PMID 11897304
- [23]Akobeng AK Understanding diagnostic tests 1: sensitivity, specificity and predictive values Acta Paediatr, 2007.PMID 17407452
- [24]Størdal K Overtesting and overtreatment-statement from the European Academy of Paediatrics (EAP) Eur J Pediatr, 2019.PMID 31506723
- [25]Webber EC Population Health and Pediatric Informatics Pediatr Clin North Am, 2016.PMID 27017031
- [26]Medical Home Initiatives for Children With Special Needs Project Advisory Committee The medical home Pediatrics, 2002.PMID 12093969
- [27]Viner RM Adolescence and the social determinants of health Lancet, 2012.PMID 22538179
- [28]Burr WH Pediatrician-Reported Injury Prevention Anticipatory Guidance by Patient Age Group Acad Pediatr, 2023.PMID 36682449
- [29]Alonge O A systematic approach to injury policy assessment: introducing the assessment of child injury prevention policies (A-CHIPP) Inj Prev, 2019.PMID 29101188
- [30]Harris R Reconsidering the criteria for evaluating proposed screening programs: reflections from 4 current and former members of the U.S. Preventive services task force Epidemiol Rev, 2011.PMID 21666224