Paeds · professional-practice-and-evidence
Diagnostic accuracy and screening statistics
Also known as Sensitivity and specificity in paediatrics · Predictive value and the effect of prevalence · Likelihood ratios and Bayes in diagnostic testing · ROC curves and diagnostic test performance · Screening principles and screening bias · QUADAS-2 and STARD appraisal of diagnostic studies
Fellowship guide to diagnostic accuracy and screening statistics in child health: the 2x2 table, sensitivity, specificity and predictive values and why prevalence governs predictive value, positive and negative likelihood ratios, Bayes and the Fagan nomogram, receiver operating characteristic curves, the Wilson and Jungner principles of screening, the biases that fake a screening benefit (lead-time, length-time, overdiagnosis, volunteer bias), and the appraisal of diagnostic accuracy studies with QUADAS-2 and STARD — applied to newborn bloodspot, hearing and developmental screening.
On this page & tools
Your progress
Saved locally on this device.
Practise this topic
Target exams
Red flags
Life stages
Care settings
Clinical exam formats
Board mappings
Which test does what at the bedside
Overview & Definition
A baby's newborn bloodspot screen comes back abnormal, and the parents ask, through tears, whether their child has the disease. The technician on the phone has quoted a test sensitivity and specificity, but those numbers are not the answer the family needs. They need a probability: given this positive result, how likely is it that their baby is truly affected? That single question — the move from how good the test is to how likely the disease is in this child — is the whole point of diagnostic accuracy statistics. [1] [4]
A diagnostic accuracy study compares a test (the index test) against a reference standard — the best available method for establishing whether the disease is truly present — in the same group of patients, and reports how closely the two agree. The agreement is summarised in a 2×2 table that sorts every patient into one of four boxes: true positive, false positive, false negative, or true negative. From those four boxes come every measure you will meet in this topic: sensitivity, specificity, predictive values, and likelihood ratios. [2] [3]
There is a second, larger question that shares the same machinery. A screening test is offered to people who look and feel well, in order to find unsuspected disease whose early treatment changes the outcome — newborn bloodspot screening for phenylketonuria, automated auditory brainstem response screening for permanent childhood hearing impairment, the M-CHAT-R for autism. Screening sits inside the same 2×2 table, but it carries an extra burden of proof: because serious disease is rare in well children, the same test that performs beautifully in a clinic can flood a population with false positives, and because screening finds disease earlier and slower, it can manufacture the illusion of benefit even when no child is saved. [13]
So the work on this page has two halves. First, the measures of test performance — how to build the 2×2 table, derive sensitivity and specificity, watch predictive values bend with prevalence, and turn the result into a probability shift with likelihood ratios and a receiver operating characteristic curve. Second, the logic and the biases of screening — the Wilson and Jungner principles, the four biases that fake a survival benefit, and the QUADAS-2 and STARD tools that keep diagnostic studies honest. Cross-link the dedicated evidence-based medicine leaf for the broader appraisal engine; this page owns only the diagnostic-test statistics. [4] [9]
Classification
Every diagnostic accuracy statistic lives inside one 2×2 table, so learn the table first and the rest follows. [1] [4]
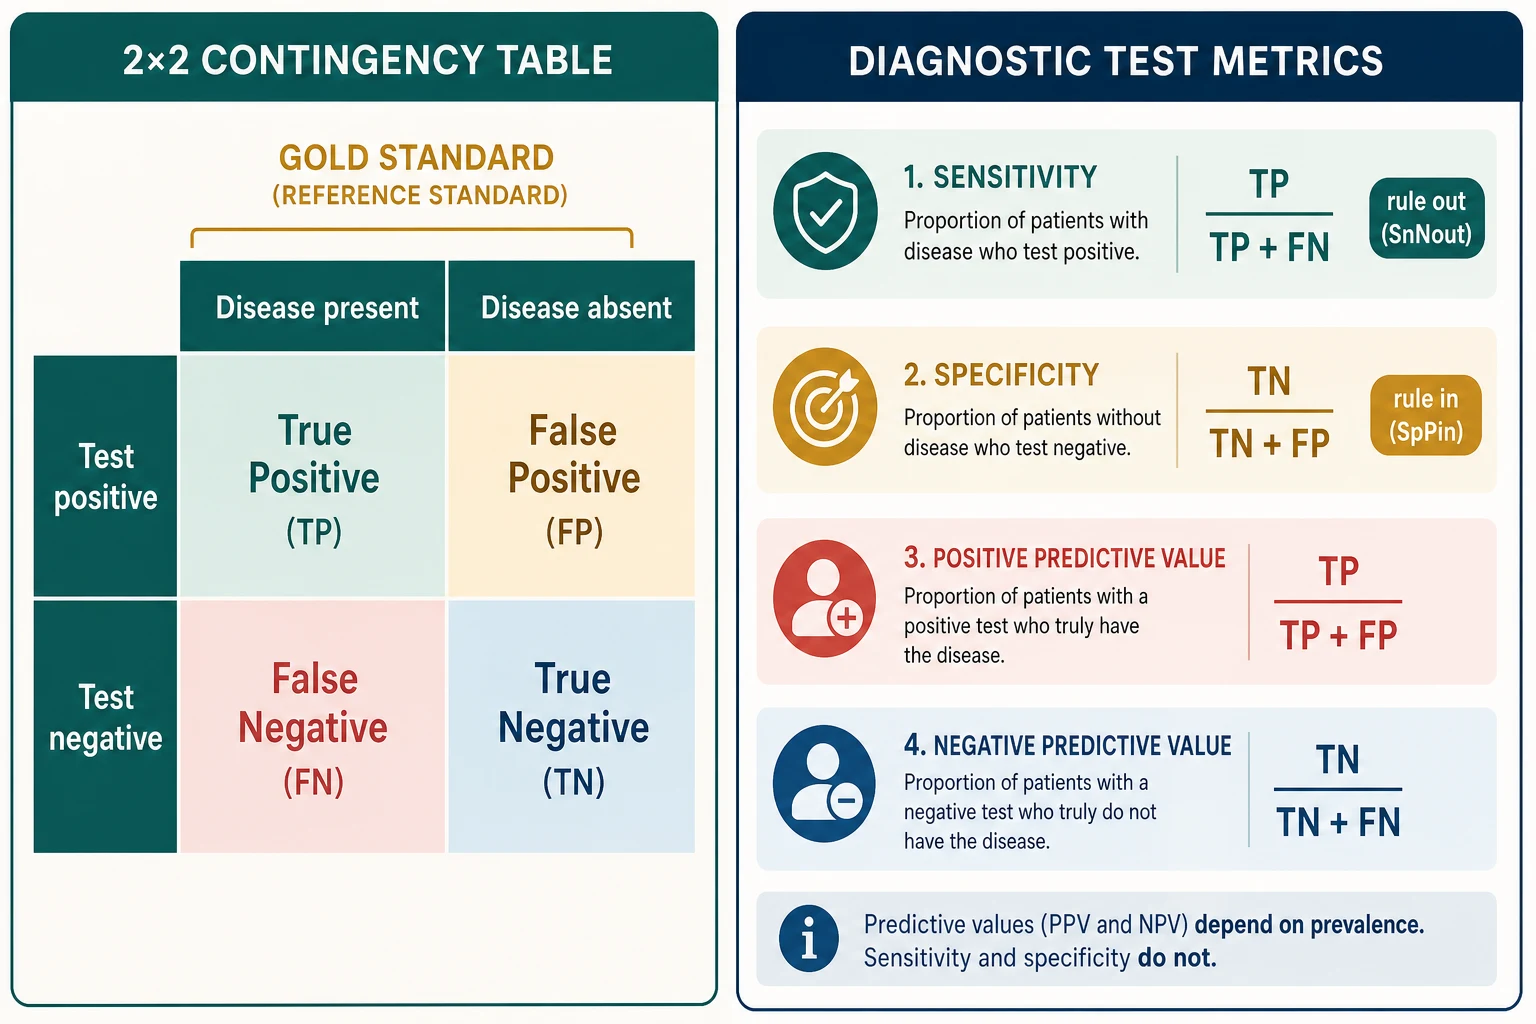
The table has disease status across the top — disease present and disease absent, decided by the reference standard — and the index test result down the side, test positive and test negative. The four cells are: [1] [4]
| Disease present | Disease absent | |
|---|---|---|
| Test positive | True positive (TP) | False positive (FP) |
| Test negative | False negative (FN) | True negative (TN) |
A true positive is a sick child the test correctly flags. A false positive is a well child the test wrongly alarms. A false negative is a sick child the test misses — the dangerous cell, because the family and clinician are falsely reassured. A true negative is a well child the test correctly clears. [4]
From these four boxes come the six measures that describe the test: [1] [4]
Sensitivity is the proportion of diseased people the test catches — TP ÷ (TP + FN). It is a property of the left-hand column, the disease column, and it answers: if the disease is there, how often will the test be positive? A test with 90 percent sensitivity catches nine of every ten affected children. [4]
Specificity is the proportion of healthy people the test correctly clears — TN ÷ (TN + FP). It is a property of the right-hand column, the no-disease column, and it answers: if the disease is absent, how often will the test be negative? A test with 95 percent specificity clears 95 of every 100 well children. [1] [4]
Positive predictive value is the probability that a positive result is truly disease — TP ÷ (TP + FP). It reads down the top row and answers the family's question: the test is positive, how likely is my child affected? [4]
Negative predictive value is the probability that a negative result is truly health — TN ÷ (TN + FN). It reads down the bottom row and answers: the test is negative, how safe is it to be reassured? [4]
Positive likelihood ratio (LR+) folds sensitivity and specificity into a single, prevalence-independent number: sensitivity ÷ (1 − specificity). Negative likelihood ratio (LR−) is (1 − sensitivity) ÷ specificity. Likelihood ratios are the bridge from the test's properties to the probability of disease in the child. [5] [7]
The crucial distinction, and the one examiners probe hardest, is that sensitivity, specificity and likelihood ratios are fixed at a chosen threshold and do not change with prevalence, whereas the two predictive values swim with prevalence. Hold onto that distinction and the rest of the topic falls into place. [4] [5]
Epidemiology & Risk Factors
The behaviour of any test is governed less by its own quality than by the population in which you use it, and that is why prevalence dominates this whole field. [1] [4]
Serious disease is rare in the general paediatric population. A well-baby clinic, a school hearing screen, a newborn bloodspot programme — all of these operate at a prevalence of fractions of a percent. In that environment the predictive value of a positive result collapses, because the false positives from the large, healthy majority overwhelm the few true positives hiding among them. A test that is 99 percent specific will still throw up one false positive for every hundred well children tested; when only one child in a thousand is truly affected, those ninety-nine false alarms dwarf the single true case. [4] [13]
Prevalence is the single biggest determinant of predictive value. Carry the very same test from a tertiary clinic where a quarter of children are affected to a primary-care waiting room where one in five hundred are, and its positive predictive value falls off a cliff while its sensitivity and specificity stay exactly where they were. This is why a test that earns its place in the emergency department can be actively harmful in the community, and why the first question in any diagnostic conversation is always: what was the pre-test probability? [4] [5]
The spectrum of patients distorts measured accuracy. A test validated in a group of severely affected children and unequivocally healthy controls will look wonderful on paper and then disappoint when it meets the mild, early, or ambiguous disease it was meant to detect. This spectrum effect means the accuracy quoted in a study is only trustworthy if the study population resembles the children in whom you intend to use the test. [10] [9]
Design choices inflate the apparent accuracy. Lijmer and colleagues showed empirically that case-control designs, partial verification of only the positive tests, and reference standards that fold the index test into themselves all push the measured sensitivity and specificity upward, away from the truth. The same diagnosis, studied carelessly, can look far more accurate than it is. [10]
Paediatric screening programmes target conditions whose early treatment changes outcome — phenylketonuria and congenital hypothyroidism on the bloodspot, permanent childhood hearing impairment, critical congenital heart disease, developmental disorders such as autism. Each of these has to clear two bars at once: the test must be accurate enough to find the disease at a treatable stage, and the programme must do more good than harm when the harms of false positives, overdiagnosis and family anxiety are weighed against the benefits of early detection. [13]
Pathophysiology
The engine under all of this is a single idea — Bayes' theorem — and once you can see it, every diagnostic statistic becomes a way of saying the same thing. [1] [5]
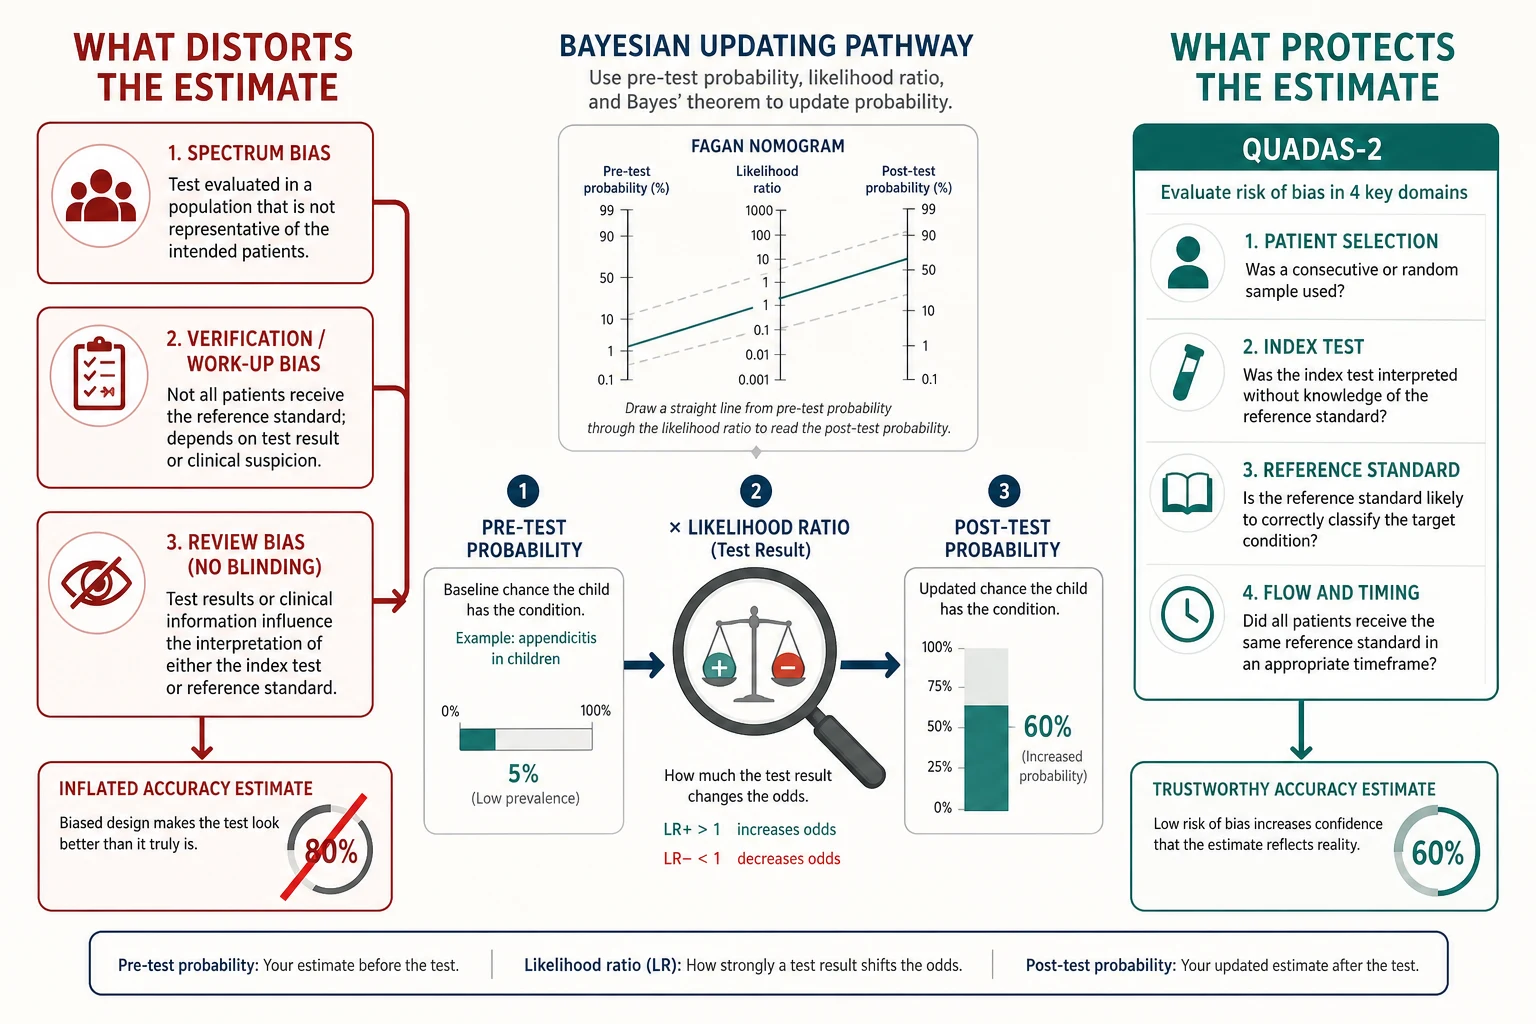
The probability of disease shifts as information arrives. Before you apply any test, the child sits at some pre-test probability of disease, set by their age, their story, their examination and the setting you are in. The test's job is not to confirm or exclude in one leap; it is to move that probability up or down by an amount you can predict. Bayes' theorem is the formal rule for that shift: convert the pre-test probability into odds, multiply by the likelihood ratio, and convert the post-test odds back into a probability. [5] [7]
Why sensitivity and specificity hold while predictive values do not. Sensitivity is measured entirely within the disease column — of those who are sick, how many test positive. Specificity is measured entirely within the no-disease column — of those who are well, how many test negative. Neither column's internal proportion changes when you widen or narrow the population, so sensitivity and specificity travel with the test unchanged. Predictive values, by contrast, are read across both columns at once — of those who test positive, how many are truly sick — so they inherit the ratio of diseased to well, which is precisely what prevalence sets. That is why a positive bloodspot screen means one thing in a high-risk subgroup and another in the general newborn population, even though the test itself is identical. [4] [5]
How a likelihood ratio quantifies the shift. A likelihood ratio tells you how many times more likely a given result is in a diseased person than in a well person. An LR+ of 10 means a positive result is ten times more likely if the disease is present than if it is absent, which is a large and decisive shift. An LR− of 0.1 means a negative result is ten times less likely in a diseased person than a well one, which is equally decisive in the other direction. LRs near 1 are uninformative — the result barely moves the probability — and that is why a result whose LR hovers around unity is barely worth doing. [5] [7]
How changing the threshold trades sensitivity for specificity. No test has a single, fixed cut-off; you choose where to draw the line, and that choice moves you along a curve. Lower the threshold and you call more results positive: sensitivity rises, specificity falls, and you catch more disease at the price of more false alarms. Raise the threshold and the reverse happens. Plot sensitivity against (1 − specificity) across every possible threshold and you trace the receiver operating characteristic (ROC) curve. The area under the curve summarises the test's overall discrimination, running from 0.5 (no better than a coin toss) to 1.0 (perfect separation). The Youden index — sensitivity plus specificity minus one — marks the single threshold that maximises correct classification, though the clinically best threshold is the one that sits at your treatment decision point, not necessarily the one with the highest index. [6]
How bias distorts the measured accuracy. Five named biases each push sensitivity and specificity away from their true value. Spectrum bias arises when the study population does not represent the intended-use population. Verification or work-up bias arises when only the positive tests receive the reference standard, so the false negatives are never found. Review bias arises when the interpreter of the index test or reference standard is not blinded, so knowledge leaks between them. Incorporation bias arises when the index test is part of the reference standard, so the two agree by construction. Disease progression bias arises when the reference standard is applied so long after the index test that the disease has genuinely changed. QUADAS-2 was built to find these, and you will meet them again in the appraisal section. [10] [9]
How screening biases manufacture the illusion of benefit. A fourth family of biases does not distort the test so much as the outcome of a screening programme. Lead-time bias finds disease earlier in its natural history, so the screened patient seems to live longer from diagnosis even though the moment of death is unchanged. Length-time bias preferentially finds the slow, indolent cases because they spend longer in the detectable pre-clinical phase, so screened cases look milder by selection. Overdiagnosis is the extreme of length-time bias: the screen detects disease that would never have become clinically apparent, and the patient is treated and counted as a survivor of a cancer or condition that was never going to harm them. Volunteer or selection bias ensures that the people who accept screening are healthier, more health-conscious and more affluent than those who decline, so any survival advantage may belong to the person, not the programme. [13]
Clinical Presentation
You will meet diagnostic accuracy questions in several recognisable shapes, and naming the shape tells you which tool to reach for. [1] [3]
The positive-screen conversation. A newborn bloodspot or hearing screen is flagged and the family wants to know what it means. Your job is to translate a sensitivity and specificity into a positive predictive value, explain that the result is a reason to confirm rather than a diagnosis, and arrange the reference-standard test. The single most reassuring sentence is often: most babies with a positive screen do not have the condition. [4]
The rule-out question. A colleague quotes a test's high sensitivity and asks whether a negative result safely excludes a serious diagnosis in your patient. Your job is to weigh the pre-test probability: a highly sensitive test with a low LR− drops the probability hard, but if it started high the residual risk may still be too large to ignore. SnNout is a first move, not a guarantee. [1] [5]
The rule-in question. A specific test is positive and the team wants to act. Your job is to check the pre-test probability and the LR+ — if the probability was low to begin with, even a strong positive may only reach the confirm zone, not the treat zone. [7] [3]
The journal-club appraisal. A diagnostic accuracy study lands in your hand and you are asked whether its results are valid and applicable to children. Your job is to walk QUADAS-2 across patient selection, index test, reference standard, and flow and timing before you read a single sensitivity, then ask whether the study population resembles yours. [9] [2]
The screening-programme judgement. A new screen is proposed for a paediatric population. Your job is to hold it against the Wilson and Jungner principles, estimate the predictive value at the population's prevalence, and demand evidence that any survival benefit survives the exclusion of lead-time, length-time and overdiagnosis bias. [13]
The cross-setting adoption. A test that earned its place in a tertiary referral cohort is about to be adopted in primary care. Your job is to reason about the spectrum and prevalence effects that will change its predictive value, and to warn the team that a positive result there will mean something different. [10] [4]
Differential Diagnosis
Before you act on a number, name what the number actually represents, because several distinct problems share a surface appearance. [4] [13]
| You see | Prefer this framing | Trap |
|---|---|---|
| A test with 95 percent specificity | Ask the pre-test probability and the LR+ | Assume a positive means disease |
| A positive screen in a well baby | Treat it as a signal to confirm, not a diagnosis | Convey a diagnosis before the reference standard |
| Improved survival after screening | Ask whether lead-time or length-time bias explain it | Credit the screen with a real survival gain |
| An accuracy estimate from a case-control study | Expect it to be inflated; seek a consecutive-series estimate | Trust the headline sensitivity |
| A high area under the ROC curve | Ask how it performs at your decision threshold | Equate AUC with usefulness at the cut-off |
| A negative result in a high-risk child | Re-examine the residual probability, not the sensitivity | Be falsely reassured by SnNout |
Real performance change versus a changed population. A test's apparent accuracy can shift because the test itself changed, or because the spectrum or prevalence in which it is used changed. Most of the time it is the population, not the test — so when a result behaves unexpectedly, ask first who was tested. [10] [4]
Real survival benefit versus screening artefact. A screening programme that reports longer survival from diagnosis must clear three hurdles before its benefit is real: it must show a fall in cause-specific mortality (not just survival from diagnosis), the benefit must persist after excluding lead-time, and it must survive a randomised comparison that controls for volunteer bias. [13]
Clinical & Bedside Assessment
Estimate the pre-test probability before you test. Set it from the child's age, story, examination and the setting — a febrile, tachypnoeic toddler in the emergency department sits at a very different probability of bacterial pneumonia from a well, afebrile child in the clinic. The pre-test probability is the hinge on which every later calculation turns, and quoting a sensitivity without it is the most common bedside error. [1] [5]
Choose a test whose likelihood ratio moves the probability across a threshold. The point of testing is to cross a decision boundary — either above the treatment threshold, where the residual risk justifies acting, or below the test or reassurance threshold, where it justifies standing down. A test whose LR sits near 1 barely moves the probability and is not worth doing; a test with a strong LR+ or LR− earns its place by carrying you cleanly across the line. [5] [7]
Translate the result into a post-test probability and share it. Convert the pre-test probability to odds, multiply by the likelihood ratio, and read the post-test probability back — or use a Fagan nomogram, which does the same job graphically in a single straight line. Then share that probability with the family in plain terms: "before the test we thought there was about a one-in-five chance; this result moves it to about three in four, so we should confirm and prepare to treat." [5] [3]
Recognise when you are in the wrong population. A test validated in tertiary care, in severe disease, or in adults does not carry its quoted accuracy into your primary-care, mild, paediatric child. Before you trust the number, ask whether the study population resembles yours, and if not, treat the result as weaker than its headline suggests. [10] [9]
Distinguish a screen from a diagnosis. A screening result, by design, trades specificity for sensitivity in a low-prevalence population; its positive predictive value is modest and it always demands a reference-standard confirmation before a diagnosis is conveyed. A diagnostic result, applied to a symptomatic individual at higher pre-test probability, carries a stronger predictive value. Confusing the two is how families are told their well child is sick. [4] [13]
Investigations
The investigations on this page are searches and appraisals, and the workpiece is the diagnostic accuracy study itself. [2] [9]
Confirm the reference standard was applied to everyone. A trustworthy study applies the same, independent reference standard to every participant regardless of the index test result. If only the positive tests receive the gold standard, the false negatives vanish into the unverified group and the sensitivity is overstated. [9] [10]
Apply QUADAS-2 across its four domains. QUADAS-2 replaces the original checklist with four domains — patient selection, index test, reference standard, and flow and timing — each judged for risk of bias and for applicability. Patient selection asks whether the spectrum resembles your patients; the index test asks how it was conducted and interpreted; the reference standard asks whether it correctly classifies the target condition; flow and timing asks whether everyone received the same standard and at the right interval. Flag any high-risk domain and judge how far it inflates the estimate. [9] [8]
Check that the study reports sensitivity and specificity with confidence intervals. A point estimate without a confidence interval hides the play of chance, and the smaller the study the wider the interval. Prefer studies that report likelihood ratios across a clinically meaningful range of thresholds, because a single cut-off hides the trade-off. [3] [7]
Check STARD reporting completeness. The STARD statement, updated in 2015, lists the items a diagnostic accuracy study must report so that you can appraise it and reproduce its results: the index test and reference standard, the population and recruitment, the flow of patients through the study, and the 2×2 data. A study that omits these cannot be appraised, and its headline numbers should be treated with caution. [11] [12]
Hunt for publication bias when pooling diagnostic studies. Diagnostic meta-analysis is plagued by a threshold effect — different studies set the cut-off differently, so their sensitivities and specificities correlate rather than average — and by publication bias, detectable on a funnel plot. A pooled estimate built only on published, positive studies overstates the test's accuracy. [14] [9]
Management — Resuscitation
Some moments in diagnostic work are emergencies of a different kind, where a number is about to drive harm and the rescue is statistical, not procedural. [4] [13]
Imminent harmful follow-up on a false positive. A positive screen in a low-prevalence child is about to trigger an invasive, painful, or anxiety-provoking reference-standard test. The rescue is to remember the predictive value: in a population where disease is rare, most positives are false, so confirm before you act and counsel the family that confirmation is the point, not the start of treatment. [4]
Over-trusted negative in a high-risk child. A colleague is reassured by a negative result because the test is highly sensitive. The rescue is to re-examine the residual probability: at a high pre-test probability, even a strong LR− may leave an unacceptable risk, and the clinical picture, not the test, should govern the decision to investigate or treat further. [1] [5]
Tertiary test adopted in primary care. A team is about to deploy a tertiary-validated test across a community population. The rescue is the spectrum and prevalence effect: warn that the positive predictive value will fall, the false-positive workload will rise, and the test may do more harm than good at the new prevalence. [10] [4]
Screen marketed on survival benefit. A programme is being promoted on improved survival from diagnosis. The rescue is to demand the harder endpoints — a fall in cause-specific mortality, exclusion of lead-time and length-time bias, and a randomised comparison that controls for volunteer bias — before endorsing the benefit. [13]
Family distressed by a false positive. Parents are frightened by a screen that has since been confirmed negative. The rescue is honest, plain-language counselling: explain the predictive value, name overdiagnosis as a known harm of screening, and acknowledge the anxiety the programme caused as a real cost to be weighed against its benefit. [13] [4]
Management — Definitive & Stepwise
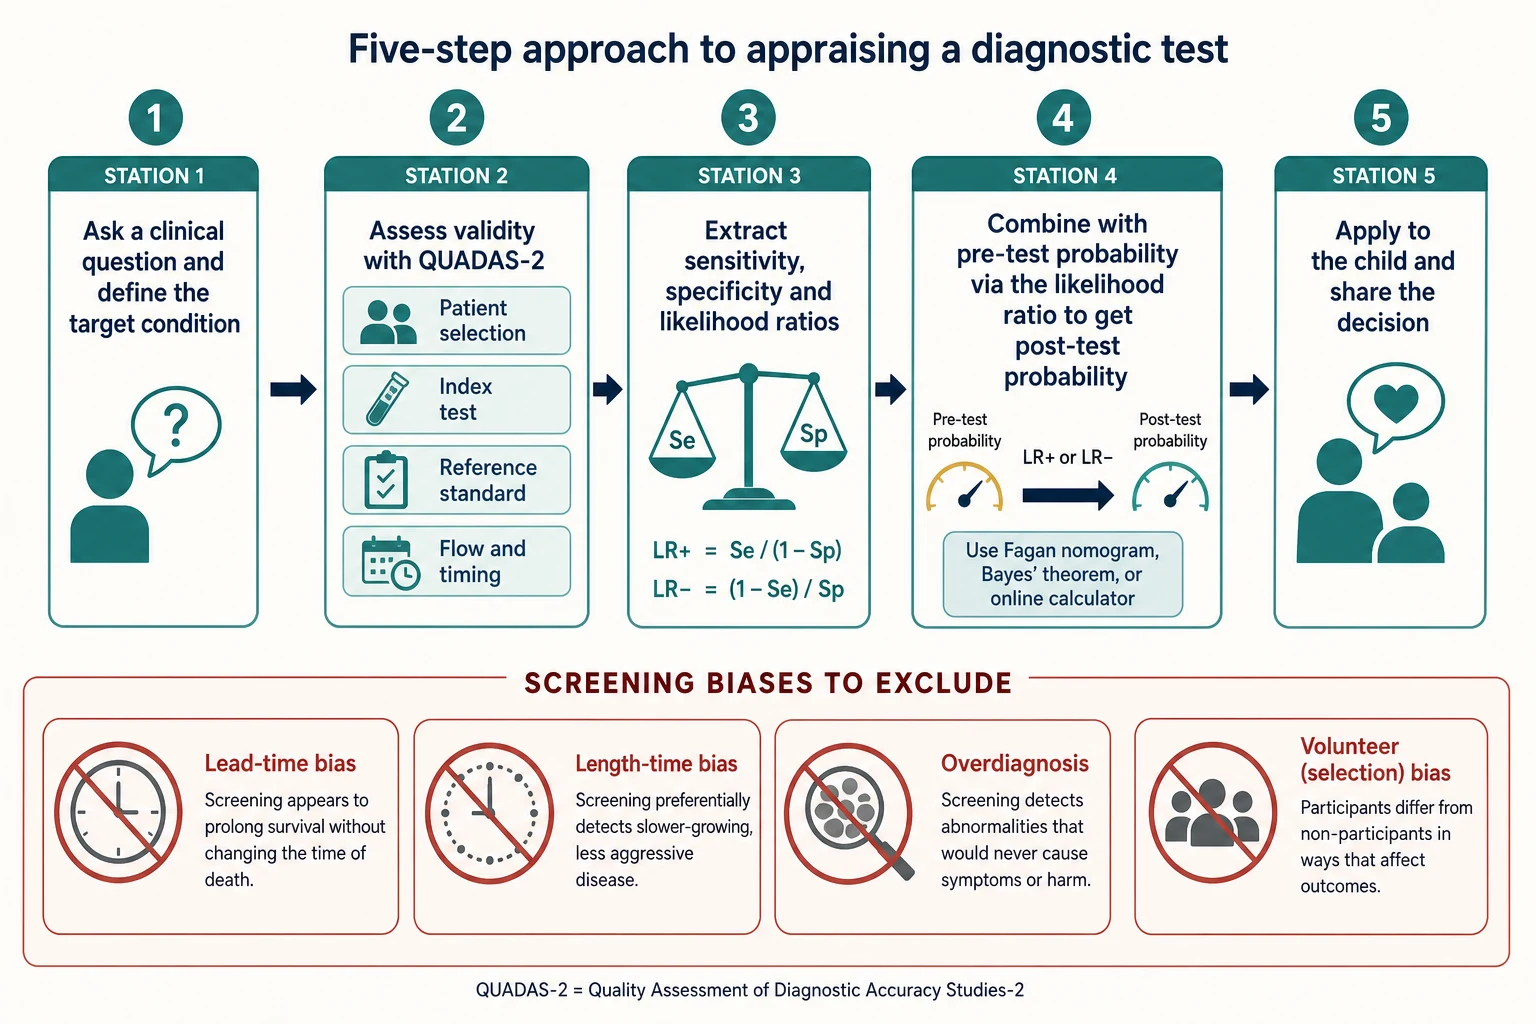
Work through the diagnostic decision in five moves, then judge any screening programme against its own principles. [1] [5]
- Estimate the pre-test probability. Set it from the age, the history, the examination and the setting, and name it out loud — a number, or at least a band. [1]
- Select a test whose likelihood ratio crosses your threshold. Choose a test that will carry the probability cleanly above the treatment threshold or below the reassurance threshold; if no available test can, reconsider whether testing helps at all. [5] [7]
- Appraise the test's accuracy with QUADAS-2. Confirm the estimate is unbiased and applicable to children before you trust a single number, flagging patient selection, index test, reference standard, and flow and timing. [9]
- Update the probability with the likelihood ratio. Convert pre-test probability to odds, multiply by the LR, and read the post-test probability — or trace the Fagan nomogram in one line. [5]
- Share the probability and decide together. Translate the post-test probability into plain terms, integrate it with the family's values through shared decision-making, and arrange treatment, confirmation, or watchful waiting accordingly. [3] [5]
Judge any screening programme against the Wilson and Jungner principles. The condition should be an important health problem with a understood natural history and a recognisable early stage; early treatment should offer better outcomes than late treatment; there should be a suitable, acceptable, and safe test; the case-finding should be continuous, not opportunistic; facilities for diagnosis and treatment should be available; there should be an agreed policy on whom to treat; the cost of case-finding should be economically balanced against the benefit; and the programme should be an ongoing process. Few proposed paediatric screens clear all of these, and those that fail on the predictive-value or treatment-benefit criteria should be declined. [13]
Exclude the screening biases before you accept a survival benefit. Demand a fall in cause-specific mortality rather than survival from diagnosis; insist that lead-time and length-time bias have been addressed; ask whether overdiagnosis inflates the apparent benefit; and check that volunteer bias has been controlled, ideally in a randomised design. A survival story that has not cleared these hurdles is a story about selection, not about the screen. [13]
Specific Subtypes & Scenarios
Working a 2×2 table from raw counts. Suppose a rapid test for a serious bacterial infection is evaluated in 1,000 febrile children, of whom 200 are truly infected. The test is positive in 160 of the infected (true positives) and in 80 of the 800 uninfected (false positives); it misses 40 infected (false negatives) and correctly clears 720 (true negatives). Sensitivity is 160 ÷ 200 = 80 percent. Specificity is 720 ÷ 800 = 90 percent. Positive predictive value is 160 ÷ 240 = 67 percent, and negative predictive value is 720 ÷ 760 = 95 percent. Now carry the same test into a low-prevalence clinic where only 20 of 1,000 are infected: sensitivity and specificity stay at 80 and 90 percent, but the positive predictive value falls to 16 ÷ (16 + 98) ≈ 14 percent — six of every seven positives are false. The test did not change; the population did. [4] [1]
Converting probability with the Fagan nomogram. A child sits at a pre-test probability of 20 percent for a diagnosis; the test you plan to use has an LR+ of 8. Draw a straight line on the nomogram from 20 percent on the pre-test probability axis through 8 on the likelihood ratio axis, and it lands near 67 percent on the post-test axis. The same line with an LR− of 0.1 would land near 2 percent. The nomogram is Bayes' theorem without the arithmetic, and it is the single most useful figure for explaining a result to a family. [5] [7]
Reading a receiver operating characteristic curve. A test's ROC curve bows toward the top-left corner; the closer it hugs that corner, the better its discrimination. An area under the curve of 0.5 means the test is no better than chance, 0.7 to 0.8 is acceptable, 0.8 to 0.9 is good, and above 0.9 is excellent. The Youden index picks the threshold where the curve sits farthest from the diagonal, but the clinically best threshold is the one that places the test at your treatment decision point, accepting more or fewer false positives as the disease demands. [6]
Applying QUADAS-2. A study of a bedside ultrasound is reported with a sensitivity of 95 percent. Patient selection: were the children consecutive, or a mixture of obvious cases and healthy controls? Index test: was the sonographer blinded to the reference standard? Reference standard: is it independent, or does it include the ultrasound itself? Flow and timing: did everyone receive the reference standard, and at the right interval? A single high-risk domain can inflate the 95 percent to a number you cannot trust. [9] [10]
Judging a paediatric screen against Wilson and Jungner. Newborn bloodspot screening for phenylketonuria clears the bar with room to spare: the condition is serious, its natural history is understood, early dietary treatment prevents intellectual disability, the test is sensitive and acceptable, and treatment is available and agreed. A proposed screen for a condition with no effective early treatment, or with a test whose positive predictive value is poor at the population prevalence, fails the principles and should be declined. [13]
Counselling a positive newborn or hearing screen. Walk the family through the predictive value in plain terms — most babies with a positive screen are well, and the next step is confirmation, not diagnosis — arrange the reference-standard test, and frame the process as the screen doing its job of finding the few true cases among the many false alarms. [4]
Appraising a diagnostic meta-analysis. Look first for the threshold effect — whether sensitivities and specificities correlate, which they do when studies set different cut-offs — and plot the summary point on a summary ROC. Check for heterogeneity, examine the funnel plot for publication bias, and treat the pooled estimate as conditional on the threshold, not as a single universal number. [14] [9]
Complications & Pitfalls
- Quoting sensitivity or specificity without the pre-test probability and the predictive value. [4]
- Treating a positive predictive value as a fixed property of the test rather than a function of prevalence. [1]
- Over-trusting a negative result to exclude disease when the pre-test probability is high. [5]
- Applying a test validated in a tertiary-care spectrum to a low-prevalence primary-care child. [10]
- Accepting a screening survival benefit without excluding lead-time, length-time and overdiagnosis bias. [13]
- Trusting an accuracy estimate from a case-control design, partial verification, or an unblinded reference standard. [10] [9]
- Equating a high area under the ROC curve with a useful test at the chosen threshold, ignoring calibration. [6]
- Overdiagnosing indolent or regressing disease through screening, causing harm from unnecessary treatment and family anxiety. [13]
- Confusing a screen (find unsuspected disease) with a diagnostic test (confirm suspected disease), and conveying a diagnosis on an unconfirmed screen. [4]
Prognosis & Disposition
A good diagnostic decision is measured by whether the post-test probability landed cleanly on one side of a treatment threshold, not by how elegant the calculation looked. [3] [5]
Markers of success. The post-test probability lies clearly above the treatment threshold or below the reassurance threshold, the family understands it, and the decision matches their values and circumstances. The clinician can state the pre-test probability, the test and its likelihood ratio, and the post-test probability in plain terms. [5]
When to defer. Where the post-test probability straddles the threshold, confirm with a second test, watch and wait, or seek a better reference standard rather than act on uncertainty. A reversible or low-stakes decision tolerates more ambiguity than an irreversible one. [1]
When to escalate. When a serious diagnosis remains plausible despite a negative test in a high-risk child, or when a positive screen requires confirmation, escalate to specialist input, a stronger reference standard, or a multidisciplinary assessment. [3]
Disposition includes documentation. Record the pre-test probability, the test and its likelihood ratio, the post-test probability, and the shared decision reached, so the reasoning survives the moment and teaches the next clinician. [5] [12]
Special Populations
Neonates. Newborn bloodspot and hearing screening operate at very low prevalence, so the positive predictive value is modest and confirmatory testing is mandatory before a diagnosis is conveyed. A positive screen is a trigger for confirmation, not a verdict; counsel the family accordingly and protect them from premature despair. [4]
Infants and preschool children. Developmental screening tools — the M-CHAT-R for autism, parent-completed developmental questionnaires — are validated for a specific age and setting, and their accuracy falls when applied outside that spectrum. Match the tool to the child, and read its quoted sensitivity with an eye on where it was derived. [10]
Aboriginal and Torres Strait Islander, Maori, and other Indigenous children. Screening thresholds and programmes may differ by epidemiology and by access, and the harms of false positives and overdiagnosis fall hardest where follow-up is hard to reach. Seek culturally safe pathways for confirmation and treatment, and privilege community-generated data. [13]
Adolescents. Screening for mental health and risk behaviours raises specific consent, privacy and overdiagnosis considerations. The young person's values set the decision threshold, and a positive screen must be handled with the confidentiality and the shared decision-making that adolescent care demands. [3]
Children with disability and medical complexity. Reference standards and test thresholds often do not apply, and overdiagnosis and false positives carry disproportionate burden for a child already bearing many assessments. Weigh applicability with particular care, and prioritise patient-centred outcomes. [9] [13]
Evidence, Guidelines & Regional Differences
Core anchors are the Griner primer on the selection and interpretation of diagnostic tests, the Jaeschke Users' Guides on diagnostic test validity and results, the Akobeng Acta Paediatrica series on sensitivity and specificity, likelihood ratios and receiver operating characteristic curves, Deeks and Altman on likelihood ratios, the Whiting QUADAS development and the revised QUADAS-2 tool, the Lijmer evidence of design-related bias in diagnostic studies, the Bossuyt STARD statement and its 2015 update, the Egger funnel-plot test for publication bias, and the Esserman analysis of overdiagnosis in screening. The Wilson and Jungner principles of screening for disease anchor the screening half of the page. [1] [2] [3] [4] [5] [6] [7] [8] [9] [10] [11] [12] [13] [14]
Newborn bloodspot screening is offered to every baby, with programmes coordinated nationally and confirmation through state-based metabolic and endocrine services. The RACP curriculum names the interpretation of diagnostic tests and screening statistics as a core professional skill, and the Newborn Bloodspot Screening National Policy Framework sets the conditions screened. Apply QUADAS-2 to any local diagnostic study, and for Aboriginal and Torres Strait Islander and Maori children, ensure culturally safe follow-up pathways for confirmation. [9] [4]
The UK National Screening Committee appraises proposed programmes against its own criteria, which extend the Wilson and Jungner principles, and recommends only those that meet them on evidence of benefit and acceptable harm. The RCPCH Progress+ curriculum frames evidence-based practice and screening as core professional themes. Use UK NSC guidance and Cochrane diagnostic accuracy reviews, and apply QUADAS-2 and STARD in any appraisal you perform. [9] [12]
The American Academy of Pediatrics issues guidance on newborn, developmental and behavioural screening, and the United States Preventive Services Task Force grades screening recommendations on a transparent certainty-and-benefit scale. Use these alongside Cochrane diagnostic accuracy reviews, and apply GRADE when moving from diagnostic evidence to a recommendation. [9] [13]
The CanMEDS Scholar role maps onto the appraisal and application of diagnostic evidence, and Canadian screening programmes are coordinated through provincial bodies. Use locally endorsed guidance and appraised syntheses, and document the certainty of the diagnostic evidence behind each decision. [9] [5]
Controversies: how aggressively to screen when the treatment benefit is modest or uncertain; how to weigh the harms of overdiagnosis against the benefits of early detection in conditions such as neuroblastoma or developmental disorders; and how to apply screening thresholds derived in one population to children of differing epidemiology and access. Exam answers show a structured appraisal, an honest predictive value, the excluded screening biases, and local humility. [13] [9]
Exam Pearls
- Sensitivity is TP ÷ (TP + FN) and rules disease out when high (SnNout); specificity is TN ÷ (TN + FP) and rules disease in when high (SpPin). [1] [4]
- Positive predictive value is TP ÷ (TP + FP); negative predictive value is TN ÷ (TN + FN); both change with prevalence while sensitivity and specificity do not. [4]
- LR+ equals sensitivity ÷ (1 − specificity); LR− equals (1 − sensitivity) ÷ specificity; an LR+ above 10 and an LR− below 0.1 are large shifts. [5] [7]
- Likelihood ratios are prevalence-independent; combine them with the pre-test probability on a Fagan nomogram to get the post-test probability. [5]
- The area under the ROC curve runs from 0.5 (no discrimination) to 1.0 (perfect); lowering the threshold raises sensitivity and lowers specificity. [6]
- The Youden index is sensitivity plus specificity minus one. [6]
- Lead-time bias finds disease earlier without changing the moment of death; length-time bias finds slower disease; overdiagnosis detects disease that would never become clinical; volunteer bias ensures the screened are healthier. [13]
- QUADAS-2 appraises patient selection, index test, reference standard, and flow and timing, for both bias and applicability. [9]
- In a low-prevalence paediatric population even a specific test yields a low positive predictive value, so confirm every positive screen before conveying a diagnosis. [4] [13]
Appraise and apply a diagnostic test at the bedside
Estimate the pre-test probability from the history, examination and setting
Choose a test whose likelihood ratio crosses your decision threshold
Appraise the test's accuracy with QUADAS-2 before trusting the number
Update the probability with the likelihood ratio or Fagan nomogram
Share the post-test probability and decide together
For any screen, exclude lead-time, length-time and overdiagnosis bias before accepting benefit
References
- [1]Griner PF, Mayewski RJ, Mushlin AI, Greenland P Selection and interpretation of diagnostic tests and procedures. Principles and applications. Annals of internal medicine, 1981.PMID 6452080
- [2]Jaeschke R, Guyatt G, Sackett DL Users' guides to the medical literature. III. How to use an article about a diagnostic test. A. Are the results of the study valid? Evidence-Based Medicine Working Group. JAMA, 1994.PMID 8283589
- [3]Jaeschke R, Guyatt GH, Sackett DL Users' guides to the medical literature. III. How to use an article about a diagnostic test. B. What are the results and will they help me in caring for my patients? The Evidence-Based Medicine Working Group. JAMA, 1994.PMID 8309035
- [4]Akobeng AK Understanding diagnostic tests 1: sensitivity, specificity and predictive values. Acta paediatrica, 2007.PMID 17407452
- [5]Akobeng AK Understanding diagnostic tests 2: likelihood ratios, pre- and post-test probabilities and their use in clinical practice. Acta paediatrica, 2007.PMID 17306009
- [6]Akobeng AK Understanding diagnostic tests 3: Receiver operating characteristic curves. Acta paediatrica, 2007.PMID 17376185
- [7]Deeks JJ, Altman DG Diagnostic tests 4: likelihood ratios. BMJ, 2004.PMID 15258077
- [8]Whiting P, Harbord R, Kleijnen J, Nothorus R, Lijmer J, Deeks J, Bossuyt P The development of QUADAS: a tool for the quality assessment of studies of diagnostic accuracy. BMC medical research methodology, 2003.PMID 14606960
- [9]Whiting PF, Rutjes AW, Westwood ME, et al. QUADAS-2: a revised tool for the quality assessment of diagnostic accuracy studies. Annals of internal medicine, 2011.PMID 22007046
- [10]Lijmer JG, Mol BW, Heisterkamp S, et al. Empirical evidence of design-related bias in studies of diagnostic tests. JAMA, 1999.PMID 10493205
- [11]Bossuyt PM, Reitsma JB, Bruns DE, Gatsonis CA, Glasziou PP, Irwig LM, Lijmer JG, Moher D, Rennie D, de Vet HC Towards complete and accurate reporting of studies of diagnostic accuracy: the STARD initiative. Standards for Reporting of Diagnostic Accuracy. Croatian medical journal, 2003.PMID 14515428
- [12]Bossuyt PM, Reitsma JB, Bruns DE, et al. STARD 2015: an updated list of essential items for reporting diagnostic accuracy studies. BMJ, 2015.PMID 26511519
- [13]Esserman LJ, Thompson IM, Reid B, et al. Addressing overdiagnosis and overtreatment in cancer: a prescription for change. Lancet oncology, 2014.PMID 24807866
- [14]Egger M, Davey Smith G, Schneider M, Minder C Bias in meta-analysis detected by a simple, graphical test. BMJ, 1997.PMID 9310563