EM · ECG interpretation (approach)
The 12-lead ECG — the systematic emergency department interpretation approach
Also known as ECG interpretation · 12-lead ECG · ECG reading · Electrocardiogram
The systematic approach to the 12-lead ECG for the emergency medicine trainee — the rate, the rhythm, the axis, the intervals (PR 120 to 200 ms, QRS under 120 ms, QTc under 440 ms in men and under 460 ms in women), the segments and waves (ST elevation with the gender-specific STEMI thresholds, ST depression, T-wave inversion, pathological Q), the chambers (atrial enlargement, ventricular hypertrophy with the Sokolow-Lyon and Cornell criteria), the blocks (AV block, bundle branch block), and a reproducible stepwise reading method. Includes the ECG-driven drug doses — adenosine 6 then 12 mg for SVT, atropine 500 micrograms for bradycardia, amiodarone 300 mg for VT. ACEM-primary, globally tagged.
On this page & tools
Your progress
Saved locally on this device.
8 MCQs with explanations
Target exams
Red flags
Related topics
- Tachyarrhythmias in the emergency department
- Bradyarrhythmias and atrioventricular block in the emergency department
- Acute coronary syndromes (STEMI, NSTEMI and unstable angina)
- Syncope — the emergency department approach and risk stratification
- Electrolyte emergencies — potassium and sodium
- Cardiogenic shock in the emergency department
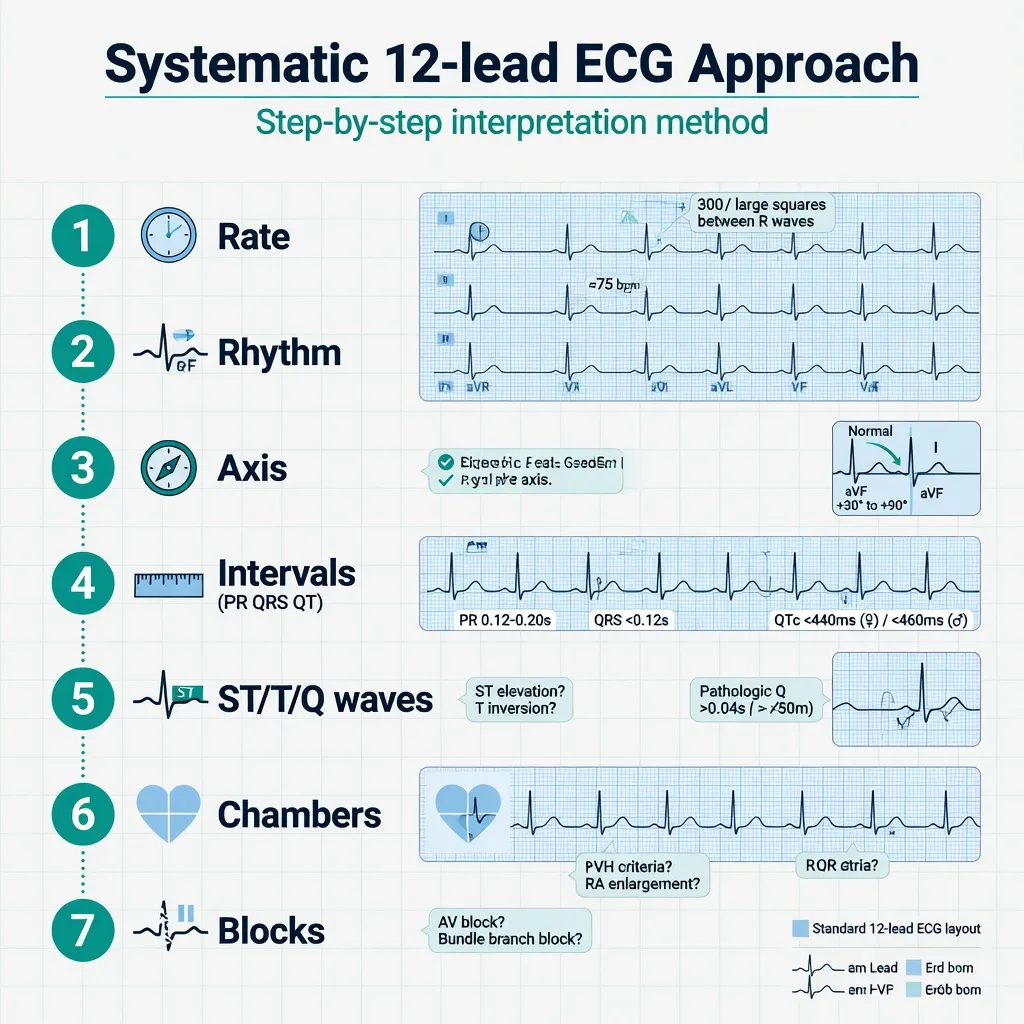
The 12-lead electrocardiogram is the single highest-yield investigation in the emergency department. It is fast, non-invasive, repeatable, and it changes disposition — a single tracing can trigger reperfusion, an antiarrhythmic, a pacemaker, or a toxicological antidote. The Fellowship examiner is not testing whether a candidate can recognise a pattern on a favourite trace; the test is whether a candidate can apply a reproducible systematic method to any ECG, in any patient, under pressure, and not miss a can't-miss finding. Pattern recognition fails on the unusual tracing; a system does not. This topic is the diagnostic-skill framework, not a disease. [1]
When to use the framework and the principles of a systematic read
Every patient with chest pain, palpitation, syncope, breathlessness, collapse, or haemodynamic instability gets a 12-lead ECG within ten minutes of arrival, and any patient who deteriorates gets a repeat trace. The ECG is interpreted by the treating clinician, not delegated to the machine — the computer interpretation is a screening aid only and is wrong often enough on the abnormal trace that over-reliance is a documented source of missed acute coronary syndrome.[2] Three principles govern the read. First, use the same ordered sequence every time so that no compartment is skipped under cognitive load. Second, read in parallel with the resuscitation — an unstable rhythm is treated before the tracing is fully described. Third, always compare with the previous ECG: a borderline ST segment that is new is far more significant than one that is chronic.
The lead layout, the paper, and the normal ranges
The standard tracing is recorded at 25 millimetres per second, so each small box is 40 milliseconds horizontally and 0.1 millivolt vertically (five small boxes to a large box, giving 200 milliseconds and 0.5 millivolts per large box). Six limb leads view the heart in the frontal plane — I, II, III, aVR, aVL and aVF — and six precordial leads (V1 to V6) view it in the horizontal plane. A positive deflection in a lead means the net depolarisation vector points towards that lead; a negative deflection means it points away. The normal intervals are the anchor against which every abnormality is measured. [1]
The normal ECG intervals and rates
Step 1 — Rate
The rate is calculated from the rhythm strip (usually lead II). For a regular rhythm, divide 300 by the number of large boxes between two consecutive R waves: one box is 300 per minute, two is 150, three is 100, four is 75, five is 60, six is 50. For an irregular rhythm such as atrial fibrillation, count the number of QRS complexes across a thirty-second rhythm strip and multiply by two, or count the R waves over thirty large boxes and multiply by ten. A rate under 60 is a bradycardia, over 100 is a tachycardia, and 60 to 100 is normal — but a rate of 70 in a patient with a baseline of 50 and chest pain may still represent a high-degree block, so the number is interpreted with the rhythm, never in isolation. Atrial and ventricular rates can differ in heart block, so both are counted when P waves outnumber QRS complexes. [1]
Step 2 — Rhythm
The rhythm is judged on three questions: is a P wave present before every QRS, is a QRS present after every P, is the rhythm regular? Sinus rhythm has an upright P in I and II and an inverted P in aVR, with a one-to-one P-to-QRS relationship and a constant PR interval. The next decision is the QRS width: under 120 milliseconds is narrow-complex (the rhythm originates above the His-Purkinje system — sinus, atrial, junctional, or supraventricular), and 120 milliseconds or more is broad-complex (the rhythm either originates in the ventricle or reaches it through abnormal conduction). The final decision is regularity: a regular narrow-complex tachycardia is a supraventricular tachycardia, an irregular narrow-complex rhythm is atrial fibrillation or flutter with variable block, a regular broad-complex tachycardia is ventricular tachycardia until proven otherwise, and an irregular broad-complex rhythm raises pre-excited atrial fibrillation (Wolff-Parkinson-White). The rhythm step, taken with the haemodynamic state, directly drives the peri-arrest algorithm. [1]
Step 3 — Axis
The electrical axis is the mean direction of ventricular depolarisation in the frontal plane, and it localises conduction and chamber problems. The quadrant method is the fastest: examine lead I and lead aVF. Both positive is a normal axis (−30 to +90 degrees); I positive and aVF negative is left axis (−30 to −90, seen in left anterior hemiblock, left ventricular hypertrophy, inferior myocardial infarction); I negative and aVF positive is right axis (+90 to +180, seen in right ventricular hypertrophy, lateral myocardial infarction, a left posterior fascicular block); both negative is an extreme or northwest axis (a lead malposition or an apical ventricular rhythm). A more precise method uses the isoelectric lead — the axis lies at 90 degrees to whichever limb lead is equiphasic. The precordial transition — the point where the QRS complex changes from predominantly negative (V1) to predominantly positive (V6) — should occur at V3 or V4; clockwise rotation (poor R-wave progression, persistence of a deep S into V5–V6) suggests a posterior or anterior infarct or a left ventricular problem, and counter-clockwise rotation suggests right ventricular overload. [1]
Step 4 — Intervals — PR, QRS and QT
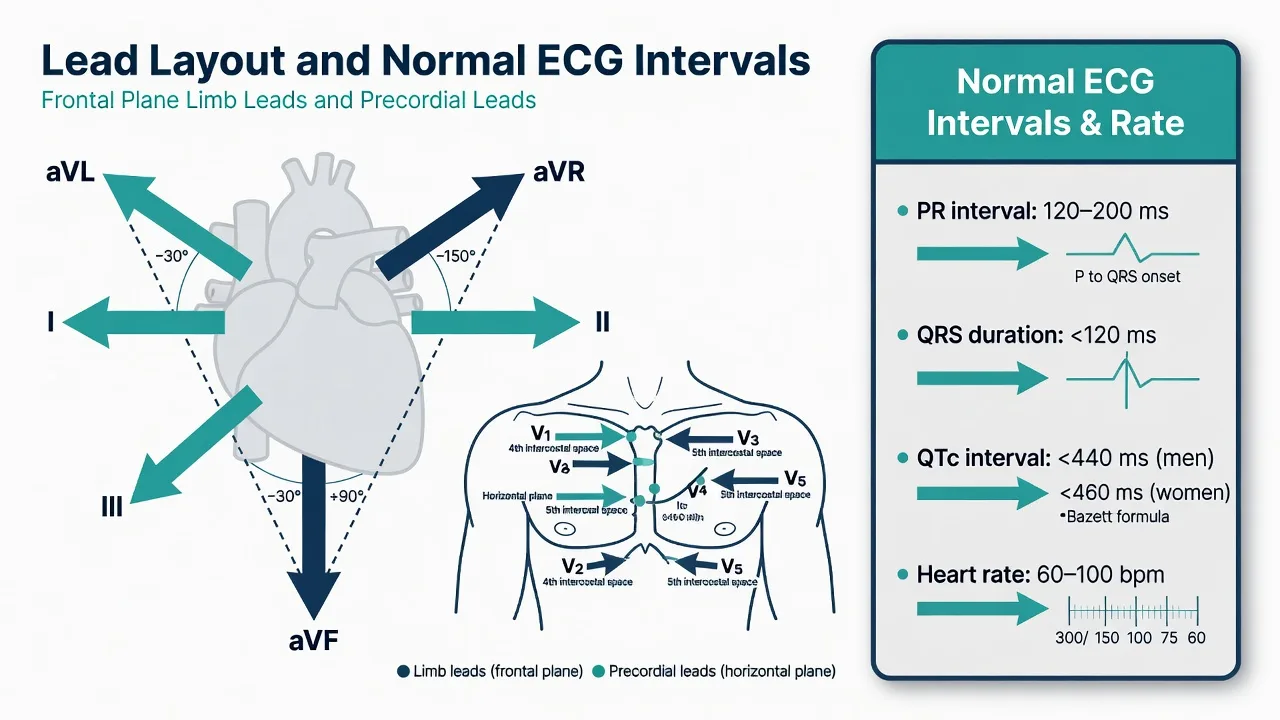
The intervals quantify conduction time through each segment of the system. The PR interval (the start of the P wave to the start of the QRS) is 120 to 200 milliseconds; a prolonged PR is first-degree atrioventricular block, and a progressively lengthening PR that drops a beat is Mobitz I (Wenckebach). The QRS duration reflects ventricular depolarisation; under 120 milliseconds is normal, and 120 milliseconds or more marks a bundle branch block or a ventricular origin. The QT interval is measured from the start of the QRS to the end of the T wave and is rate-corrected by Bazett's formula. [1]
[1]The R-wave progression in the precordials is checked here too: an rS in V1 should gradually become an Rs by V4. Poor progression (no R over 3 millimetres in V3) raises anterior infarction, left ventricular hypertrophy, or lead misplacement. [1]
Step 5 — Segments and waves — ST, T and pathological Q
The ST segment, the T wave and the Q wave carry the diagnosis of ischaemia, infarction and the channelopathies. The ST segment is isoelectric normally; ST elevation meets the STEMI threshold when it is 1 millivolt (1 millimetre) or more in two contiguous limb leads, or meets the gender-specific precordial thresholds in V2 and V3 — at least 2 millimetres in men 40 years and over, at least 2.5 millimetres in men under 40, and at least 1.5 millimetres in women.[1] ST depression is subendocardial ischaemia, reciprocal change (supporting an ST-elevation infarct elsewhere), or a digoxin effect (the downsloping sagging pattern). T-wave inversion is ischaemia when it is symmetrical and deep in the territory leads, but it is also normal in III, aVR and V1, and in the right precordials of children and young adults (the juvenile pattern). A pathological Q wave is 40 milliseconds or more wide AND 25 per cent or more of the following R wave in any lead except aVR; it marks an old infarct.
[1]Step 6 — Chambers — atrial enlargement and ventricular hypertrophy
Chamber enlargement changes the amplitude and the shape of the P wave and the QRS complex. Right atrial enlargement (cor pulmonale, pulmonary hypertension) produces P pulmonale — a peaked P wave taller than 2.5 millimetres in lead II, III or aVF. Left atrial enlargement (mitral disease, long-standing hypertension) produces P mitrale — a notched, bifid P wave wider than 120 milliseconds in lead II, with a deep broad negative component in V1. Left ventricular hypertrophy is diagnosed by voltage criteria with repolarisation changes (the strain pattern of lateral ST depression and T inversion). [1]
Left ventricular hypertrophy — the voltage criteria
SCORN
SV1 + RV5 or RV6 at least 35 millimetres (the classic criterion)
RaVL + SV3 over 28 millimetres in men or over 20 millimetres in women
Intrinsicoid deflection (time to peak R in V5/V6) prolonged
Lateral ST depression and T-wave inversion (the strain pattern) supports LVH
Voltage alone is insensitive — combine voltage, axis, and strain for the diagnosis
Right ventricular hypertrophy shows a tall R wave in V1 (an R-to-S ratio greater than 1), right-axis deviation, a deep S in V5 or V6, and a right ventricular strain pattern. [1]
Step 7 — Blocks — atrioventricular and bundle branch block
The block step closes the systematic read. Atrioventricular block is graded by degree: first-degree (PR over 200 milliseconds, every P conducts — usually benign, observe); Mobitz I (Wenckebach — the PR lengthens until a beat drops, usually at the AV node, often benign and managed by treating the cause); Mobitz II (a constant PR with a sudden non-conducted P, infranodal, frequently progresses to complete block, needs urgent pacing); 2-to-1 block (one P is conducted for every two — treat as Mobitz II until proven otherwise); and third-degree (complete heart block — the P waves and QRS complexes are independent, AV dissociation, needs urgent pacing). Bundle branch block is recognised by the QRS width and morphology: right bundle branch block has an rSR-prime in V1 (the rabbit ears) and a broad deep S in V6; left bundle branch block has a broad notched R in V5 and V6 with no Q waves and a discordant ST-T. Either block obscures the standard STEMI criteria, so occlusion in a broad-complex rhythm is judged by the Sgarbossa criteria. [1]
Differential diagnosis — broad-complex tachycardia
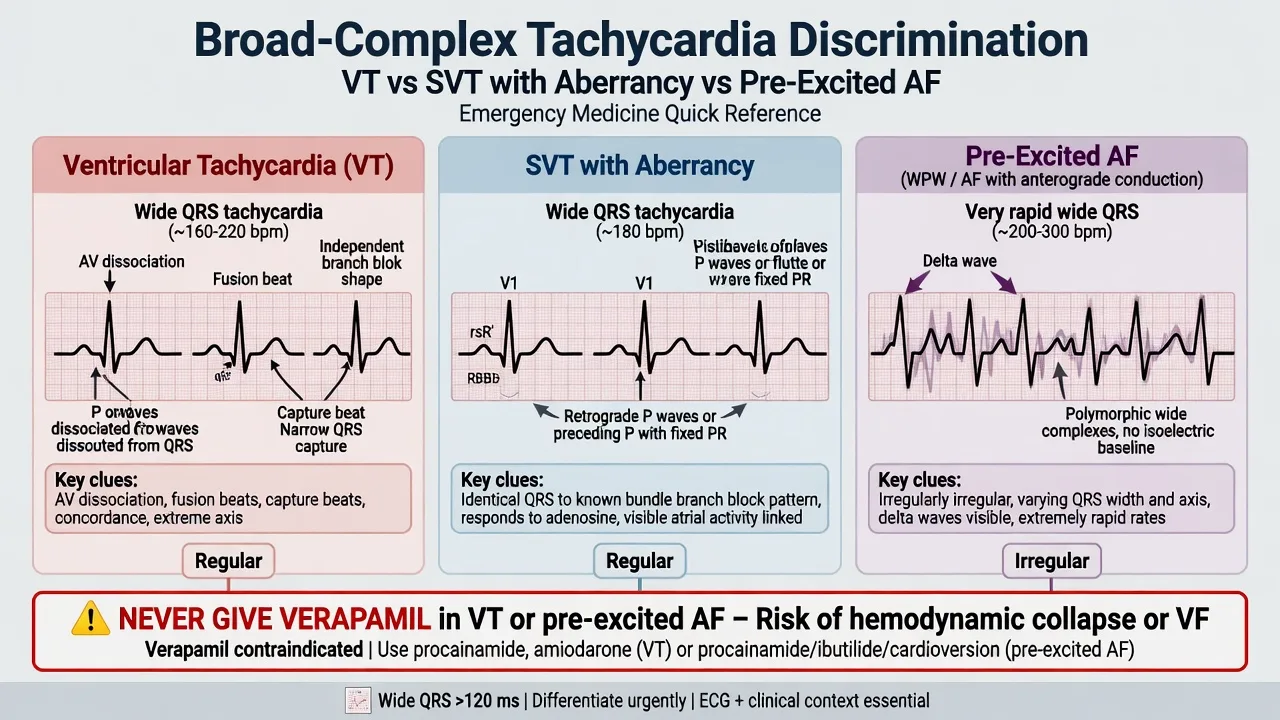
A broad-complex tachycardia (QRS 120 milliseconds or more, rate over 100) is the highest-stakes ECG decision because the treatment diverges immediately. A regular broad-complex tachycardia is ventricular tachycardia until proven otherwise, and the burden of proof is high. [1]
Ventricular tachycardia
- Commonest cause (>80%) in the patient with structural heart disease or prior infarction
- AV dissociation, capture beats, fusion beats are diagnostic
- Extreme axis deviation, concordance (all precordial QRS same direction) favour VT
- Stable: amiodarone 300 mg IV; unstable: synchronised cardioversion
SVT with aberrancy
- A narrow-complex SVT conducted through a bundle branch block or aberrant pathway
- A typical bundle-branch-block morphology (rSR in V1 for RBBB) favours aberrancy
- Responds to adenosine — but a diagnostic trial of adenosine is acceptable only with full monitoring
- Treat the underlying SVT after the rhythm is confirmed
Pre-excited AF (WPW)
- Irregular broad-complex with a delta wave and a chaotic baseline
- AV-node blockers (adenosine, verapamil, beta-blocker, digoxin) are contraindicated — they accelerate the accessory pathway
- Cardiovert the unstable; procainamide or amiodarone for the stable
- Highest risk of degeneration to ventricular fibrillation
Artefact / paced rhythm
- A motion or tremor artefact can mimic VT — check that a QRS follows every "complex" on the monitor
- A paced rhythm with a tracking pacer spike is broad-complex and regular
- Compare with the baseline paced ECG before treating
- Rarely needs an antiarrhythmic
The differentiators that confirm VT are atrioventricular dissociation (independent P waves marching through the QRS), a capture beat (a normal narrow QRS conducted through and caught among the wide ones), and a fusion beat (a hybrid of a conducted and a ventricular beat). When the diagnosis is genuinely uncertain, treat as VT. [1]
Differential diagnosis — narrow-complex tachycardia
A narrow-complex regular tachycardia (QRS under 120 milliseconds, rate over 100) is a supraventricular tachycardia. The differential is AV-nodal-re-entrant tachycardia (the commonest, no visible P waves, rate 150 to 250, terminates with adenosine), AV-re-entrant tachycardia (uses an accessory pathway, a Wolff-Parkinson-White substrate), atrial flutter (the sawtooth flutter waves, typically 2-to-1 block giving a rate near 150), focal atrial tachycardia, and sinus tachycardia (rate over 100 with a normal P-wave morphology — a diagnosis of exclusion, the response to a physiological stress such as sepsis, haemorrhage, or pain). An irregular narrow-complex tachycardia is atrial fibrillation or atrial flutter with variable block; the rate is controlled with a beta-blocker or a rate-limiting calcium-channel blocker, with anticoagulation guided by the CHA₂DS₂-VASc score. [1]
Management thresholds — the ECG-driven drug doses
The ECG does not stop at diagnosis; several readings immediately trigger a drug. The doses are committed to memory because the unstable patient cannot wait for a lookup. [1]
[1]The ECG-driven emergency drug doses
Common errors and pitfalls
The recurring errors are reading only the rhythm strip and missing the twelve leads; trusting the machine interpretation on an abnormal trace, which has a measurable false-negative rate for acute coronary syndrome at triage;[2] reading without the clinical context, when the addition of the clinical history demonstrably improves the accuracy of ECG interpretation;[3] failing to compare with the previous ECG; missing a high-lateral infarct that shows only in aVL and I; misreading a 2-to-1 block as sinus bradycardia; treating a broad-complex tachycardia with verapamil; giving an atrioventricular-node blocker to pre-excited atrial fibrillation; and stopping the read at the first abnormality, missing a second. The discipline is to finish every step on every trace.
Special populations
The paediatric ECG has age-dependent normal ranges (a faster rate, a shorter PR and QT, and a rightward axis in the newborn) and a dominant right ventricle in the neonate, so an adult template must not be imposed. The paced rhythm and the left-bundle-branch-block rhythm both obscure the standard STEMI criteria, so occlusion is judged by the Sgarbossa or the Smith-modified Sgarbossa criteria rather than raw ST elevation. Electrolyte disturbance changes the tracing — hyperkalaemia produces the tall peaked T wave, then a widened QRS, then the sine wave and asystole; hypokalaemia produces a flattened T, a prominent U wave, and a prolonged QT. Pregnancy shifts the heart and the axis but does not by itself change the intervals; the doses of adenosine and a synchronised cardioversion are safe in pregnancy. [1]
Evidence and regional guidelines
The contemporary thresholds for ST elevation and myocardial infarction are the Fourth Universal Definition of Myocardial Infarction, which sets the gender-specific V2-to-V3 criteria.[1] The interpretation of the ECG in the emergency department remains a human skill: the computer interpretation is safe for the clearly normal trace but should not be relied on for the abnormal or the borderline,[2] and the provision of the clinical history to the interpreter improves diagnostic accuracy.[3] The systematic rate-rhythm-axis-intervals-segments-chambers-blocks sequence and the peri-arrest drug doses (adenosine 6 to 12 mg for SVT, atropine 500 micrograms for bradycardia, amiodarone 300 mg for VT) are global and are consistent across the ANZCOR, Resuscitation Council UK/European, and ACLS frameworks; the local protocol governs the reperfusion pathway and the pacing service.
ANZ practice note. The systematic approach and the peri-arrest drug doses follow the ANZCOR advanced-life-support algorithm and the local cardiology pathway. Adenosine 6 then 12 mg is the SVT escalation, atropine 500 micrograms repeated to 3 mg is the bradycardia first line, and amiodarone 300 mg intravenously is the stable-VT choice; pre-excited atrial fibrillation is cardioverted and never given an AV-node blocker. The ECG is read by the treating clinician and corroborated against the previous trace before any disposition. [1]
Exam pearls
- Read every trace with the same sequence — rate, rhythm, axis, intervals, segments, chambers, blocks — then state the diagnosis. The method is the mark, not the one-liner.
- A regular broad-complex tachycardia is ventricular tachycardia until proven otherwise — amiodarone 300 mg if stable, cardiovert if unstable, never verapamil.
- The normal intervals: PR 120 to 200 ms, QRS under 120 ms, QTc under 440 ms in men and under 460 ms in women; over 500 ms is high torsades risk.
- The gender-specific STEMI thresholds in V2–V3: at least 2.5 mm in men under 40, 2 mm in men 40 and over, 1.5 mm in women.
- AV dissociation, capture beats and fusion beats confirm VT. Mobitz II, 2-to-1 block and complete heart block need urgent pacing.
- In a left bundle branch block or paced rhythm, use the Sgarbossa criteria — do not apply the standard STEMI thresholds.
- Hunt for the occlusion-OMI patterns: hyperacute T, de Winter, Wellens, posterior infarction, right ventricular infarction, Sgarbossa.
- The rate by the box method: 1 large box = 300, 2 = 150, 3 = 100, 4 = 75, 5 = 60, 6 = 50 per minute. For an irregular rhythm, count the complexes over a 30-second strip and double.
- The axis by the quadrant: lead I and aVF both positive is normal; I positive and aVF negative is left axis; I negative and aVF positive is right axis; both negative is extreme (north-west) — usually a lead malposition.
- An inferior STEMI with ST III greater than lead II is the right coronary artery — obtain the V4R, treat the right-ventricular infarct with fluid, avoid the nitrates.
- The Sgarbossa score: concordant ST elevation 5, concordant ST depression V1–V3 three, discordant ST elevation 2 — a score of 3 or more is highly specific for an LBBB infarct. The Smith-modified third criterion uses the proportional discordance (ST/S of 0.25 or more).
- Wellens — deep symmetrical T inversion in V2–V3, preserved R, resolved pain, critical proximal LAD: never stress-test. De Winter — upsloping ST depression with tall T, a static LAD occlusion equivalent. Both go to the cath-lab.
- Atrial flutter is a regular narrow tachycardia near 150 — the sawtooth in II, III and aVF; a regular narrow tachycardia at exactly 150 is flutter until excluded. [1]
Lead placement and the common errors
A poor-quality ECG cannot be rescued by a good read, and most "weird" traces are a lead-placement problem before they are a cardiac problem. The limb leads go on the wrists and ankles (or, for monitoring, on the torso at the shoulders and hips): the right arm, the left arm, the right leg (the neutral electrode) and the left leg. The six precordial leads are placed across the chest in a single horizontal arc at the fourth and fifth intercostal spaces — V1 and V2 at the right and left sternal borders of the fourth intercostal space, V3 at the midpoint between V2 and V4, V4 at the fifth intercostal space in the mid-clavicular line, V5 in the anterior axillary line at the same level as V4, and V6 in the mid-axillary line at the same level. The single commonest error is placing V1 and V2 too high (in the third, or even the second, intercostal space), which manufactures an rSR-prime in V1 that mimics a right bundle branch block and a T-wave inversion that mimics ischaemia. [1]
Precordial lead placement — the single horizontal arc
ANVILS
V1 right sternal edge, V2 left sternal edge — both at the FOURTH intercostal space (feel down from the sternal angle, the second space is just below it)
V3 sits midway between V2 and V4, never placed independently
V4 at the fifth intercostal space, mid-clavicular line — the apex beat
V5 in the anterior axillary line, at the same level as V4
V6 in the mid-axillary line, at the same level as V4 and V5
V4, V5 and V6 share one horizontal plane — a high or low arc distorts the R-wave progression
The limb-lead reversals each leave a fingerprint. A right-arm and left-arm reversal produces a globally negative lead I (the P, QRS and T all inverted) with a positive aVR, a pattern that is lethal if misread as a dextrocardia or a junctional rhythm — the clue is that lead I is a mirror of lead II and the precordials are normal. A right-arm and left-leg reversal produces a grossly abnormal trace with a flatline in lead II and huge complexes in lead III. A left-arm and left-leg reversal is subtler and is suggested by an unexpectedly low-voltage lead III. Reversal is excluded by re-placing the leads and repeating the trace — the diagnosis is in the technician, not the patient. [1]
[1]The seven-step read as a single checklist
The individual steps (rate, rhythm, axis, intervals, segments, chambers, blocks) are described in detail above; the discipline is to apply them, in order, on every trace without skipping one under cognitive load. The examiner wants to see the candidate verbalise each compartment aloud, then synthesise — never jump to a pattern. [1]
The seven-step systematic read — applied to every 12-lead ECG
1 — Rate
Regular rhythm: divide 300 by the number of large boxes between two R waves (1 box = 300, 2 = 150, 3 = 100, 4 = 75, 5 = 60). Irregular rhythm: count the QRS complexes across a 30-second strip and multiply by two. State the atrial and ventricular rates separately if the P waves outnumber the QRS.
2 — Rhythm
P before every QRS, QRS after every P, regular or irregular, narrow (under 120 ms) or broad (120 ms or more). A regular broad-complex tachycardia is ventricular tachycardia until proven otherwise.
3 — Axis
Quadrant method on lead I and aVF: both positive normal, I positive and aVF negative left axis, I negative and aVF positive right axis, both negative extreme axis. Check the precordial transition (V3 to V4) for poor R-wave progression.
4 — Intervals
PR 120 to 200 ms (over 200 is first-degree block); QRS under 120 ms (120 or more is a bundle branch block or a ventricular origin); QTc under 440 ms in men and under 460 ms in women, over 500 ms is high torsades risk.
5 — Segments and waves
ST elevation (gender-specific thresholds), ST depression (ischaemia, reciprocal, digoxin), T-wave inversion (ischaemic if symmetrical and territorial; normal in III, aVR and V1), pathological Q (40 ms wide and 25 per cent of the R). Hunt for the occlusion-OMI equivalents.
6 — Chambers
P pulmonale (peaked P over 2.5 mm in II/III/aVF), P mitrale (notched, bifid, broad, deep negative V1), left ventricular hypertrophy (Sokolow-Lyon or Cornell plus the strain pattern), right ventricular hypertrophy (tall R in V1, right axis, deep S in V6).
7 — Blocks
Atrioventricular block graded first, Mobitz I, Mobitz II, 2-to-1, and third-degree. Bundle branch block by the QRS morphology — rSR-prime in V1 for the right, broad notched R in V5/V6 for the left. In a broad-complex or paced rhythm, switch to the Sgarbossa criteria for occlusion.
The axis — worked examples and the pitfalls
The quadrant method is fast but coarse; the isoelectric-lead method is more precise and is the one to use when the axis is borderline. Identify the limb lead whose QRS complex is equiphasic (the positive and negative deflections cancel out): the mean axis then lies at 90 degrees to that lead, and the direction (positive or negative) is confirmed by inspecting any other limb lead. If no lead is equiphasic, the axis is roughly parallel to the most positive lead. The two methods should agree — if they do not, suspect a limb-lead reversal. [1]
Normal axis
- Minus 30 to plus 90 degrees
- Lead I positive and aVF positive
- The healthy adult default; rightward in the child and the neonate
Left axis
- Minus 30 to minus 90 degrees
- Lead I positive, aVF negative
- Causes: left anterior fascicular block (the commonest), left ventricular hypertrophy, inferior myocardial infarction, a pacing lead in the apex
Right axis
- Plus 90 to plus 180 degrees
- Lead I negative, aVF positive
- Causes: right ventricular hypertrophy, a left posterior fascicular block (only after excluding the lateral infarct), a lateral myocardial infarction, dextrocardia
Extreme (north-west)
- Minus 90 to minus 180 degrees; both I and aVF negative
- A lead malposition, an apical (ventricular) rhythm, or a severe right-ventricular-overload pattern
- Re-check the leads before diagnosing — this axis is most often technical
STEMI by coronary territory — the lead-to-artery map
The occluded artery is read from the territory that is elevated, and the reciprocal depression confirms the diagnosis and points to the opposing wall. Two refinements change the artery and the management: in an inferior ST-elevation, an ST elevation in lead III greater than in lead II favours the right coronary artery (and prompts a right-sided V4R to find the right-ventricular infarct); and a posterior infarction hides as a mirror image in V1 to V3 (a horizontal ST depression with a tall R and an upright T), confirmed by the V7-to-V9 leads. [1]
Anterior — LAD
- ST elevation in V1 to V4
- Reciprocal depression in II, III, aVF
- A proximal LAD occlusion — the highest-risk territory; watch for the cardiogenic shock, the left ventricular failure, and the heart block
Septal — LAD septal perforators
- ST elevation in V1 to V3
- Often combined with the anterior and the high-lateral pattern
- A larger territory than it looks; the Q waves develop early
Lateral — LCx / obtuse marginal
- ST elevation in I, aVL, and V5 to V6
- Reciprocal depression in II, III, aVF
- A high-lateral infarct may show only in aVL and lead I — never omit aVL from the read
Inferior — RCA (80%) or LCx (20%)
- ST elevation in II, III and aVF
- Reciprocal depression in I and aVL
- ST III greater than II favours the right coronary artery; obtain the V4R for the right-ventricular infarct and treat with fluid, avoid the nitrates
Right ventricular — proximal RCA
- ST elevation in V4R (the right-sided fourth intercostal space, mid-clavicular line)
- Almost always accompanies the inferior infarct
- Nitrate-sensitive — preload-dependent; give the fluid, avoid the nitrates and the diuretics
Posterior — RCA or LCx
- Horizontal ST depression V1 to V3 with a tall R and an upright T (the mirror image)
- Confirmed by the ST elevation in V7 to V9
- A true posterior infarct — the standard anterior leads underestimate it
Non-ST-elevation ACS and the ischaemic triple
The non-ST-elevation acute coronary syndrome is read as ST depression, T-wave inversion, or a normal ECG in a patient whose ischaemic story and troponin make the diagnosis. The ECG changes that flag a high-risk NSTE-ACS are a horizontal ST depression of 1 millimetre or more in two contiguous leads (the deeper and more widespread, the worse the prognosis), a deep symmetrical T-wave inversion across the anterior or lateral chest leads (a critical LAD or a multivessel lesion), and the dynamic changes that come and go with the pain and resolve at rest. A normal ECG never excludes the ACS — up to a fifth of the proven infarcts have a nondiagnostic initial trace, so the ECG is repeated at 15 to 30 minutes, the high-sensitivity troponin is serial, and the patient with ongoing pain is re-traced until a diagnosis is made or excluded. [1]
[1]Bundle branch block — right versus left
The bundle branch blocks are recognised by the widened QRS and the characteristic morphology. A right bundle branch block delays the right ventricle, which depolarises last and by way of the muscle, producing the classic rSR-prime (the "rabbit ears" or the "M-shape") in V1 and a broad deep S in V6. A left bundle branch block delays the left ventricle and produces a broad notched R in V5 and V6 with no septal Q wave and a deep S (or a QS) in V1. Either block obscures the standard ST-elevation thresholds, so occlusion in a broad-complex rhythm is judged by the Sgarbossa criteria — never by the raw ST elevation. [1]
Right bundle branch block
- QRS 120 ms or more; an rSR-prime (rabbit ears) in V1; a broad deep S in V6, I and aVL
- The repolarisation is discordant — an ST depression and a T inversion in V1 to V3 are normal for the block
- Common and often benign (the isolated RBBB); also from the right-heart strain, the pulmonary embolism, the Brugada pattern
- Incomplete RBBB (100 to 120 ms with the rSR-prime) is common in the young and the athlete
Left bundle branch block
- QRS 120 ms or more; a broad notched R in V5 and V6 with no Q wave; a deep S or a QS in V1
- Left-axis deviation is common; the appropriate (discordant) ST-T change hides the ischaemia
- A new LBBB in the chest-pain patient was once a STEMI equivalent — the modern guidance is the Sgarbossa criteria, not the appearance alone
- The LBBB masks the Q waves and the lateral infarct; the prior ECG is the anchor
The ED arrhythmia rapid-discrimination set
The arrhythmia decision is made in under a minute at the bedside: narrow or broad, regular or irregular, and the response to vagal manoeuvres or the adenosine. The table below is the rapid-discrimination set the trainee commits to memory. [1]
Atrial fibrillation
- Irregularly irregular; absent P waves; a fine fibrillatory baseline
- Narrow QRS unless there is an aberrancy or a pre-excitation
- Rate-controlled with a beta-blocker or a diltiazem; anticoagulated by the CHA₂DS₂-VASc
Atrial flutter
- Sawtooth flutter waves, best in II, III and aVF; an atrial rate near 300
- Typically a 2-to-1 block giving a ventricular rate near 150 — a regular narrow tachycardia at 150 is flutter until excluded
- Rate-controlled or rhythm-controlled; the cavotricuspid-isthmus ablation is curative
SVT (AVNRT)
- Regular narrow tachycardia at 150 to 250; no visible P wave (or a retrograde pseudo-r-prime in V1, a pseudo-S in the inferior leads)
- Terminates with the vagal manoeuvres then the adenosine 6 to 12 mg
- Distinguished from the sinus tachycardia (which has a normal P and a physiological cause) and the atrial flutter (the sawtooth)
Ventricular tachycardia
- Regular broad tachycardia at over 100; the AV dissociation, the capture and the fusion beats are diagnostic
- The commonest broad-complex tachycardia in the structural-heart patient (over 80 per cent)
- Amiodarone 300 mg IV if stable; synchronised cardioversion if unstable; never verapamil
Torsades de pointes
- A polymorphic broad-complex tachycardia on a long QT; the amplitude "twists" around the baseline
- The QT is prolonged (over 500 ms is high risk); stop the offending drug, correct the potassium
- Magnesium sulphate 2 g IV first; overdrive pacing or isoprenaline if recurrent; cardiovert if pulseless
Pre-excited AF (WPW)
- An irregular broad-complex tachycardia with a chaotic baseline and a delta wave
- The atrioventricular-node blockers (adenosine, verapamil, beta-blocker, digoxin) are contraindicated — they accelerate the accessory pathway
- Procainamide or amiodarone if stable; cardiovert if unstable
Hyperkalaemia — the ECG evolution
Hyperkalaemia is one of the few electrolyte disturbances that the ECG can both diagnose and track. The changes roughly parallel the rising potassium, though the correlation is imperfect and a normal ECG never excludes a high potassium — the blood test decides. The trainee learns the sequence because the trace drives the urgency: a peaked T at 6 is observed and treated, a sine wave at 9 is an arrest. [1]
The hyperkalaemic ECG evolution — as the potassium climbs
1
2
3
4
Digoxin effect versus digoxin toxicity
The digoxin effect is a therapeutic pattern, not a poisoning; the digoxin toxicity is a life-threatening one. The trainee must distinguish them, because the management is opposite — the effect is observed, the toxicity is treated with the digoxin-specific Fab fragments. [1]
Digoxin EFFECT (therapeutic)
- The "reverse tick" or the "Salvador Dali moustache" — a downsloping, sagging ST depression, especially in the lateral leads (V5, V6, I, aVL)
- A short QT interval and a flattened or inverted T wave
- Seen at therapeutic levels; no symptoms; the patient is observed, not treated
- The pattern persists for days to weeks after the drug is stopped
Digoxin TOXICITY (poisoning)
- Almost any arrhythmia is possible — a premature ventricular contraction, an atrial tachycardia with block, a Mobitz or a complete heart block, a bradycardia
- A BIDIRECTIONAL ventricular tachycardia is virtually pathognomonic
- Often with a hyperkalaemia (the digoxin poisons the sodium-potassium ATPase) and the gastrointestinal and the visual (yellow vision, xanthopsia) symptoms
- Treated with the digoxin-specific Fab antibody fragments, the correction of the potassium, and the magnesium
Sgarbossa and the Smith-modified criteria — occlusion in the LBBB and the paced rhythm
The standard ST-elevation thresholds do not apply when the ventricle depolarises abnormally — in a left bundle branch block, a right ventricular paced rhythm, or a ventricular rhythm — because the block itself repolarises the ST segment in a discordant direction. The Sgarbossa criteria were derived from the GUSTO-1 data to diagnose an evolving infarction in the left bundle branch block.[4] The three criteria, with their scores, are: (1) an ST elevation of 1 millimetre or more concordant with (in the same direction as) the dominant QRS, anywhere — 5 points; (2) an ST depression of 1 millimetre or more concordant in V1 to V3 — 3 points; and (3) an ST elevation of 5 millimetres or more discordant with the dominant QRS — 2 points. A score of 3 or more is highly specific for an acute myocardial infarction. The weakness of the original criteria is the third one — the fixed 5-millimetre threshold — which is insensitive because the amount of "normal" discordant elevation scales with the size of the QRS.
The Smith-modified Sgarbossa criteria replace the fixed 5-millimetre threshold with a proportional discordance rule: an ST elevation that is discordant and at least 25 per cent of the depth of the preceding S wave (an ST-to-S ratio of 0.25 or more). The modified criteria keep the original concordant criteria (1 and 2) and add the proportional discordance as the third; they were validated retrospectively by Meyers and colleagues, who showed a substantially improved sensitivity with a maintained specificity.[7] The same modified criteria have since been validated in the ventricular paced rhythm by Dodd and colleagues, extending the technique to the paced patient.[8]
The Sgarbossa criteria — the three rules and the score
Sgarbossa 1996 — GUSTO-1 (LBBB and acute MI)
New England Journal of Medicine, 1996
A retrospective analysis of the GUSTO-1 dataset, deriving a scoring system for the electrocardiographic diagnosis of an evolving acute myocardial infarction in the presence of a left bundle branch block, validated against the enzymatic infarct data.
Key finding
Three independent criteria were identified (concordant ST elevation, concordant ST depression in V1–V3, and discordant ST elevation of 5 mm or more). A score of 3 or more was highly specific for an acute infarction; the discordant-elevation criterion was the least sensitive.
Practice change
Derived from a selected population; the fixed 5-mm threshold of criterion 3 was later refined by the Smith-modified proportional-discordance rule to improve the sensitivity.
Meyers 2015 — Smith-modified Sgarbossa criteria
American Heart Journal, 2015
A retrospective case-control study validating the modified Sgarbossa criteria (the original concordant criteria plus a proportional discordance rule, an ST-to-S ratio of 0.25 or more) for the diagnosis of an acute coronary occlusion in the left bundle branch block.
Key finding
The modified criteria markedly improved the sensitivity for the acute coronary occlusion compared with the original Sgarbossa criteria, with a preserved specificity — the proportional discordance caught the occlusions the fixed 5-mm threshold had missed.
Practice change
A single-centre retrospective design; the criteria were subsequently validated prospectively and extended to the ventricular paced rhythm by Dodd and colleagues.
Wellens syndrome — the critical LAD stenosis warning
Wellens syndrome is the ECG signature of a critical proximal left anterior descending stenosis in a patient who has been admitted with chest pain that has now settled. The pattern was first described by de Zwaan and Wellens in patients with impending anterior infarction.[6] The classic features are a deep, symmetrical T-wave inversion in V2 and V3 (often extending to V1 and V4), preserved R waves (no pathological Q, no loss of the R progression), no or minimal ST elevation, and — the critical contextual clue — the tracing is recorded when the pain has resolved. The paradox is that the T-wave inversion is most prominent when the patient is pain-free, and it can normalise (the "pseudonormalisation") when the chest pain recurs; a trace taken during the pain may look deceptively normal.
[1]de Zwaan and Wellens 1982 — the critical LAD stenosis pattern
American Heart Journal, 1982
A descriptive study of the characteristic electrocardiographic pattern in patients admitted with unstable angina and impending myocardial infarction, who were found at the angiography to have a critical stenosis high in the left anterior descending coronary artery.
Key finding
A deep, symmetrical T-wave inversion in the anterior precordial leads (V2 to V3, often V1 to V4) with preserved R waves, recorded in the pain-free interval, identified a subgroup with a critical proximal LAD stenosis and a high risk of an anterior wall infarction.
Practice change
A small descriptive series, but the pattern has been repeatedly validated and remains a can-t-miss, do-not-stress-test syndrome.
de Winter T waves — the LAD occlusion equivalent
The de Winter pattern is an anterior ST-depression-and-tall-T complex that is an equivalent of a proximal LAD occlusion, even though it never meets the standard ST-elevation thresholds. It was described by de Winter and colleagues as a new ECG sign.[5] The features are an upsloping ST depression of 1 to 3 millimetres at the J point in V1 to V6 (and often I and aVL), with tall, symmetrical, prominent T waves in the same leads, and no ST elevation. Crucially, the pattern is static — unlike the hyperacute T wave that evolves into a STEMI within minutes, the de Winter pattern persists on the serial ECGs, which can lull the reader into a false reassurance. It is a proximal LAD occlusion until proven otherwise; the management is the emergency catheterisation, not the conservative ward admission.
de Winter 2008 — a new ECG sign of proximal LAD occlusion
New England Journal of Medicine, 2008
A descriptive case series from the Dutch angioplasty registry of patients with an acute anterior wall ischaemia who exhibited a characteristic pattern of upsloping ST depression and tall symmetrical T waves in the precordial leads, without the ST elevation.
Key finding
The pattern identified a proximal LAD occlusion that required an immediate reperfusion; the sign was stable over the serial ECGs and did not progress to the classic ST-elevation pattern.
Practice change
A descriptive series without a control group, but the pattern is now an accepted occlusion-myocardial-infarction equivalent and a trigger for the emergency catheterisation.
The QT interval and the torsades threshold
The QT interval is the total ventricular depolarisation-plus-repolarisation time, and it shortens with the tachycardia, so it is always corrected for the rate. The Bazett correction (the QTc equals the measured QT divided by the square root of the R-to-R interval in seconds) is the bedside standard; it over-corrects at the fast rates and under-corrects at the slow, but it is the threshold the guidelines use. A QTc over 440 milliseconds in men and over 460 in women is prolonged; over 500 milliseconds is the high-risk zone for the torsades de pointes. The causes are the electrolyte disturbance (the hypokalaemia, the hypomagnesaemia, the hypocalcaemia), the antiarrhythmics (the sotalol, the amiodarone, the quinidine, the procainamide), the antimicrobials (the macrolides, the fluoroquinolones), the antipsychotics (the haloperidol, the olanzapine, the ziprasidone), the methadone, and the congenital long-QT syndromes. The torsades is a polymorphic broad-complex tachycardia on a long QT that "twists" around the baseline; it is treated with the magnesium sulphate 2 grams intravenously, the withdrawal of the offending drug, the potassium and the magnesium repletion, and the overdrive pacing or the isoprenaline for the recurrent form.[10]
[1]The T wave, the U wave and the patterns to file
The T wave carries the channelopathies and the ischaemia. A tall peaked T wave is the hyperkalaemia or the hyperacute phase of an occlusion; a deep symmetrical T inversion is the ischaemia (the Wellens, the posterior infarct as a mirror, the "cerebral" T wave of a subarachnoid), and a broad-based, prolonged T with a long QT is the channelopathy or the drug effect. A biphasic T wave (positive then negative) in V2 to V3 is the Wellens pattern in its early phase. The U wave is a small deflection after the T; a prominent U wave is the hypokalaemia (and the bradycardia and the long QT), and an inverted U wave in the right precordials is the ischaemia or the left-ventricular-volume overload. The T and the U together — the "T-U fusion" of a profound hypokalaemia — produces a long, slurred repolarisation that lengthens the apparent QT and predisposes to the torsades. [1]
SAQs — exam practice
SAQ — Systematic interpretation of an inferior STEMI with right-ventricular extension
10 minutes · 10 marks
A 58-year-old man presents to the emergency department with 45 minutes of heavy central chest tightness radiating to the jaw, diaphoresis and nausea. He has a past history of hypertension and smokes 20 cigarettes a day. On arrival he is alert and diaphoretic: BP 96/62, HR 52 (regular), RR 20, SpO2 96 per cent on room air. A 12-lead ECG is performed within eight minutes of arrival. The trace shows ST elevation of 2 millimetres in leads II, III and aVF, with reciprocal ST depression in I and aVL; the ST elevation in lead III is greater than in lead II. The QRS is 100 milliseconds and the QTc is 440 milliseconds. You are shown the ECG and asked to interpret it.
SAQ — Complete heart block complicating an anterior STEMI
10 minutes · 10 marks
A 78-year-old woman is brought to the emergency department after two witnessed syncopal episodes in 12 hours. She describes no chest pain but has a past history of hypertension, type 2 diabetes and an anterior STEMI treated by primary PCI six months ago; her medications are aspirin, ticagrelor, bisoprolol 5 mg, ramipril 5 mg, atorvastatin 40 mg and furosemide 40 mg. On arrival she is alert but pale: GCS 15, BP 96/58, HR 32 (regular), RR 16, SpO2 95 per cent on room air. The 12-lead ECG shows a regular broad-complex bradycardia with a QRS of 130 ms at a ventricular rate of 32; the P waves march through independently at an atrial rate of 90 with no fixed relationship to the QRS.
Red flags
[1]References
- [1]Thygesen K, Alpert JS, Jaffe AS, et al. Fourth Universal Definition of Myocardial Infarction (2018) Circulation, 2018.PMID 30571511
- [2]Langlois-Carbonneau V, Chen AF, Dziarmaga A, et al. Safety and accuracy of the computer interpretation of normal ECGs at triage CJEM, 2024.PMID 39548031
- [3]Cruz MF, Brien SE, Zarnke K, et al. The effect of clinical history on accuracy of electrocardiograph interpretation among doctors working in emergency departments Med J Aust, 2012.PMID 22860793
- [4]Sgarbossa EB, Pinski SL, Barbagelata A, et al. Electrocardiographic diagnosis of evolving acute myocardial infarction in the presence of left bundle-branch block. GUSTO-1 (Global Utilization of Streptokinase and Tissue Plasminogen Activator for Occluded Coronary Arteries) Investigators N Engl J Med, 1996.PMID 8559200
- [5]de Winter RJ, Verouden NJ, Wellens HJ, et al. A new ECG sign of proximal LAD occlusion N Engl J Med, 2008.PMID 18987380
- [6]de Zwaan C, Bär FW, Wellens HJJ. Characteristic electrocardiographic pattern indicating a critical stenosis high in left anterior descending coronary artery in patients admitted because of impending myocardial infarction Am Heart J, 1982.PMID 6121481
- [7]Meyers HP, Limkakeng AT Jr, Jaffa EJ, et al. Validation of the modified Sgarbossa criteria for acute coronary occlusion in the setting of left bundle branch block: A retrospective case-control study Am Heart J, 2015.PMID 26678648
- [8]Dodd KW, Zvosec DL, Hart MA, et al. Electrocardiographic Diagnosis of Acute Coronary Occlusion Myocardial Infarction in Ventricular Paced Rhythm Using the Modified Sgarbossa Criteria Ann Emerg Med, 2021.PMID 34172301
- [9]Kligfield P, Gettes LS, Bailey JJ, et al. Recommendations for the standardization and interpretation of the electrocardiogram: part I: The electrocardiogram and its technology: a scientific statement from the American Heart Association Electrocardiography and Arrhythmias Committee, Council on Clinical Cardiology; the American College of Cardiology Foundation; and the Heart Rhythm Society: endorsed by the International Society for Computerized Electrocardiology Circulation, 2007.PMID 17322457
- [10]Rautaharju PM, Surawicz B, Gettes LS, et al. AHA/ACCF/HRS recommendations for the standardization and interpretation of the electrocardiogram: part IV: the ST segment, T and U waves, and the QT interval: a scientific statement from the American Heart Association Electrocardiography and Arrhythmias Committee, Council on Clinical Cardiology; the American College of Cardiology Foundation; and the Heart Rhythm Society: endorsed by the International Society for Computerized Electrocardiology Circulation, 2009.PMID 19228821
- [11]Hancock EW, Deal BJ, Mirvis DM, et al. AHA/ACCF/HRS recommendations for the standardization and interpretation of the electrocardiogram: part V: electrocardiogram changes associated with cardiac chamber hypertrophy: a scientific statement from the American Heart Association Electrocardiography and Arrhythmias Committee, Council on Clinical Cardiology; the American College of Cardiology Foundation; and the Heart Rhythm Society: endorsed by the International Society for Computerized Electrocardiology Circulation, 2009.PMID 19228820
- [12]Wagner GS, Macfarlane P, Wellens H, et al. AHA/ACCF/HRS recommendations for the standardization and interpretation of the electrocardiogram: part VI: acute ischemia/infarction: a scientific statement from the American Heart Association Electrocardiography and Arrhythmias Committee, Council on Clinical Cardiology; the American College of Cardiology Foundation; and the Heart Rhythm Society: endorsed by the International Society for Computerized Electrocardiology Circulation, 2009.PMID 19228819