EM · Quality and ED metrics
Quality and ED metrics — performance measurement, the four-hour target and quality improvement
Also known as National Emergency Access Target · NEAT · Four-hour rule · Access block · Emergency department overcrowding · Left without being seen · Plan-Do-Study-Act cycle · Statistical process control · Run chart · Benchmarking · Donabedian framework · Door-to-doctor time · Quality improvement in the ED
Quality and emergency department metrics — the Donabedian structure-process-outcome framework; the National Emergency Access Target (NEAT), the four-hour rule requiring 90 per cent of ED presentations discharged or admitted within four hours; the core ED metrics of time-to-treatment (door-to-doctor, door-to-ECG, door-to-antibiotic, door-to-needle), admission rate, LWBS (left without being seen) rate and mortality; access block (length of stay greater than eight hours for an admitted patient) and overcrowding as the dominant drivers of metric failure and excess mortality (Sprivulis, Guttmann, Howlett, Nicolaidis); the differential of drivers of access block (input, throughput and output factors); quality improvement methodology — Plan-Do-Study-Act, run charts with the probability-based rules for special-cause variation, statistical process control (SPC) Shewhart charts distinguishing common-cause from special-cause variation, and benchmarking against peer departments; and the unintended consequences of the target — gaming, premature discharge and short-stay-unit inflation. ACEM-primary, globally tagged.
On this page & tools
Your progress
Saved locally on this device.
5 MCQs with explanations
Target exams
Red flags
Related topics
- The Australasian Triage Scale — categories, validity, reliability and the under-triaged patient
- ED flow and access block — the input-throughput-output model, queuing theory, and the operational intervention ladder
- Patient disposition and safety-netting in the emergency department
- Medical error and patient safety in the emergency department
- Team-based care and crisis resource management in the emergency department
- Research, evidence-based medicine and biostatistics — appraising and applying evidence at the bedside
The emergency department is measured more intensely than almost any other clinical environment, and the measurement is not a bureaucratic exercise but a patient-safety instrument. Every metric the department tracks — the time from arrival to doctor, the proportion of patients through the door within four hours, the number who leave unseen, the proportion admitted, the number who die — is a quantitative surrogate for the quality of care the department delivers. The framework that connects these numbers to quality is Avedis Donabedian's structure-process-outcome model, and the framework that converts the numbers into improvement is the discipline of quality improvement: the Plan-Do-Study-Act cycle, statistical process control, run charts and benchmarking. The Fellowship candidate is expected to interpret a run chart, design a PDSA cycle, distinguish common-cause from special-cause variation, and explain why a four-hour target that is met by gaming harms patients as surely as one that is missed. The evidence that overcrowding and access block kill patients is now beyond reasonable dispute: Sprivulis and colleagues demonstrated excess mortality among patients admitted through crowded Western Australian emergency departments, Guttmann and colleagues linked longer waiting times to higher short-term mortality in Ontario, and the modern boarding literature (Howlett, Nicolaidis) confirms that patients warehoused in emergency department corridors come to measurable harm.[2][1][11]
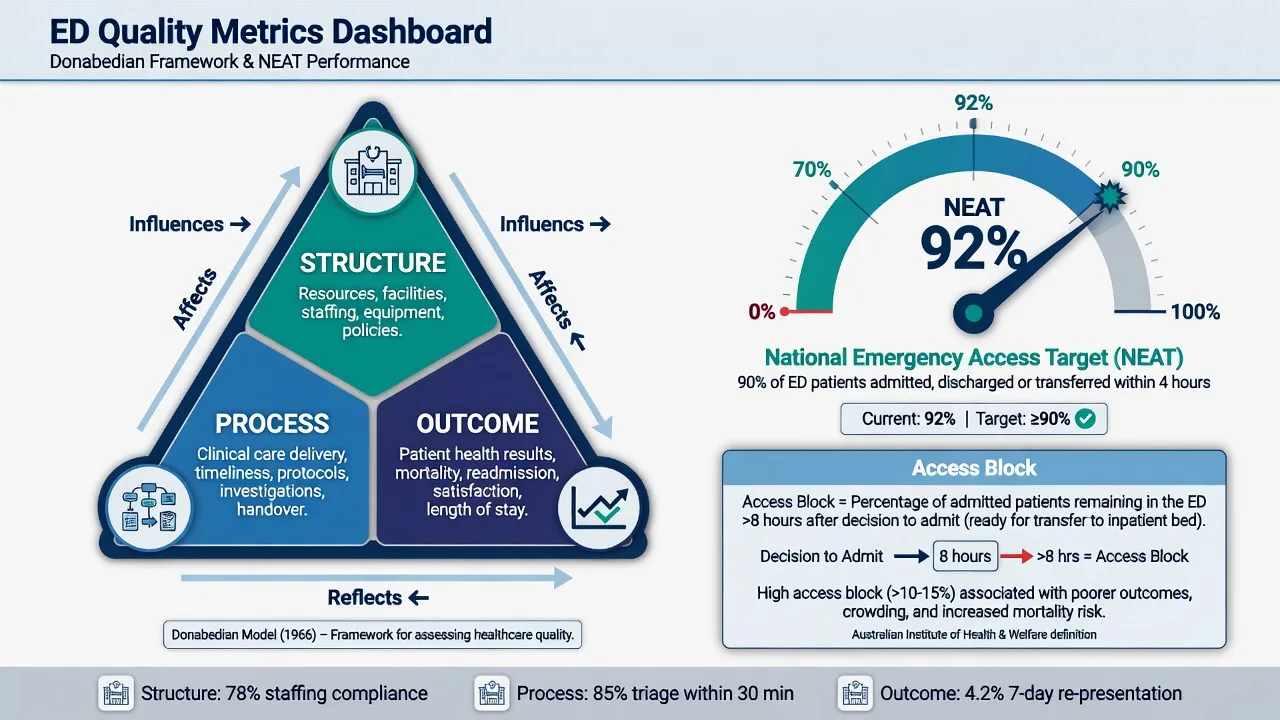
The Donabedian framework — structure, process and outcome
Donabedian's tripartite model remains the organising principle of quality measurement in healthcare, and it gives the candidate the vocabulary to classify any metric the examiner names. Structure is the input — the physical, organisational and staffing conditions under which care is delivered: the number of resuscitation bays, the consultant coverage hours, the availability of computed tomography, the nurse-to-patient ratio. Process is what is done — the clinical and administrative activities that constitute care: triage, the door-to-doctor time, the time to antibiotics in sepsis, the adherence to a clinical guideline. Outcome is what happens to the patient — mortality, revisits, patient experience, functional status. The logic of the model is a chain: structure enables process, process produces outcome, and the measurement of all three is required because each has blind spots the others cover.[8]
Process measures are attractive because they are sensitive to change and under the department's control, but they are surrogates — a fast door-to-antibiotic time does not guarantee a live patient at 30 days. Outcome measures are definitive but slow, confounded, and often too rare to drive day-to-day improvement (a department may go months between deaths that are attributable to process). Structure measures are the hardest to change and the most expensive, yet access-block literature confirms that structure — the number of inpatient beds downstream of the emergency department — is the single dominant determinant of every process and outcome metric the department tracks.[2][11]
[1]The National Emergency Access Target — the four-hour rule
The National Emergency Access Target (NEAT) is the defining emergency department performance metric of the Australian and, in its predecessor form, the United Kingdom system. NEAT requires that 90 per cent of all emergency department presentations are discharged home or admitted to an inpatient bed within four hours of arrival. The target was agreed by the Council of Australian Governments in 2011 and set for full implementation by 2015, and it built on Western Australia's earlier Four-Hour Rule programme, which Ngo and colleagues' trend analysis showed drove real reductions in ED length of stay across the major Perth hospitals.[5] The four-hour window is measured from the moment of arrival at the emergency department to the moment of departure — discharge, admission to a ward bed, or transfer — and it encompasses triage, assessment, investigation, treatment, and the decision and execution of disposition.
The intent of NEAT is humane and evidence-based: patients should not languish in emergency department corridors, and the long waits that Guttmann linked to excess mortality in Ontario should be eliminated. The target also functions as a whole-of-hospital measure, because it cannot be met by emergency department effort alone — it requires inpatient bed flow, timely specialty review, and the downstream capacity that only the hospital executive can provide. The evidence on NEAT's effect is mixed and instructive. Forero and colleagues' interrupted time series found that the four-hour target reduced access block and overcrowding, but its impact on 30-day mortality was modest and inconsistent, and Forero's subsequent work warned that the policy "cuts both ways": the pressure to clear patients within four hours can degrade the quality of the assessment and the safety of the disposition.[3][6]
[1]The core ED performance metrics — NEAT, time-to-treatment, admission rate, LWBS and mortality
The metrics the Fellowship candidate must define, interpret and act on fall into five families, and each carries a specific meaning, a specific failure mode and a specific improvement lever. [1]
NEAT compliance is the headline whole-of-system metric described above. Its failure mode is gaming and its improvement lever is whole-of-hospital bed flow. [1]
Time-to-treatment is the family of interval metrics that track the speed of the critical clinical actions, and these are the most directly actionable process measures because they sit inside the emergency department's own control. The high-yield intervals are door-to-triage (the time from arrival to the first nursing assessment, target within several minutes), door-to-doctor (the time from arrival to first medical assessment, the metric most sensitive to overcrowding and staffing), door-to-ECG (within 10 minutes for any patient with suspected cardiac chest pain), door-to-antibiotic (within one hour for sepsis or septic shock, a Surviving Sepsis Campaign bundle element), door-to-needle (within 60 minutes for ischaemic stroke thrombolysis, where every 15-minute delay costs measurable neurons and lives), and door-to-balloon (within 90 minutes for ST-elevation myocardial infarction percutaneous intervention). Each interval is itself a process metric under Donabedian, and each is tracked on a run chart or SPC chart so that deterioration is detected and a PDSA cycle is triggered. [1]
Admission rate is the proportion of emergency department presentations that result in admission, transfer or death in the department, and it is a marker both of case mix and of the availability of alternatives to admission. A rising admission rate may signal a sicker population, a loss of community and short-stay alternatives, or risk-averse decision-making under overcrowding; a falling rate may reflect genuine ambulatory management or may mask inappropriate discharges driven by target pressure. [1]
The LWBS rate — the proportion of patients who leave the emergency department after triage but before being seen by a doctor — is a safety and access marker rather than a throughput complaint. Hitti and colleagues' analysis of a hybrid triage model established that the dominant drivers of leaving without being seen are long waiting times and low acuity, but the patients who leave are not uniformly low-risk: a meaningful fraction harbour time-critical diagnoses, and a left-without-being-seen rate that is climbing is a patient-safety signal that demands investigation, not consolation that "they were probably not sick".[9] Scala and colleagues' machine-learning model demonstrated that LWBS risk is predictable from operational and demographic features, which allows targeted intervention — a triage protocol that fast-tracks the high-risk-wait patient.[10] Most departments aim for an LWBS rate below 2 per cent.
Mortality is the definitive outcome metric, reported as ED-based mortality (death in the department), in-hospital mortality, and 7-day or 30-day mortality after the emergency department visit. Sprivulis linked hospital overcrowding to mortality among patients admitted via Western Australian emergency departments, and Guttmann linked longer ED waiting times to higher short-term mortality and admission rates in Ontario — the two foundational studies that elevated overcrowding from an operational nuisance to a measurable killer.[2][1]
Access block and overcrowding — definitions and the burden of harm
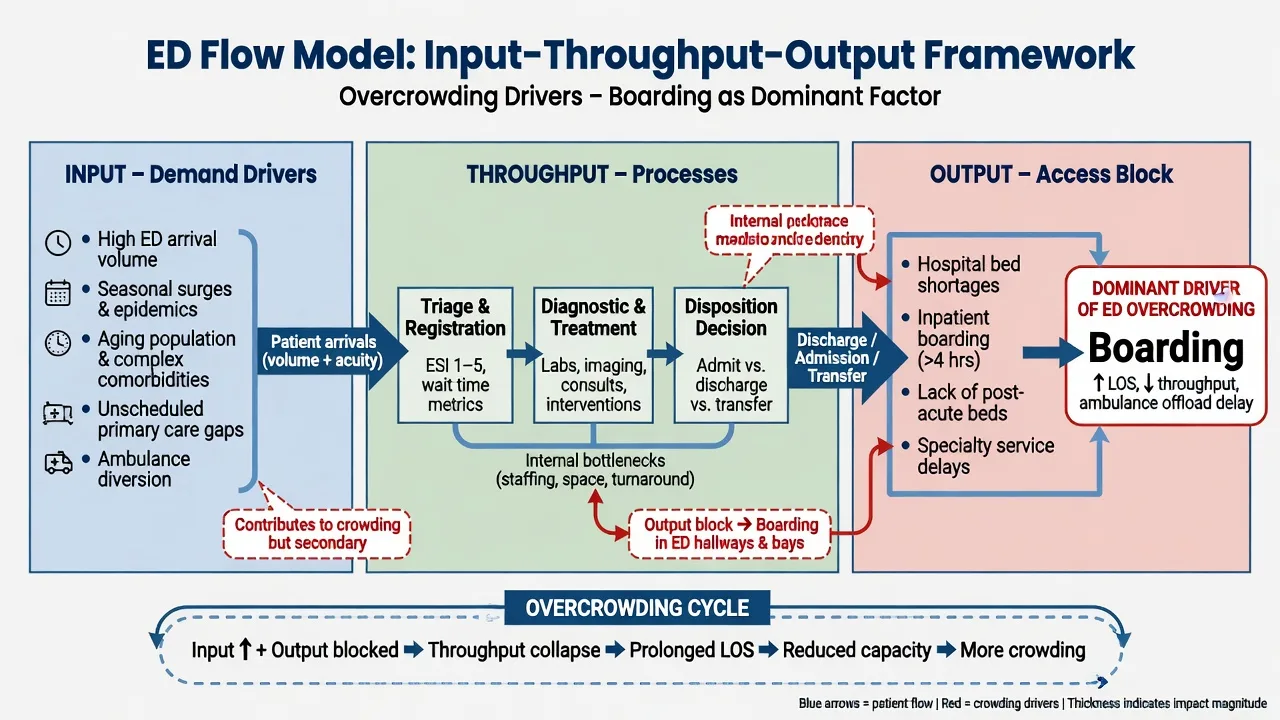
Access block is the situation in which patients who require admission to hospital cannot gain access to an appropriate inpatient bed within a reasonable time. The ACEM policy position defines it operationally: a total emergency department length of stay greater than 8 hours for a patient who is admitted to hospital (or transferred to another facility).[1] Access block is not an emergency department problem — it is a hospital-system problem whose consequence is felt in the emergency department, because the patient who should be on a ward occupies an emergency department trolley, blocks an assessment space, and waits for the next patient queued behind them.
Overcrowding is the related but distinct state in which emergency department demand exceeds the department's physical and staffing capacity — every bay full, patients on trolleys in corridors, ambulances queuing to offload, and the staff unable to deliver safe care. Overcrowding is measured by occupancy (the proportion of physical beds occupied), the number of patients boarding (admitted but awaiting an inpatient bed), and the validated crowding scores such as NEDOCS (National Emergency Department Overcrowding Scale) and EDWIN (Emergency Department Work Index). Howlett and colleagues' rapid review synthesised the modern evidence that medical patient boarding is a direct source of crowding and patient harm — delayed antibiotics, delayed analgesia, prolonged waits, and measurable excess mortality — and Nicolaidis and colleagues confirmed that boarding and occupancy, though related, differ in their association with early returns and adverse outcomes.[11][12]
The mortality signal is the reason the candidate must treat overcrowding as a clinical emergency, not an administrative inconvenience. Sprivulis and colleagues' Western Australian cohort study found that hospital overcrowding was associated with excess mortality among patients admitted via emergency departments, and Guttmann and colleagues' Ontario population study found that longer waiting times and the act of departing the emergency department before treatment was complete were both associated with higher short-term mortality and admission rates.[2][1] The mechanism is the cascade: the patient who boards in the emergency department corridor receives delayed antibiotics, delayed analgesia, delayed definitive treatment, and the second patient queued behind them receives delayed assessment — and each delay is, individually, a mortality multiplier.
Differential — the drivers of access block and overcrowding
When a department's NEAT compliance falls or its overcrowding worsens, the candidate must work through the differential of drivers, because the intervention differs for each. The drivers divide into three families — input, throughput and output — and the literature is unequivocal that the output-side drivers (access block) are the dominant cause, even when the input and throughput factors are the ones that draw the administrative attention.[2][7][11]
Output factors — access block and boarding
- The dominant driver: admitted patients who cannot access inpatient beds occupy emergency department trolleys, block assessment spaces, and queue the patients behind them
- Root cause is hospital-wide inpatient bed capacity, discharge delays, and the downstream flow that is outside emergency department control
- Intervention: whole-of-hospital bed-flow management, early senior discharge, discharge lounges, surgical streaming, and executive accountability for the 4-hour metric
- Distinguish from overcrowding: access block is the cause, overcrowding is the visible consequence in the emergency department
Throughput factors — inside the ED
- Delays within the emergency department itself: triage bottleneck, slow door-to-doctor, serial rather than parallel investigation, delayed senior review, slow decision-making, imaging and laboratory turnaround
- Khanna and colleagues mapped the patient journey and identified the bottlenecks — many sit inside the department and are amendable to local QI (parallel processing, team triage, senior decision-maker at the front door)
- Intervention: PDSA cycles on triage redesign, fast-track for low acuity, team-based assessment, senior early review, and laboratory and imaging turnaround targets
- Amendable to local control — the one family the emergency department can fix on its own
Input factors — rising demand
- Rising total attendances, ageing population with higher acuity, low-acuity attendances that would suit primary care, seasonal and epidemic surges, and the concentration of after-hours demand
- Real and growing, but the literature shows demand growth is a smaller driver of metric failure than output-side access block
- Intervention: demand management via primary care and urgent-care alternatives, telehealth triage, co-located general practice, and public health messaging
- Distinguish from the other two: demand-side interventions are long-term and population-level, not emergency-department-rescuable
Plan-Do-Study-Act — the quality improvement cycle
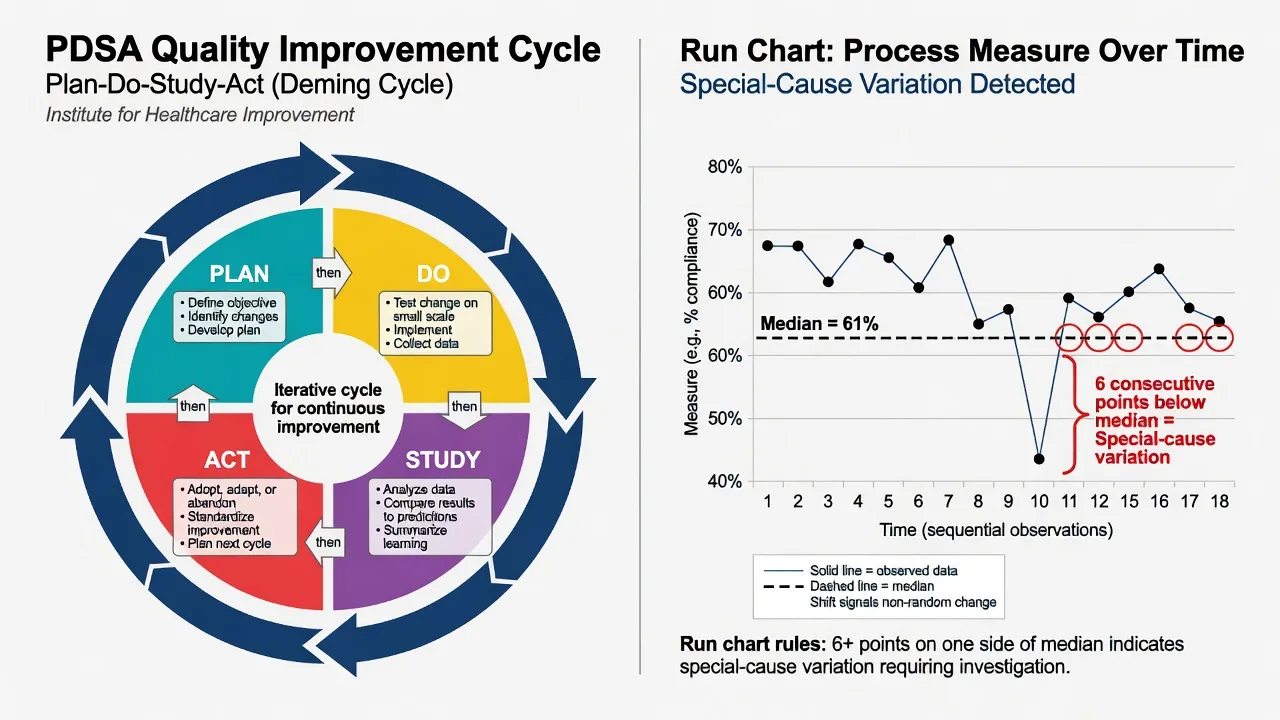
The Plan-Do-Study-Act (PDSA) cycle is the iterative, small-scale method by which a change is tested and refined before it is scaled, and it is the engine of quality improvement in healthcare. Originating in the work of Shewhart and Deming on statistical quality control in industry, and adapted to healthcare by Berwick and others, the PDSA cycle compels the improver to make an explicit prediction before the test, so that the result is informative rather than merely confirmatory. Taylor and colleagues' systematic review of PDSA applications in healthcare confirmed that the method is widely used and, when applied with fidelity — small-scale, time-bound, with a clear aim and a measurement plan — it achieves measurable improvement; the review also found that much published use is low-fidelity, with vague aims and no study phase.[13]
The four steps of the Plan-Do-Study-Act cycle
PDSA
State the aim (what exactly will improve, by how much, by when), the specific change to test, who will do it, on what scale (one shift, one bay, one day), and — crucially — a written prediction of what you expect to happen, so that the result is interpretable
Run the test on the small scale planned; collect the data prospectively; and record what actually happened, including the unexpected, the deviations from the plan, and the contextual factors (who was on, how busy)
Compare the result to the prediction using a run chart or SPC chart; did the metric improve, hold, or worsen? Was the change a real signal or random noise? Analyse the gap between prediction and result
Decide: adopt the change if it worked and standardise it; adapt it if it partially worked and re-test; abandon it if it failed. Then plan the next cycle on a larger scale or a different focus
Statistical process control and run charts — measuring change
A metric measured once is an anecdote; a metric measured over time is data; and a metric displayed on a statistical process control chart is information that distinguishes a real signal from noise. Statistical process control (SPC), developed by Walter Shewhart for manufacturing and translated to healthcare, plots a metric over time with a centre line (the mean) and control limits set at three standard deviations above and below. Waqas and colleagues' systematic review of control charts in healthcare confirmed that SPC is the methodological backbone of data-driven quality improvement, applied from mortality and infection surveillance to door-to-antibiotic time and waiting metrics.[14]
The central insight of SPC is the distinction between two kinds of variation. Common-cause variation is the inherent, random variability of a stable process — the day-to-day fluctuation around the mean that no single intervention will remove. Special-cause variation is the signal of a real change — an assignable cause that has shifted the process, whether for better (a successful intervention) or worse (a new hazard). The candidate's cardinal error is to react to common-cause variation as if it were special-cause — the single bad data point that triggers an investigation, a memo and a "crackdown" — because that reaction, called tampering, increases rather than reduces the variation. The discipline of SPC is to act only on special-cause signals and to improve common-cause variation only by redesigning the whole process, never by reacting to individual points. [1]
The run chart is the simpler and more widely used cousin of the full SPC chart: a time-series plot of the metric with a median centre line, and a set of probability-based rules that flag special-cause variation without requiring the calculation of control limits. Anhøj and Olesen's likelihood-ratio analysis established the diagnostic value of the run chart rules and quantified which combinations of rules give the best signal-to-noise trade-off.[15]
[1]Benchmarking — comparing performance
Benchmarking is the systematic comparison of a department's metrics against an external reference — peer departments of similar size and case mix, national medians, or an explicit target — and it serves two purposes. First, it identifies outliers: a department whose door-to-antibiotic time or LWBS rate sits far from its peers has either a problem worth investigating or a practice worth sharing. Second, it identifies best practice: the department at the top of the benchmark is studied so that its processes can be adapted locally — the essence of benchmarking is not the comparison but the learning that follows it. In Australasia the ACEM National Emergency Medicine Audit (NEM) provides the peer comparison; in the United Kingdom the NHS England Recovery Tracker publishes the four-hour standard by trust; in the United States the Centers for Medicare and Medicaid Services core measures and the Vizient benchmarking networks serve the same function. Benchmarking without subsequent improvement is merely surveillance; the value is in the PDSA cycle that the outlier finding triggers. [1]
Managing access block and overcrowding — the intervention ladder
The interventions that move the metrics fall in a ladder, and the candidate is expected to name them in the order that the evidence supports. The lowest rung — and the most commonly attempted — is the emergency-department-internal throughput intervention, effective for the throughput drivers but impotent against output-side access block. The highest and most effective rung is the whole-of-hospital structural change that creates inpatient bed flow, because access block is a downstream problem that cannot be solved inside the emergency department.[11][1]
[1]Model answer — a PDSA cycle to improve door-to-doctor time
Common errors and pitfalls
The recurring failures are the ones the measurement is meant to prevent, and several are themselves examinable. Gaming the target — discharging a patient before the assessment is complete, deferring the decision to admit until after the four-hour mark, inflating short-stay-unit admissions to classify patients as "admitted within four hours" — meets NEAT and harms the patient; Forero's work documented exactly this trade-off.[6] Tampering — reacting to a single common-cause data point with a crackdown — increases rather than reduces variation, and is the cardinal error of the non-SPC-literate manager. Confusing access block with overcrowding conflates cause and consequence, and locates the solution inside the emergency department where it cannot work. Treating LWBS as a throughput complaint rather than a safety signal misses the time-critical diagnoses among the patients who left. Benchmarking without PDSA produces surveillance but not improvement — the outlier is noted and nothing changes. Process measures without outcome confirmation celebrates a fast door-to-antibiotic time while the sepsis mortality holds steady because the antibiotic was the wrong one. A PDSA without a written prediction is uninterpretable because any result is rationalised after the fact. Attributing a run chart shift to the wrong cause — the improvement coincided with the new protocol, but it was actually the quieter month — is the ecological fallacy of before-and-after without a control.
Evidence and regional guidelines
The evidence base for emergency department quality measurement and improvement is grounded in Donabedian's structure-process-outcome framework and in the industrial quality-improvement methods of Shewhart and Deming, translated to healthcare. The mortality consequence of overcrowding and access block is established by Sprivulis and colleagues in Western Australia and by Guttmann and colleagues in Ontario, and confirmed in the modern boarding literature by Howlett and Nicolaidis.[2][1][11][12] The four-hour target evidence comes from the Forero interrupted time series and trend analyses, and from Ngo and colleagues' Western Australian evaluation.[3][5][6] The pay-for-performance evidence comes from Vermeulen and colleagues' Ontario difference-in-differences analysis.[8] The LWBS literature is anchored by Hitti and Scala.[9][10] The quality-improvement methodology is synthesised in Taylor and colleagues' PDSA systematic review, Waqas and colleagues' control-chart review, and Anhøj and Olesen's run chart likelihood-ratio analysis.[13][14][15]
ANZ practice note. The National Emergency Access Target (NEAT) requires 90 per cent of emergency department presentations discharged or admitted within four hours, agreed by the Council of Australian Governments in 2011 and set for full implementation by 2015. ACEM publishes the Policy on Access Block and Emergency Department Overcrowding (P02), which defines access block as a total emergency department length of stay greater than 8 hours for an admitted patient and frames it as a whole-of-hospital responsibility.[1] ACEM's National Emergency Medicine Audit (NEM) provides the benchmarking dataset against which peer departments compare their metrics. The Australian Commission on Safety and Quality in Health Care embeds clinical performance measurement in the NSQHS Standards. Most states publish emergency department performance dashboards monthly. New South Wales, Victoria and Western Australia run their own four-hour equivalents (NSW Rural and Metropolitan, Victoria Emergency Response, WA Four-Hour Rule legacy).
SAQ — NEAT failure and the four-hour rule: a whole-of-hospital metric
10 minutes · 10 marks
You are the director of a tertiary emergency department. This quarter the National Emergency Access Target compliance is 64 per cent, down from 81 per cent twelve months ago. The average boarding count is 16 admitted patients, the ambulance offload delay median is 48 minutes, and a recent 30-day mortality audit identified excess deaths among patients whose total emergency department length of stay exceeded eight hours. The hospital executive asks you to lead the quality-improvement response and to explain why the emergency department cannot deliver the target alone.
SAQ — Interpreting the ED quality dashboard: Donabedian, safety signals and improvement
10 minutes · 10 marks
You are reviewing the quarterly quality dashboard of a regional emergency department. The median door-to-antibiotic time for sepsis is 78 minutes (target within 60), the left-without-being-seen rate is 4.2 per cent (department target below 2), the admission rate is 28 per cent (peer median 22), and the 72-hour unplanned representation rate is 9 per cent (peer median 6). The medical director asks you to classify these metrics, identify which carry a patient-safety signal, and propose a structured improvement response.
Exam pearls
- NEAT = 90 per cent within 4 hours: 90 per cent of ED presentations discharged or admitted within four hours of arrival. A whole-of-hospital metric; the emergency department alone cannot deliver it.
- Access block = length of stay greater than 8 hours for an admitted patient (ACEM definition); the dominant output-side driver of every failed emergency department metric and of excess mortality (Sprivulis, Guttmann).
- Donabedian: structure-process-outcome — the classification framework; know where each metric sits. NEAT is a process metric; mortality is an outcome metric; bed numbers are structure.
- PDSA order is fixed: Plan (aim, change, prediction) → Do (small-scale test) → Study (compare to prediction on a run chart) → Act (adopt, adapt or abandon). The written prediction is the testable element.
- Run chart special-cause rules: a shift (six points one side of the median), a trend (five consecutive rising or falling), a run (too many or too few crossings), an astronomical point. Any one signals a real change; Anhøj and Olesen validated the combinations.
- Common-cause versus special-cause is the most testable distinction: react to special-cause, redesign for common-cause, and never tamper by reacting to a single common-cause point.
- LWBS is a safety marker, not a complaint — the patient who left may harbour a time-critical diagnosis; a rising LWBS rate is a patient-safety signal (Hitti, Scala).
- Gaming the target harms patients — premature discharge, decision-to-admit delay, short-stay-unit inflation (Forero, "cuts both ways").
- Time-to-treatment intervals to know: door-to-ECG 10 minutes (chest pain), door-to-antibiotic 60 minutes (sepsis bundle), door-to-needle 60 minutes (stroke thrombolysis), door-to-balloon 90 minutes (STEMI PCI).
- The intervention ladder for access block: emergency department throughput → short-stay units → inpatient bed flow → disposition alternatives → structural capacity; the only definitive fix is adequate downstream bed capacity. [1]
Red flags
[1]References
- [1]Guttmann A, Schull MJ, Vermeulen MJ, Stukel TA. Association between waiting times and short term mortality and hospital admission after departure from emergency department: population based cohort study from Ontario, Canada BMJ, 2011.PMID 21632665
- [2]Sprivulis PC, Da Silva JA, Jacobs IG, Frazer AR, Jelinek GA. The association between hospital overcrowding and mortality among patients admitted via Western Australian emergency departments Med J Aust, 2006.PMID 16515429
- [3]Forero R, McCarthy S, Hillman K. Impact of the four-hour National Emergency Access Target on 30 day mortality, access block and chronic emergency department overcrowding in Australian emergency departments Emerg Med Australas, 2019.PMID 30062847
- [4]Forero R, McCarthy S, Hillman K, Mohamed J, Fatovich D. Impact of the National Emergency Access Target policy on emergency departments' performance: A time-trend analysis for New South Wales, Australian Capital Territory and Queensland Emerg Med Australas, 2019.PMID 30043403
- [5]Ngo H, Forero R, McCarthy S, Mountain D, Fatovich D, Knott J, McCarthy A, Schull M. Impact of the Four-Hour Rule in Western Australian hospitals: Trend analysis of a large record linkage study 2002-2013 PLoS One, 2018.PMID 29538401
- [6]Forero R, Hillman K, McCarthy S, Fatovich D, Joseph T, Richardson D, Hutton A. When a health policy cuts both ways: Impact of the National Emergency Access Target policy on staff and emergency department performance Emerg Med Australas, 2020.PMID 31595671
- [7]Khanna S, Boyle J, Good N, Lind J. Analysing the emergency department patient journey: Discovery of bottlenecks to emergency department patient flow Emerg Med Australas, 2017.PMID 27862986
- [8]Vermeulen MJ, Guttmann A, Stukel TA, Bond AL, Ko DT, Lee DS, Tu JV, Schull MJ. The Effect of Pay for Performance in the Emergency Department on Patient Waiting Times and Quality of Care in Ontario, Canada: A Difference-in-Differences Analysis Ann Emerg Med, 2016.PMID 26215670
- [9]Hitti EA, Hadid D, Itani L, El Mokdad N, Harmouche E, Tamim H, Mufarrij A. Left without being seen in a hybrid point of service collection model emergency department Am J Emerg Med, 2020.PMID 31128935
- [10]Scala A, Spita D, Núñez AH, Belfiore MP, Langella S, Pagano A, Clemente F. Predicting patient risk of leaving without being seen using machine learning: a retrospective study in a single overcrowded emergency department BMC Emerg Med, 2025.PMID 40660109
- [11]Howlett N, Khan A, Barton A, Gray LD. Medical patient boarding in the emergency department as a source of crowding and delay-related harm, impacting patient outcomes and the efficiency of urgent and emergency care Emerg Med J, 2026.PMID 41672875
- [12]Nicolaidis R, Dugas M, Launay E, Bouzillé G, Fortin G, Gaborit C, Logier R, Cuggia M, Garcelon N. Emergency department boarding and occupancy differ in their association with early in-hospital mortality: A multicenter cohort Am J Emerg Med, 2026.PMID 42167132
- [13]Taylor MJ, McNicholas C, Nicolay C, Darzi A, Bell D, Reed JE. Systematic review of the application of the plan-do-study-act method to improve quality in healthcare BMJ Qual Saf, 2014.PMID 24025320
- [14]Waqas M, Aamir A, Ahmad MI, Ain QT, Almunefi H. Control charts in healthcare quality monitoring: a systematic review and bibliometric analysis Int J Qual Health Care, 2024.PMID 39018022
- [15]Anhøj J, Olesen AV. Diagnostic value of run chart analysis: using likelihood ratios to compare run chart rules on simulated data series PLoS One, 2015.PMID 25799549