EM · Research, EBM and biostatistics
Research, evidence-based medicine and biostatistics — appraising and applying evidence at the bedside
Also known as Evidence-based medicine · EBM · Critical appraisal · PICO · Number needed to treat · NNT · Likelihood ratio · Sensitivity and specificity · Confidence interval · Type I error · Type II error · Statistical power · Forest plot · GRADE · CONSORT · PRISMA
Research, evidence-based medicine and biostatistics — Sackett's definition of evidence-based medicine as the integration of best research evidence, clinical expertise and patient values; the hierarchy of evidence from meta-analysis and systematic review through randomised controlled trial, cohort, case-control, cross-sectional and ecological designs down to case series and expert opinion; formulating the focused clinical question with PICO (Population, Intervention, Comparator, Outcome); the three-question critical appraisal of validity, results and applicability; the measures of treatment effect — absolute and relative risk reduction, number needed to treat and to harm (NNT and NNH, Laupacis); the measures of diagnostic test performance — sensitivity, specificity, predictive values and likelihood ratios (Jaeschke); statistical inference — confidence intervals, p-values, type I and type II errors and power; synthesis of evidence in meta-analysis with heterogeneity (I-squared, Higgins), forest and funnel plots and publication bias; grading the body of evidence with GRADE and the risk-of-bias tools (Cochrane RoB 2, ROBINS-I) and the reporting guidelines (CONSORT, PRISMA, STROBE, QUADAS-2); and the differential of good versus poor quality evidence. ACEM-primary, globally tagged.
On this page & tools
Your progress
Saved locally on this device.
Target exams
Red flags
Related topics
- Quality and ED metrics — performance measurement, the four-hour target and quality improvement
- Medical error and patient safety in the emergency department
- Patient disposition and safety-netting in the emergency department
- Team-based care and crisis resource management in the emergency department
- Consent, capacity and the medico-legal framework in the emergency department
- Arterial blood gas interpretation — the systematic emergency department approach
The Fellowship candidate works in a department where every shift delivers a question that the textbook does not answer cleanly — does this chest pain need a second troponin, does this pancreatitis need antibiotics, does this resuscitation drug change mortality. Evidence-based medicine is the discipline that converts that uncertainty into a decision, and David Sackett defined it in terms the candidate must reproduce: the integration of the best research evidence with clinical expertise and the individual patient's values and circumstances.[1] The three legs are non-negotiable. Evidence without expertise produces protocol-bound care that ignores the patient in front of you; expertise without evidence produces confident but outdated practice; both without the patient's values produce a plan the patient will not follow. The biostatistical toolkit — the hierarchy of evidence, the PICO question, the measures of treatment and diagnostic effect, the confidence interval and the meta-analysis — is the machinery by which the evidence leg is built and tested.

Definition and scope — what evidence-based medicine is, and is not
Evidence-based medicine is not cookbook medicine, and it is not the slavish application of a guideline to every patient. It is the explicit, judicious and conscientious use of the current best evidence in making decisions about the care of an individual patient.[1] Three practical corollaries follow. First, evidence is graded, not binary: a well-conducted systematic review of trials stands above a single trial, and a single large blinded trial stands above a retrospective case series, and the candidate must weight the evidence accordingly. Second, evidence alone never decides — the clinician's expertise determines whether the trial population resembles the patient at the bedside, and the patient's values determine whether the benefit is worth the burden. Third, evidence-based medicine is self-correcting: today's best answer is tomorrow's superseded answer, and the practitioner who does not appraise the new evidence practices yesterday's medicine.
The hierarchy of evidence
The evidence pyramid ranks study designs by their susceptibility to bias and confounding, and the candidate must reproduce the order and explain why each rung sits where it does. [1]
The hierarchy of evidence, from strongest to weakest
6-5-4-3-2-1
Pooled, appraised evidence from multiple studies; strongest when the included studies are homogeneous and high quality, but only as good as the data pooled — garbage in, garbage out
Randomisation distributes known and unknown confounders equally between groups; the gold standard for therapy when blinded and adequately powered
Follows exposed and unexposed groups forward in time; establishes temporality and incidence, suited to rare exposures and common outcomes
Compares cases with the disease to controls without it, looking backward at exposure; efficient for rare diseases and outcomes
A single snapshot measuring prevalence, not incidence or causality; a case series describes a cluster without a control group
Inference from physiology, animal data or authority — the weakest evidence, useful only for hypothesis generation
The hierarchy is a guide, not a rule: a large, well-conducted observational study can be more trustworthy than a small, flawed trial, and the GRADE system moves beyond the rigid pyramid by rating the body of evidence across multiple dimensions.[9] A meta-analysis of poor trials is not stronger than the single good trial it contains — the candidate must appraise the inputs, not the rank.
Formulating the question — PICO
A clinical question that is not focused cannot be answered. Richardson and colleagues gave the discipline the PICO structure, which forces the clinician to specify the four elements before searching the literature.[2]
The outcome deserves its own discipline. A drug that lowers the lactate, the blood pressure or the troponin has moved a surrogate; a drug that lowers mortality, reduces intubation or returns the patient to independent living has moved a patient-centred outcome. The candidate who appraises a trial for a surrogate endpoint and assumes a mortality benefit has committed one of the cardinal errors of evidence interpretation. [1]
Study designs and their strengths
Each design answers a different type of question, and matching the design to the question is itself an examinable skill. A randomised controlled trial answers questions of therapy and harm: randomisation eliminates confounding by distributing both known and unknown prognostic factors equally, and blinding eliminates ascertainment bias. A cohort study follows groups forward in time, establishes temporality, and is the design of choice for a rare exposure and a common outcome (the Framingham cohort and smoking). A case-control study works backward from outcome to exposure and is the design of choice for a rare disease or outcome (a rare cancer and an occupational exposure), but it cannot yield incidence and is vulnerable to recall and selection bias. A cross-sectional study is a single-timepoint survey that measures prevalence, not causality, and is the design for "how common is this condition". An ecological study compares populations rather than individuals and is vulnerable to the ecological fallacy — inferring individual-level relationships from population-level data. A case series or report describes a cluster without a control and generates hypotheses but cannot test them. Mechanistic and animal studies sit at the base and support plausibility, never proof. [1]
[1]Critical appraisal — validity, results, applicability
The Users' Guides to the Medical Literature distil appraisal into three questions, asked in order, and the candidate must reproduce them.[3][4]
Internal validity is the gate: a result from a methodologically flawed study is not a result, it is noise. The Cochrane risk-of-bias tools operationalise the appraisal. RoB 2 assesses randomised trials across five domains — randomisation, deviations from intended interventions, missing outcome data, measurement of the outcome, and selection of the reported result.[11][12] ROBINS-I performs the same function for non-randomised studies of interventions, adding confounding and selection of participants to the domains.[13] The output is a domain-by-domain judgement of low, some concerns, or high risk of bias, and a trial at high risk of bias must be down-weighted no matter how large its effect.
Measures of treatment effect — absolute and relative risk, NNT and NNH
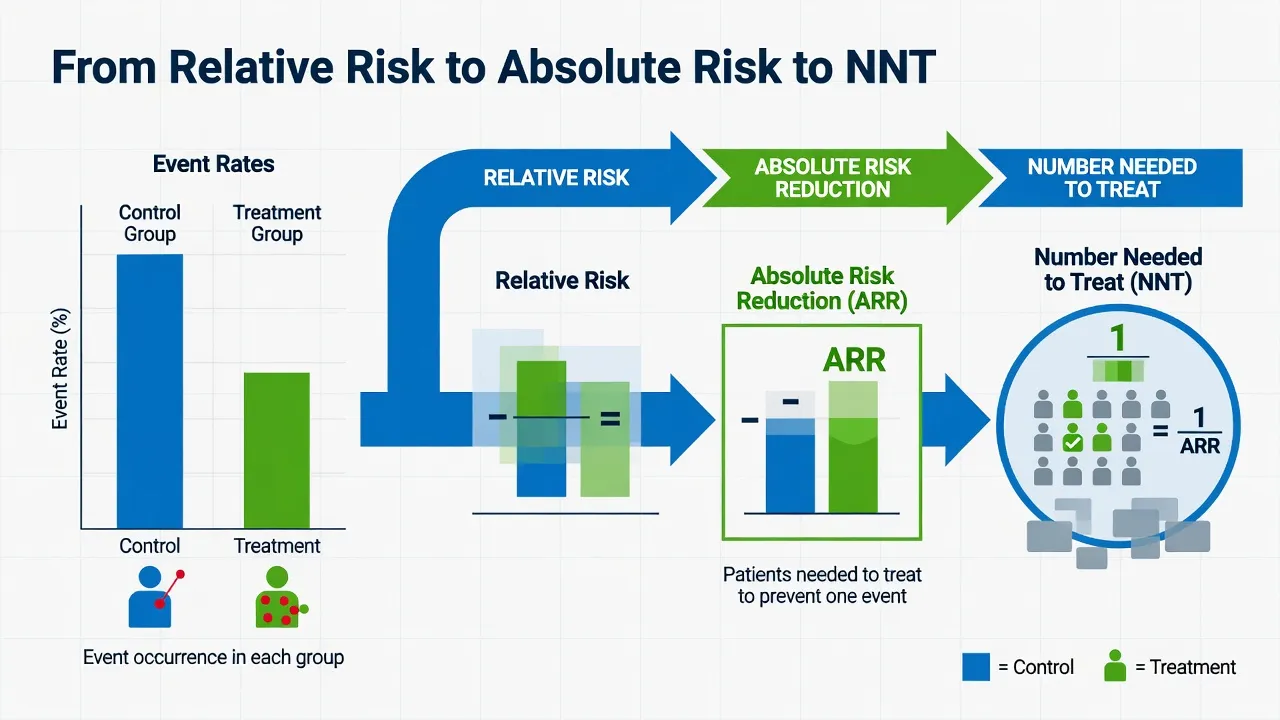
A trial compares the event rate in the treated group (the experimental event rate, EER) with the event rate in the control group (the control event rate, CER). The candidate must derive every measure from these two numbers.[3]
The relative risk reduction is the commonest vehicle for exaggeration. A trial that halves the risk (RRR 50 per cent) sounds transformative, but if the baseline risk is 2 per cent the absolute benefit is 1 per cent and the number needed to treat is 100 — a hundred patients treated for one to benefit. Laupacis and colleagues argued that the number needed to treat is the most clinically intuitive measure because it expresses the effort required for one favourable outcome, and it is the measure the candidate should bring to the shared decision.[3]
Worked calculation — the CRASH-2 trial
Measures of diagnostic accuracy — sensitivity, specificity, predictive values, likelihood ratios
A diagnostic test is appraised against a reference standard, and the four-fold table yields the measures the candidate must define and apply.[4]
[1]The clinical trap is base-rate neglect. A test with 99 per cent sensitivity and 99 per cent specificity applied to a disease with a 1 in 1000 prevalence yields a positive predictive value of only 9 per cent — nine of every ten positive tests are false positives, because the disease is so rare that even a small false-positive rate overwhelms the true positives. This is why screening a low-prevalence population generates harm, and why the candidate must always interpret a positive test through the pre-test probability. [1]
The likelihood ratio is the prevalence-independent measure that converts the pre-test probability into the post-test probability, and it is the gold-standard quantitative tool for diagnostic reasoning.[4] LR+ = sensitivity / (1 − specificity); an LR+ above 10 substantially raises the probability of disease and helps rule in. LR− = (1 − sensitivity) / specificity; an LR− below 0.1 substantially lowers the probability and helps rule out. The Fagan nomogram converts a pre-test probability directly to a post-test probability through the likelihood ratio, and the clinician who uses it quantifies what the bedside gestalt only approximates.
Statistical inference — confidence intervals, p-values, type I and type II error

The confidence interval expresses the precision of an estimate, and it is more informative than the p value alone. A 95 per cent confidence interval is the range that, over repeated sampling, would contain the true value 95 per cent of the time; a narrow interval reflects a large, precise study, a wide interval reflects a small or variable one. The interval that crosses unity (for a ratio) or zero (for a difference) is consistent with no effect, no matter how small the p value. [1]
The p value is widely misunderstood and the candidate must state it correctly. It is the probability of observing data as extreme as, or more extreme than, those observed if the null hypothesis were true — it is not the probability that the null hypothesis is true, and it is not the probability that the result is due to chance. A small p value rejects the null; it does not quantify the magnitude or the importance of the effect. [1]
[1]The candidate must connect these errors to sample size: power increases with the size of the expected effect, the variability, the significance threshold and the number of participants. A trial must be powered to the smallest clinically important difference, not to an optimistically large one, and the trial that does not reach its recruitment target cannot exclude that difference. [1]
Synthesising evidence — meta-analysis, heterogeneity and publication bias
A meta-analysis pools the results of independent studies to produce a single weighted estimate, displayed on a forest plot with each study a square (sized by its weight) bisected by a horizontal line (its confidence interval), the pooled estimate a diamond at the bottom. The pooling method matters: a fixed-effect model assumes all studies share one true effect and is valid only when the studies are homogeneous; a random-effects model, such as the DerSimonian-Laird approach, assumes the true effects vary across studies and produces wider, more honest intervals when they do. [1]
Heterogeneity is the degree to which the study results differ beyond chance, and it is quantified by the I-squared statistic — the percentage of total variation across studies attributable to heterogeneity rather than sampling error.[10] An I-squared of zero to 25 per cent is low, 25 to 50 per cent moderate, and above 50 per cent substantial; a meta-analysis with substantial heterogeneity does not deliver a single trustworthy estimate, and the candidate must explore the sources (different populations, doses, outcome definitions) rather than over-read the pooled diamond.
Publication bias is the tendency for positive studies to be published and null studies to languish in filing cabinets, and it inflates the pooled estimate of any meta-analysis that does not search for the unpublished. The funnel plot displays study precision against effect size; an asymmetrical funnel, formally tested by the Egger test, suggests that small null studies are missing. A meta-analysis built on a biased literature inherits the bias. [1]
Grading the evidence — GRADE, risk of bias and reporting guidelines
The GRADE system rates the body of evidence for each outcome, not each study, and it is the framework that ACEM, NICE and the World Health Organization use to translate evidence into recommendations.[9] Randomised trials begin as high quality and observational studies as low; the quality is then downgraded for risk of bias, inconsistency (heterogeneity), indirectness (the population or outcome does not match the question), imprecision (wide confidence intervals) and publication bias, and upgraded for a large effect, a dose-response gradient, or plausible confounding that would have minimised the observed effect. The final rating is high, moderate, low or very low, and it determines whether a recommendation is strong or weak.
The reporting guidelines impose a standard on what authors must report, and the candidate must name the design and the guideline it follows. CONSORT governs randomised trials, PRISMA governs systematic reviews and meta-analyses, STROBE governs observational studies, and QUADAS-2 governs diagnostic accuracy studies.[5][6][7][8] A study that has not followed its reporting standard has not been appraised, and the candidate who cannot name the standard cannot judge the appraisal.
Applying evidence — a worked treatment decision at the bedside
The final step is applicability, and it is the step most often skipped. The candidate who reads a trial, computes the NNT and prescribes the drug has missed the patient. Three questions complete the transfer. Does the patient resemble those in the trial — the same age, the same severity, the same comorbidities, or so different that the result cannot transfer? Is the outcome the one the patient cares about — mortality and functional recovery, not a surrogate? Are the benefits worth the harms and the burden, and does the patient agree? [1]
A worked example anchors the method. A registrar appraising the RECOVERY trial asks whether a 70-year-old ventilated patient with COVID-19 should receive dexamethasone 6 milligrams once daily for up to ten days.[15] The PICO matches — ventilated patients with COVID-19, dexamethasone against standard care, 28-day mortality. The methods are sound — large, randomised, open-label with blinded outcome ascertainment, low risk of bias. The result reduced mortality from 41 per cent to 29 per cent in ventilated patients (ARR 12 per cent, NNT 9), and the 95 per cent confidence interval excludes no effect. Applicability holds — the patient matches the trial population, the outcome is patient-centred, and the patient and family accept the small risk of hyperglycaemia and secondary infection. The decision is evidence-based.
The same method applied to thrombolysis in ischaemic stroke shows the reverse discipline. Emberson and colleagues' individual-patient-data meta-analysis confirmed that alteplase 0.9 milligrams per kilogram (maximum 90 milligrams) improves functional outcome when given early, but the benefit falls steeply with time and is offset by symptomatic haemorrhage in the older and more severe patient.[16] The candidate who applies the trial to a 92-year-old with a severe stroke at four and a half hours has transferred the result without transferring the nuance — and the patient is harmed. Appraisal is not a single step; it is the discipline that decides whether the evidence reaches the bedside at all.
Differential — good versus poor quality evidence
The candidate must distinguish good from poor evidence at the bedside, and the distinction is not the design alone but the design combined with conduct and the body of evidence around it. [1]
High-quality evidence
- A systematic review with low heterogeneity of large, blinded, adequately powered randomised trials, reported under PRISMA, with a GRADE rating of high — the result is trustworthy and the recommendation strong
- A single large pragmatic randomised trial with allocation concealment, blinding of outcome assessment, complete follow-up and intention-to-treat analysis, reported under CONSORT
- A diagnostic study with a consecutive and relevant spectrum, an independent blinded comparison against a reference standard, appraised under QUADAS-2 with low concern
- The clinician can act on the point estimate and the confidence interval without reservation
Plausible but limited evidence
- A single randomised trial that is small, single-centre, or with incomplete blinding — real signal but imprecise, to be confirmed
- A well-conducted cohort study where randomisation is unethical (smoking and lung cancer) — strong but observational, downgraded for residual confounding
- A meta-analysis with moderate heterogeneity (I-squared 30 to 50 per cent) — pooled estimate useful but explore the variation
- GRADE moderate or low: act with caution, share the uncertainty with the patient
Poor quality or misleading evidence
- A small underpowered trial reporting no difference, cited as proof of no effect — absence of evidence is not evidence of absence
- A trial reporting only the relative risk reduction and omitting the absolute benefit and the NNT — statistical significance without clinical importance
- A meta-analysis with I-squared above 50 per cent whose authors present a single pooled estimate without exploring the heterogeneity — the diamond misleads
- A surrogate-endpoint trial, a post-hoc subgroup analysis, or a manufacturer-funded pooled analysis presented without the conflicts — hypothesis-generating only
No usable evidence
- Expert opinion, mechanistic reasoning and animal data in the absence of human trials — the weakest rung, suited to hypothesis generation only
- A case series describing a cluster without a control group — generates the question but cannot answer it
- The clinician must then fall back on first principles, the nearest applicable evidence, and explicit shared decision-making with the patient
Common errors and pitfalls
The recurring errors are the ones the appraisal exists to prevent. Confusing relative with absolute risk — citing the RRR without the ARR inflates a trivial benefit into a transformative one; the NNT is the antidote. Base-rate neglect — applying a highly sensitive and specific test to a low-prevalence population and acting on every positive, generating harm from false positives. Misreading the p value — equating statistical significance with clinical importance, or reading "no significant difference" as "no effect" in an underpowered study. Over-reading the meta-analytic diamond — accepting a pooled estimate from a heterogeneous literature as if it were a single trial. The ecological fallacy — inferring individual risk from population-level data. Spectrum bias — appraising a diagnostic test on a cohort of the clearly diseased and the clearly well, then applying it to the undifferentiated patient in whom it performs far worse. Surrogate endpoints — accepting a drug that lowers the number without changing the outcome the patient cares about. Data dredging and multiple comparisons — a trial with 30 outcomes will have one or two "significant" results by chance alone; pre-specified primary endpoints are the defence. Citing the abstract without the methods — the abstract reports what the authors chose to highlight, the methods report what they did. Failing to appraise applicability — transferring a result to a patient who does not resemble the trial population, or ignoring the patient's values. The ungraded guideline — following a recommendation whose evidence base is low or very low as if it were iron. [1]
Evidence and regional guidelines
The evidence base for the discipline is the Users' Guides to the Medical Literature, originating with the McMaster group and Sackett, formalising PICO, the appraisal questions and the measures of effect.[1][2][3][4] The synthesis methods are consolidated in the Cochrane Handbook, the heterogeneity framework in Higgins, and the risk-of-bias tools in the Cochrane RoB 2 and ROBINS-I.[10][11][12][13] The reporting standards are CONSORT, PRISMA, STROBE and QUADAS-2.[5][6][7][8] The grading framework is GRADE.[9]
ANZ practice note. The National Health and Medical Research Council (NHMRC) levels of evidence and the GRADE framework underpin Australian guideline development, and the Cochrane collaboration, with its Australasian centre, is the global home of systematic review methodology. The Australian Commission on Safety and Quality in Health Care embeds evidence-based care in the National Safety and Quality Health Service Standards. The ACEM Curriculum Framework positions the Scholar role — critical appraisal, research literacy and the application of evidence — as a core Fellow attribute, and candidates are expected to interpret a forest plot, a 2x2 diagnostic table and a confidence interval in the written and clinical examinations. [1]
Exam pearls
- Sackett's definition: the integration of best research evidence, clinical expertise and patient values — reproduce verbatim.
- Hierarchy: meta-analysis greater than RCT greater than cohort greater than case-control greater than cross-sectional and case series greater than expert opinion — ranked by susceptibility to bias.
- PICO: Population, Intervention, Comparator, Outcome — the focused question; add Timing and Setting for PICOTS.
- NNT = 1 / ARR: the most intuitive measure of treatment benefit; never accept RRR without the ARR.
- PPV depends on prevalence: a sensitive and specific test yields a poor PPV when disease is rare — base-rate neglect.
- LR+ above 10 rules in, LR− below 0.1 rules out — the likelihood ratio is prevalence-independent.
- The 95 per cent CI: the precision of the estimate; an interval crossing unity or zero is consistent with no effect.
- p value: probability of the data given the null, not the probability the null is true; small p is not proof of importance.
- Type I = alpha = false positive (0.05); Type II = beta = false negative (0.2); Power = 1 − beta (0.8).
- I-squared: 0 to 25 per cent low, 25 to 50 moderate, above 50 substantial heterogeneity — do not over-read the diamond.
- GRADE: start high for RCTs, downgrade for bias/inconsistency/indirectness/imprecision/publication bias; rate the body, not the study.
- Reporting standards: CONSORT (RCT), PRISMA (systematic review), STROBE (observational), QUADAS-2 (diagnostic accuracy). [1]
Exam practice
SAQ — Critical appraisal of a therapy trial reported as a 50 per cent relative risk reduction
10 minutes · 10 marks
You are asked to appraise a randomised controlled trial of a new anticoagulant in 2000 patients with the acute myocardial infarction. The trial reports a relative risk reduction of 50 per cent for the composite of death or stroke (p=0.04). The event rate is 2 per cent in the control group and 1 per cent in the treatment group.
SAQ — A positive screening test in a low-prevalence population
10 minutes · 10 marks
A new rapid test for a disease with a prevalence of 1 in 1000 has 99 per cent sensitivity and 99 per cent specificity. Your patient tests positive and asks whether they have the disease.
Red flags
[1]References
- [1]Sackett DL, Rosenberg WM, Gray JA, Haynes RB, Richardson WS. Evidence based medicine: what it is and what it isn't BMJ, 1996.PMID 8555924
- [2]Richardson WS, Wilson MC, Nishikawa J, Hayward RS. The well-built clinical question: a key to evidence-based decisions ACP J Club, 1995.PMID 7582737
- [3]Laupacis A, Sackett DL, Roberts RS. An assessment of clinically useful measures of the consequences of treatment N Engl J Med, 1988.PMID 3374545
- [4]Jaeschke R, Guyatt GH, Sackett DL. Users' guides to the medical literature. III. How to use an article about a diagnostic test. B. What are the results and will they help me in caring for my patients? The Evidence-Based Medicine Working Group JAMA, 1994.PMID 8309035
- [5]Schulz KF, Altman DG, Moher D; CONSORT Group. CONSORT 2010 statement: updated guidelines for reporting parallel group randomised trials Int J Surg, 2011.PMID 22019563
- [6]Moher D, Liberati A, Tetzlaff J, Altman DG; PRISMA Group. Preferred reporting items for systematic reviews and meta-analyses: the PRISMA statement BMJ, 2009.PMID 19622551
- [7]von Elm E, Altman DG, Egger M, Pocock SJ, Gøtzsche PC, Vandenbroucke JP; STROBE Initiative. The Strengthening the Reporting of Observational Studies in Epidemiology (STROBE) statement: guidelines for reporting observational studies Lancet, 2007.PMID 18064739
- [8]Whiting PF, Rutjes AWS, Westwood ME, et al. QUADAS-2: a revised tool for the quality assessment of diagnostic accuracy studies Ann Intern Med, 2011.PMID 22007046
- [9]Guyatt GH, Oxman AD, Vist GE, et al; GRADE Working Group. What is quality of evidence and why is it important to clinicians? BMJ, 2008.PMID 18456631
- [10]Higgins JP, Thompson SG, Deeks JJ, Altman DG. Measuring inconsistency in meta-analyses BMJ, 2003.PMID 12958120
- [11]Higgins JPT, Altman DG, Gøtzsche PC, et al. The Cochrane Collaboration's tool for assessing risk of bias in randomised trials BMJ, 2011.PMID 22008217
- [12]Sterne JAC, Savović J, Page MJ, et al. RoB 2: a revised tool for assessing risk of bias in randomised trials BMJ, 2019.PMID 31462531
- [13]Sterne JA, Hernán MA, Reeves BC, et al. ROBINS-I: a tool for assessing risk of bias in non-randomised studies of interventions BMJ, 2016.PMID 27733354
- [14]CRASH-2 trial collaborators. Effects of tranexamic acid on death, vascular occlusive events, and blood transfusion in trauma patients with significant haemorrhage (CRASH-2): a randomised, placebo-controlled trial Lancet, 2010.PMID 20554319
- [15]RECOVERY Collaborative Group. Dexamethasone in Hospitalized Patients with Covid-19 N Engl J Med, 2021.PMID 32678530
- [16]Emberson J, Lees KR, Lyden P, et al; Stroke Thrombolysis Trialists' Collaborative Group. Effect of treatment delay, age, and stroke severity on the effects of intravenous thrombolysis with alteplase for acute ischaemic stroke: a meta-analysis of individual patient data from randomised trials Lancet, 2014.PMID 25106063